echarts 饼图
echarts 饼图
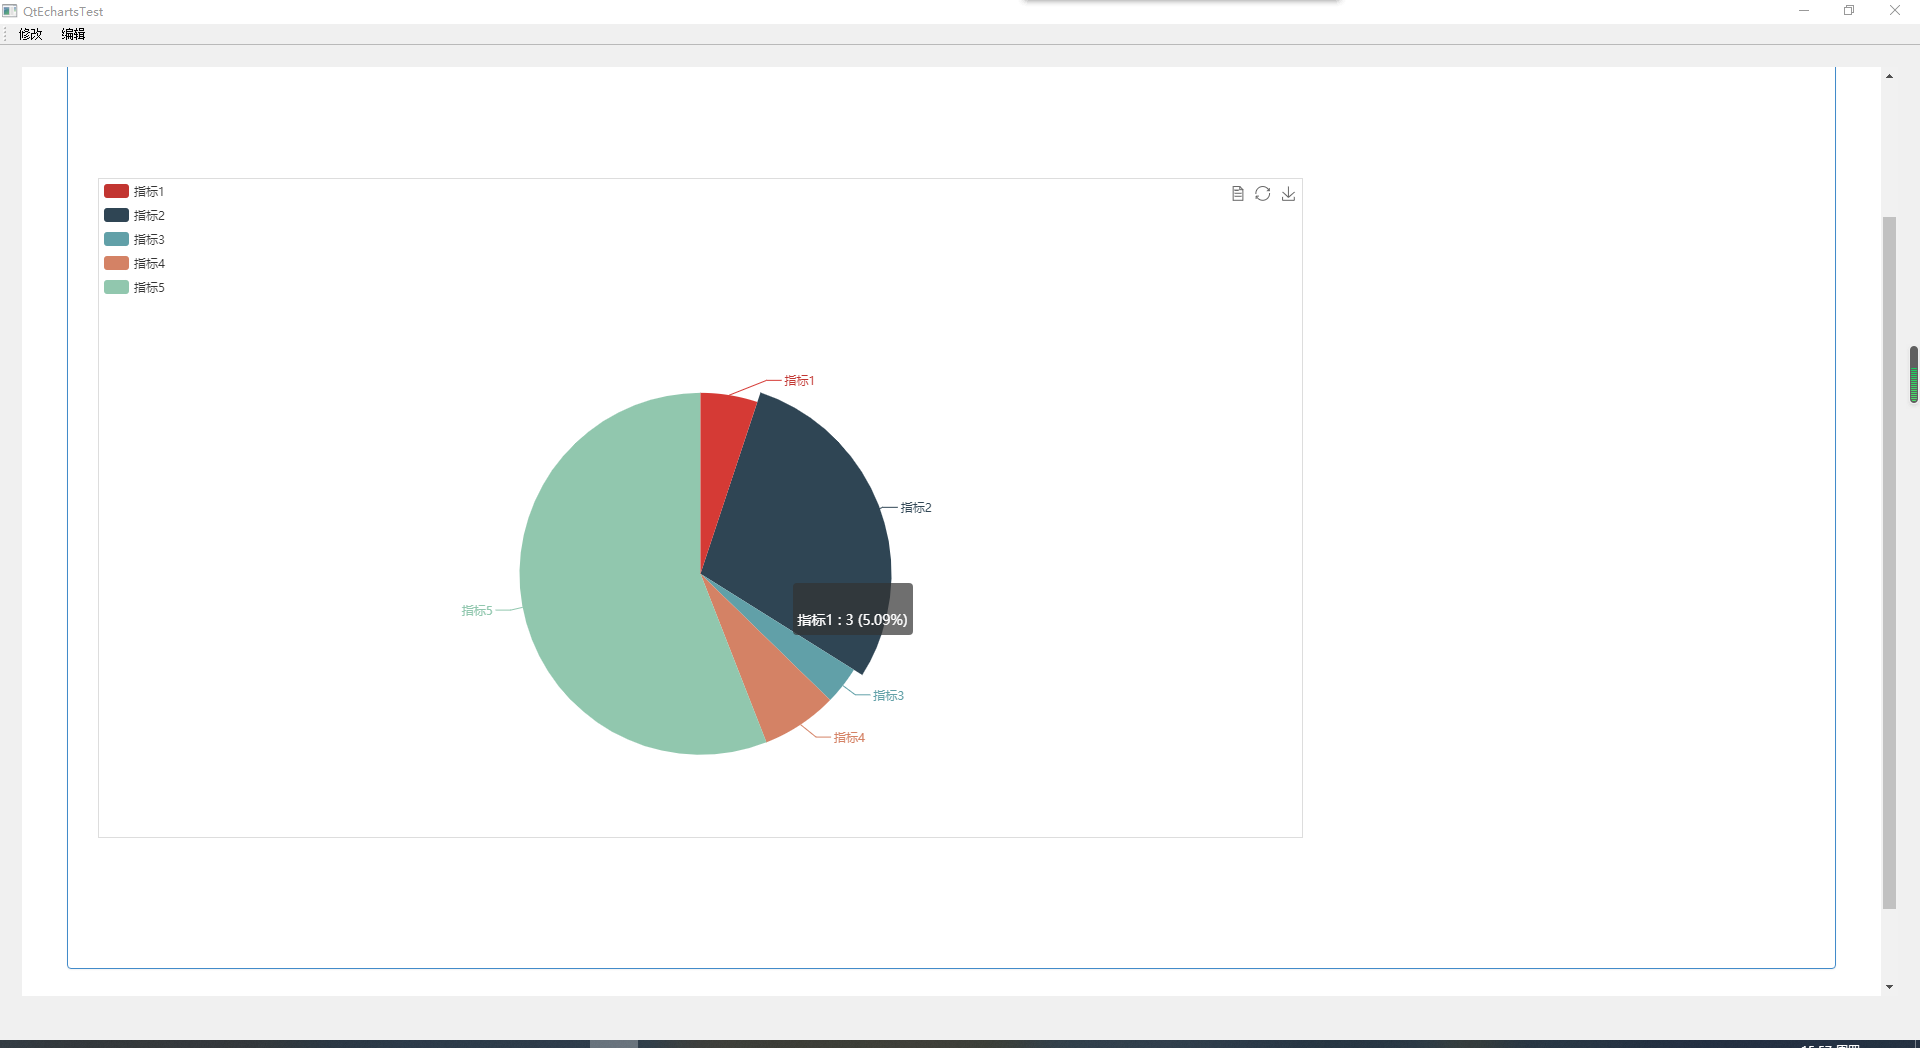
<!DOCTYPE html>
<html>
  <head>
  <base href="<%=basePath%>">
  <title>测试</title>

  <meta http-equiv="pragma" content="no-cache">
  <meta http-equiv="cache-control" content="no-cache">
  <meta http-equiv="expires" content="0">
  <meta http-equiv="keywords" content="keyword1,keyword2,keyword3">
  <meta http-equiv="description" content="This is my page">
  <link rel="stylesheet" href="css/bootstrap.min.css">


</head>

<body>
    <section class="hj-second-page-section">
      <div class="container-fluid">
        <div class="rows">
          <div class="col-xs-12 col-sm-12 col-md-12 col-lg-12">
            <div class="rows">
              <div class="col-xs-12 col-sm-12 col-md-12 col-lg-12 hj-jumbotron-div">
                <div class="panel panel-primary ng-scope">

                 <!-- pannel start -->
                 <div class="panel-body vc-pannel-body-toggle">
                     <div class="rows ng-scope">
                       <div class="panel-body vc-msg-panel-body">
                         <div class="row">

                          <div class="col-xs-12 col-sm-12 col-md-12 col-lg-12">
                             <div id="rt_chart1" style=""></div>
                          </div>

                         </div>
                      </div>
                     </div>

                 </div>

                 <!-- pannel end -->
                </div>
              </div>
            </div>
          </div>
        </div>
      </div>
    </section>


    <script src="js/echarts2.js"></script>
    <script src="js/jquery-2.2.3.min.js"></script>

    <script>
      /**
       * @description 绘制柱状图
       * @author luohan
       * @date 2017-7-28
       * @param
       */
      function initChart1() {
        $("#rt_chart1").height(660);
        $("#rt_chart1").width(1205);
        $("#rt_chart1").css("border","1px solid #ddd");
        var myChart1 = echarts.init(document.getElementById("rt_chart1"));

        var option1 = {
                title : {
                    text: '',
                    subtext: '',
                    x:'center'
                },
                tooltip : {
                    trigger: 'item',
                    formatter: "{a} <br/>{b} : {c} ({d}%)"
                },
                legend: {
                    orient : 'vertical',
                    x : 'left',
                    data:['指标1','指标2','指标3','指标4','指标5']
                },
                toolbox: {
                    show : true,
                    feature : {
                        mark : {show: true},
                        dataView : {show: true, readOnly: false},
                        magicType : {
                            show: true,
                            type: ['pie', 'funnel'],
                            option: {
                                funnel: {
                                    x: '25%',
                                    width: '50%',
                                    funnelAlign: 'left',
                                    max: 1548
                                }
                            }
                        },
                        restore : {show: true},
                        saveAsImage : {show: true}
                    }
                },
                calculable : true,
                series : [
                    {
                        name:'',
                        type:'pie',
                        radius : '55%',
                        center: ['50%', '60%'],

                        data:[
                            {value:3,name:'指标1'},
                            {value:17,name:'指标2'},
                            {value:2,name:'指标3'},
                            {value:4,name:'指标4'},
                            {value:33,name:'指标5'}

                        ]
                    }
                ]
            };


        // 为echarts对象加载数据
        myChart1.setOption(option1);
      }

      initChart1();
    </script>
</body>
</html>
QQ 3087438119

 浙公网安备 33010602011771号