
python 生成统计图表、写Excel文件
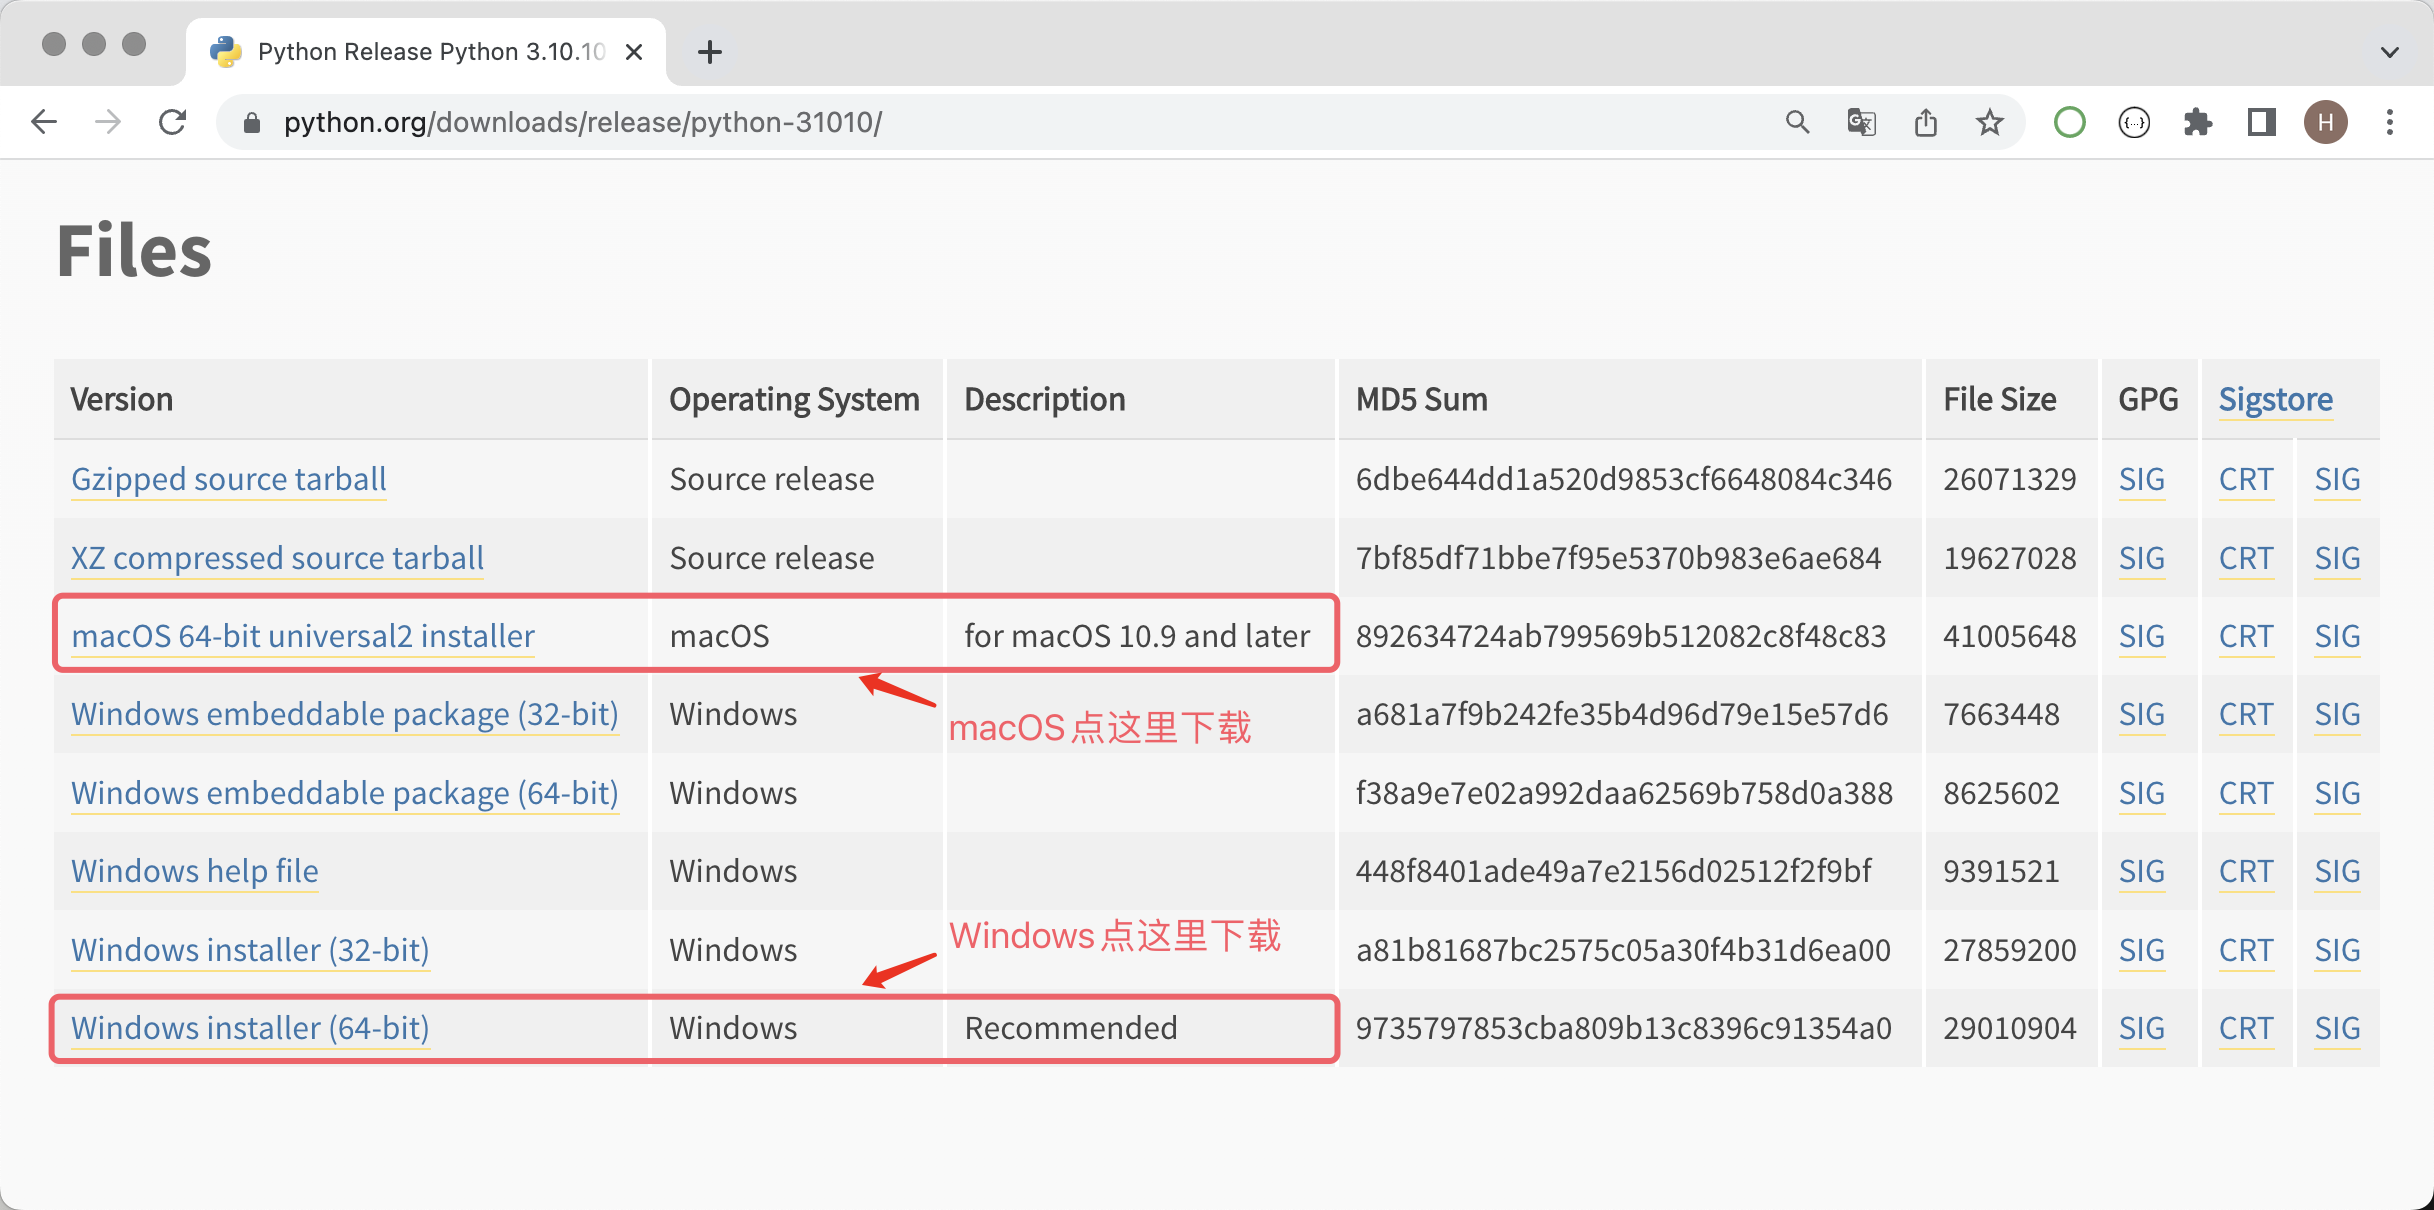
要先安装pip和python
1

2
3

4.

5.

6.打开cmd测试

第三方库openpyxl如何进行 Excel 文件操作,首先需要先安装它。
pip install openpyxl
from openpyxl import Workbook
from openpyxl.chart import BarChart, Reference

wb = Workbook(write_only=True)
sheet = wb.create_sheet()

rows = [
    ('类别', '销售A组', '销售B组'),
    ('手机', 40, 30),
    ('平板', 50, 60),
    ('笔记本', 80, 70),
    ('外围设备', 20, 10),
]

# 向表单中添加行
for row in rows:
    sheet.append(row)

# 创建图表对象
chart = BarChart()
chart.type = 'col'
chart.style = 10
# 设置图表的标题
chart.title = '销售统计图'
# 设置图表纵轴的标题
chart.y_axis.title = '销量'
# 设置图表横轴的标题
chart.x_axis.title = '商品类别'
# 设置数据的范围
data = Reference(sheet, min_col=2, min_row=1, max_row=5, max_col=3)
# 设置分类的范围
cats = Reference(sheet, min_col=1, min_row=2, max_row=5)
# 给图表添加数据
chart.add_data(data, titles_from_data=True)
# 给图表设置分类
chart.set_categories(cats)
chart.shape = 4
# 将图表添加到表单指定的单元格中
sheet.add_chart(chart, 'A10')

wb.save('demo.xlsx')
生成如图所示

二
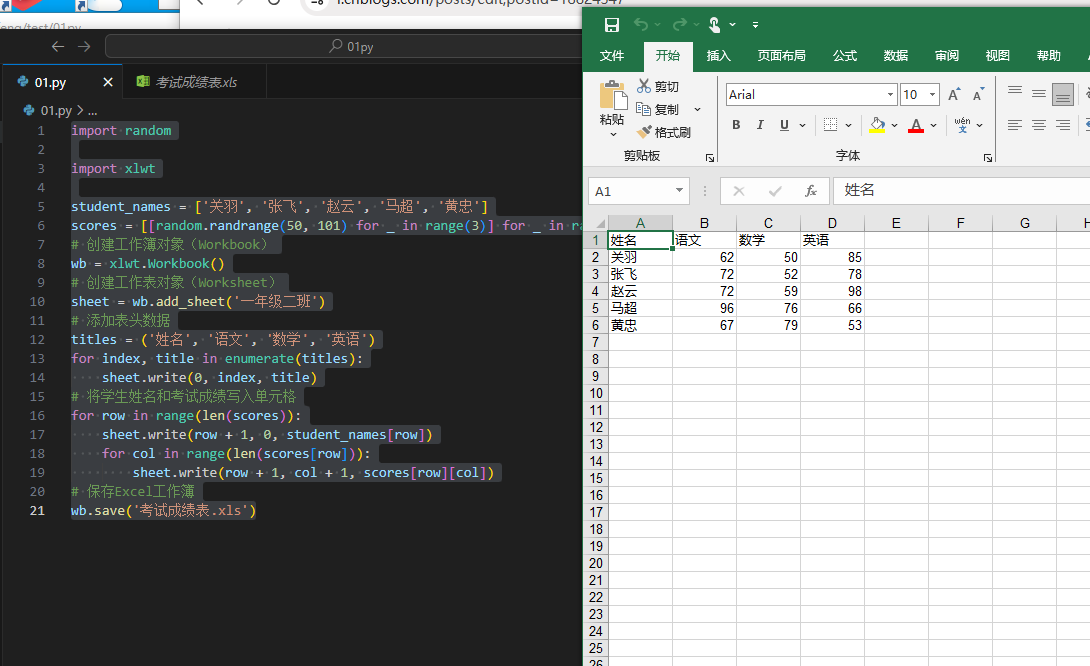
下面我们使用openpyxl来进行写 Excel 操作。
pip install xlwt xlrd xlutils
import random

import xlwt

student_names = ['关羽', '张飞', '赵云', '马超', '黄忠']
scores = [[random.randrange(50, 101) for _ in range(3)] for _ in range(5)]
# 创建工作簿对象(Workbook)
wb = xlwt.Workbook()
# 创建工作表对象(Worksheet)
sheet = wb.add_sheet('一年级二班')
# 添加表头数据
titles = ('姓名', '语文', '数学', '英语')
for index, title in enumerate(titles):
    sheet.write(0, index, title)
# 将学生姓名和考试成绩写入单元格
for row in range(len(scores)):
    sheet.write(row + 1, 0, student_names[row])
    for col in range(len(scores[row])):
        sheet.write(row + 1, col + 1, scores[row][col])
# 保存Excel工作簿
wb.save('考试成绩表.xls')

 浙公网安备 33010602011771号