

HighCharts使用心得(转载)
转载自:http://www.cnblogs.com/Olive116/p/3777021.html
1. 准备工作------下载HighCharts插件
跟ECharts一样,HighCharts也需要下载相应的插件,不过HightCharts的插件很简单,只有一个highcharts.js文件。可以从HighCharts官网上下载,具体地址如下:http://www.highcharts.com/download
另注:
如果需要导出图表,则需要exporting.js文件
如果需要一些特殊的图形呈现,则还需要下载highcharts-more.js
2. 新建一个解决方案或网站,引用下载的highcharts.js文件,进行图表展示。
在这个过程中,我会逐步的跟大家讲解如何使用highcharts.js进行图表展示。
2.1 新建解决方案(或网站),目录结构如下

另注:
一般情况下如果不需要导出图片、且只使用常规的图形,exportting.js和highchart-more.js可以不要,只留一个highcharts.js文件即可。
其中的HighCharts.js文件为我自己总结的使用帮助文件,主要用来配置图表类型、图表数据的处理、格式化等操作,下边会进一步讲解。
此外需要注意的是这里引用的Jquery文件版本为最近版本,VS里边默认的为1.4.1的版本太低,最新的highcharts需要高版本的jQuery文件。
2.2 HighChart.js文件介绍
在2.1中对此文件有一个初步的介绍,这一小节里专门来介绍这个文件。该文件的主要功能是用来配置各种图表类型的配置项,同时对用户提供的参数进行格式化、图表的呈现等功能。
文件的目录结构如下:
|
1
2
3
4
5
6
7
8
9
10
11
12
13
14
15
16
17
18
19
20
21
22
23
24
25
26
27
28
29
30
31
32
33
34
35
36
37
38
39
40
41
42
43
44
45
46
47
48
49
50
51
52
53
54
55
|
var HighChart = { ChartDataFormate: {//数据格式化 FormateNOGroupData: function (data) {//处理不分组的数据 var categories = []; var datas = []; for (var i = 0; i < data.length; i++) { categories.push(data[i].name || ""); datas.push([data[i].name, data[i].value || 0]); } return { category: categories, data: datas }; },………… }, ChartOptionTemplates: {//图表配置项 Pie: function (data, name, title) { var pie_datas = HighChart.ChartDataFormate.FormateNOGroupData(data); var option = { chart: { plotBackgroundColor: null, plotBorderWidth: null, plotShadow: false }, ……. }; return option; }, RenderChart: function (option, container) {//页面渲染 container.highcharts(option); } |
完整代码:
2.3 具体的页面展示
2.3.1 饼图
l 页面引用
|
1
2
3
4
5
6
7
8
9
10
11
12
13
14
15
16
17
18
19
20
21
22
23
|
<script src="../Scripts/jquery-1.11.0.min.js" type="text/javascript"></script><script src="../Statics/highcharts.js" type="text/javascript"></script><script src="../Statics/exporting.js" type="text/javascript"></script><script src="../Statics/HighChart.js" type="text/javascript"></script><script type="text/javascript"> $(function () { var data = [{ name: 'olive', value: 116 }, { name: 'momo', value: 115 }, { name: 'only', value: 222 }, { name: 'for', value: 324}]; var opt = HighChart.ChartOptionTemplates.Pie(data,'Love-Rate',"饼图示例"); var container = $("#container"); HighChart.RenderChart(opt, container); });</script> |
l 效果展示

2.3.2 折线图
l 页面引用
|
1
2
3
4
5
6
7
8
9
10
11
12
13
14
15
16
17
18
19
20
21
22
23
24
25
26
27
28
29
30
31
32
33
34
35
36
37
38
39
40
41
42
43
44
45
46
47
48
49
50
51
|
<script src="../Scripts/jquery-1.11.0.min.js" type="text/javascript"></script> <script src="../Statics/highcharts.js" type="text/javascript"></script> <script src="../Statics/exporting.js" type="text/javascript"></script> <script src="../Statics/HighChart.js" type="text/javascript"></script> <script type="text/javascript"> $(function () { var data = [ { name: '2013-01', group: 'olive', value: 116 }, { name: '2013-01', group: 'momo', value: 115 }, { name: '2013-01', group: 'only', value: 222 }, { name: '2013-01', group: 'for', value: 324 }, { name: '2013-02', group: 'olive', value: 156 }, { name: '2013-02', group: 'momo', value: 185 }, { name: '2013-02', group: 'only', value: 202 }, { name: '2013-02', group: 'for', value: 34 }, { name: '2013-03', group: 'olive', value: 16 }, { name: '2013-03', group: 'momo', value: 51 }, { name: '2013-03', group: 'only', value: 22 }, { name: '2013-03', group: 'for', value: 84 } ]; var opt = HighChart.ChartOptionTemplates.Line(data, 'Love-Rate', "折线图示例"); var container = $("#container"); HighChart.RenderChart(opt, container); }); </script> |
l 效果展示

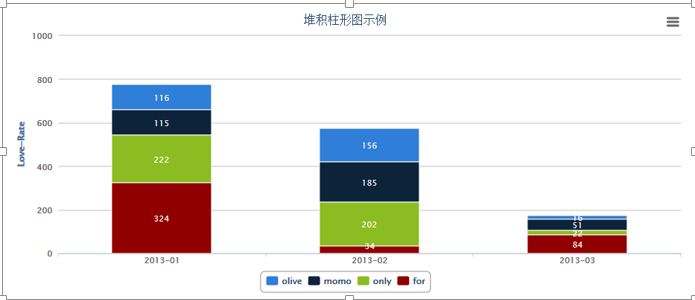
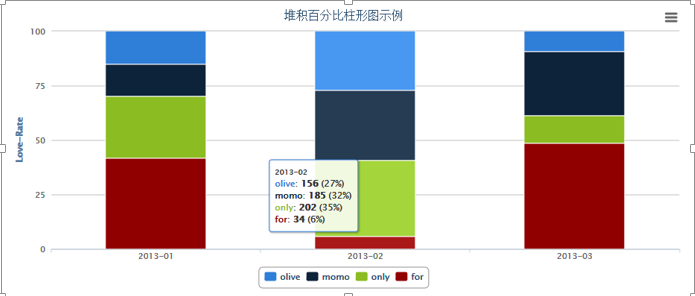
2.3.3 柱形图
l 页面引用
|
1
2
3
4
5
6
7
8
9
10
11
12
13
14
15
16
17
18
19
20
21
22
23
24
25
26
27
28
29
30
31
32
33
34
35
36
37
|
<script src="../Scripts/jquery-1.11.0.min.js" type="text/javascript"></script> <script src="../Statics/highcharts.js" type="text/javascript"></script> <script src="../Statics/exporting.js" type="text/javascript"></script> <script src="../Statics/HighChart.js" type="text/javascript"></script> <script type="text/javascript"> $(function () { var data = [ { name: '2013-01', group: 'olive', value: 116 }, { name: '2013-01', group: 'momo', value: 115 }, { name: '2013-01', group: 'only', value: 222 }, { name: '2013-01', group: 'for', value: 324 }, { name: '2013-02', group: 'olive', value: 156 }, { name: '2013-02', group: 'momo', value: 185 }, { name: '2013-02', group: 'only', value: 202 }, { name: '2013-02', group: 'for', value: 34 }, { name: '2013-03', group: 'olive', value: 16 }, { name: '2013-03', group: 'momo', value: 51 }, { name: '2013-03', group: 'only', value: 22 }, { name: '2013-03', group: 'for', value: 84 } ]; var opt = HighChart.ChartOptionTemplates.Bars(data, '','','Love-Rate', "分组柱形图示例"); var container = $("#container"); HighChart.RenderChart(opt, container); var opt1 = HighChart.ChartOptionTemplates.Bars(data, true,'','Love-Rate', "堆积柱形图示例"); var container1 = $("#container1"); HighChart.RenderChart(opt1, container1); var opt2 = HighChart.ChartOptionTemplates.Bars(data, '',true ,'Love-Rate', "堆积百分比柱形图示例"); var container2 = $("#container2"); HighChart.RenderChart(opt2, container2); }); </script> |
l 展示效果
分组柱形图

堆积图
堆积百分比图

 浙公网安备 33010602011771号