ELK 6.2.4搭建
开源实时日志分析ELK平台能够完美的解决我们上述的问题,ELK由ElasticSearch、Logstash和Kiabana三个开源工具组成。
官方网站:https://www.elastic.co/products
-
Elasticsearch是个开源分布式搜索引擎,它的特点有:分布式,零配置,自动发现,索引自动分片,索引副本机制,restful风格接口,多数据源,自动搜索负载等。
-
Logstash是一个完全开源的工具,他可以对你的日志进行收集、过滤,并将其存储供以后使用(如,搜索)。
-
Kibana 也是一个开源和免费的工具,它Kibana可以为 Logstash 和 ElasticSearch 提供的日志分析友好的 Web 界面,可以帮助您汇总、分析和搜索重要数据日志。
ELK下载:https://www.elastic.co/downloads/
ELK工作原理:

ElasticSearch
配置ElasticSearch:
unzip elasticsearch-6.2.4.zip
cd elasticsearch-6.2.4
然后编辑ES的配置文件:
vi config/elasticsearch.yml
修改以下配置项:
cluster.name=es_cluster
node.name=node0
path.data=/tmp/elasticsearch/data
path.logs=/tmp/elasticsearch/logs
#当前hostname或IP,我这里是node1
network.host=node1
network.port=9200
其他的选项保持默认,然后启动ES:
nohup sh elasticsearch > nohup.log &
注意:
1.需要添加用户elk,ES不能以root用户进行启动
2.可能出现的错误:
- max file descriptors [4096] for elasticsearch process likely too low, increase to at least [65536]
vi /etc/security/limits.conf
elk soft nofile 819200
elk hard nofile 819200
- max number of threads [1024] for user [work] likely too low, increase to at least [2048]
vi /etc/security/limits.d/90-nproc.conf
*          soft    nproc     1024
#修改为:
*          soft    nproc     2048
- max virtual memory areas vm.max_map_count [65530] likely too low, increase to at least [262144]
vi /etc/sysctl.conf
#增加改行配置:
vm.max_map_count=655360
#保存退出后,执行:
sysctl -p
- 另外再配置ES的时候,threadpool.bulk.queue_size 已经变成了thread_pool.bulk.queue_size ,ES_HEAP_SIZE,ES_MAX_MEM等配置都变为ES_JAVA_OPTS这一配置项,如限制内存最大最小为1G:
export ES_JAVA_OPTS="-Xms1g -Xmx1g"
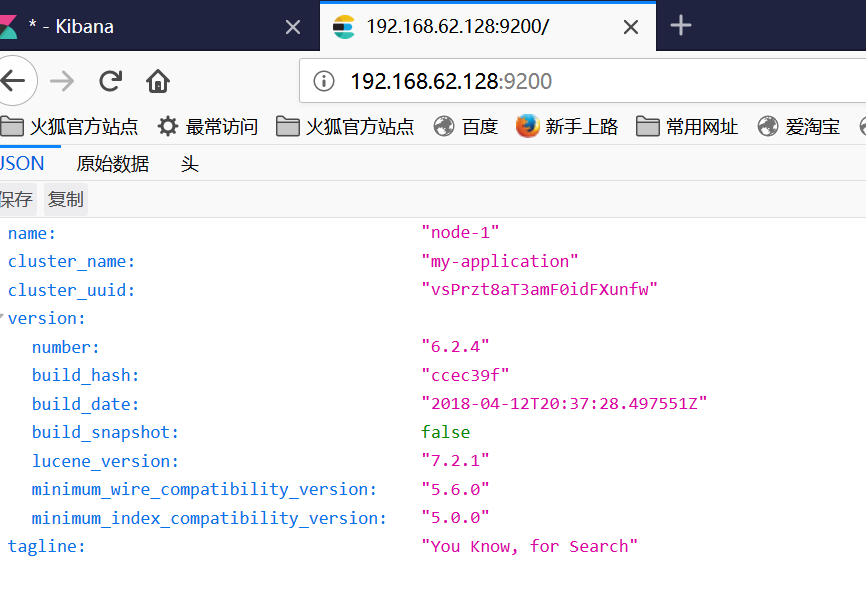
然后可以打开页面http://node1:9200/,将会看到以下内容:(我是通过外部访问虚拟机,因此为了简单没有配置host文件,直接用ip访问)
Logstash
配置Logstash:
tar -zxvf logstash-6.2.4.tar.gz
cd logstash-6.2.4
编写配置文件(名字和位置可以随意,这里我放在config目录下,取名为log_app.conf):
vi config/log_app.config
#以下为内容
input {
        file {
                path => "/usr/local/software/elk/app.log"
                start_position => "beginning" #从文件开始处读写
        }
#       stdin {}  #可以从标准输入读数据
}
filter {
  #Only matched data are send to output.
}
output {
  # For detail config for elasticsearch as output,
  # See: https://www.elastic.co/guide/en/logstash/current/plugins-outputs-elasticsearch.html
  elasticsearch {
    action => "index"          #The operation on ES
    hosts  => "node1:9200"     #ElasticSearch host, can be array.
    index  => "applog"         #The index to write data to.
  }
}
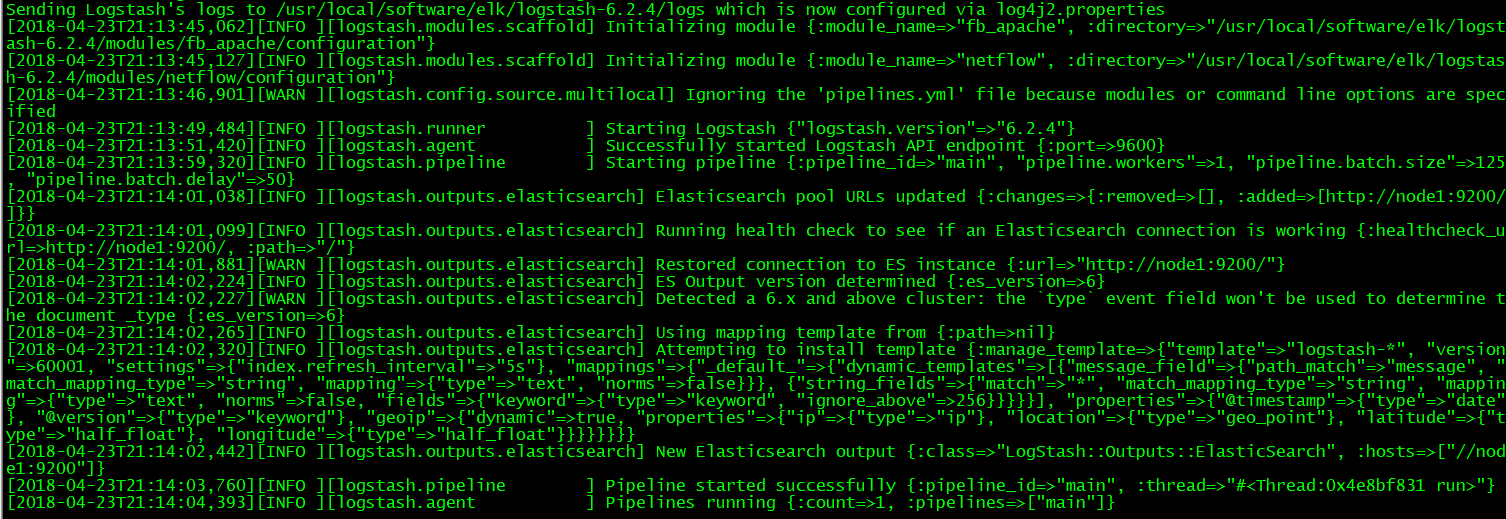
其他的选项保持默认,然后启动Logstash:
# -f为指定配置文件
nohup sh ./bin/logstash -f ../config/log_app.config > nohup.log &
日志:
Kibana
配置Kibana:
tar -zxvf kibana-6.2.4-linux-x86_64.tar.gz
cd kibana-6.2.4-linux-x86_64
修改以下几项(由于是单机版的,因此host的值也可以使用localhost来代替,这里仅仅作为演示):
server.port: 5601
server.host: “node1”
elasticsearch.url: http://node1:9200
kibana.index: “.kibana”
启动kibana:
nohup sh ./bin/kibana > nohup.log &
启动后界面:

然后需要创建index,步骤如下:
①点击左边iscover出现以下界面
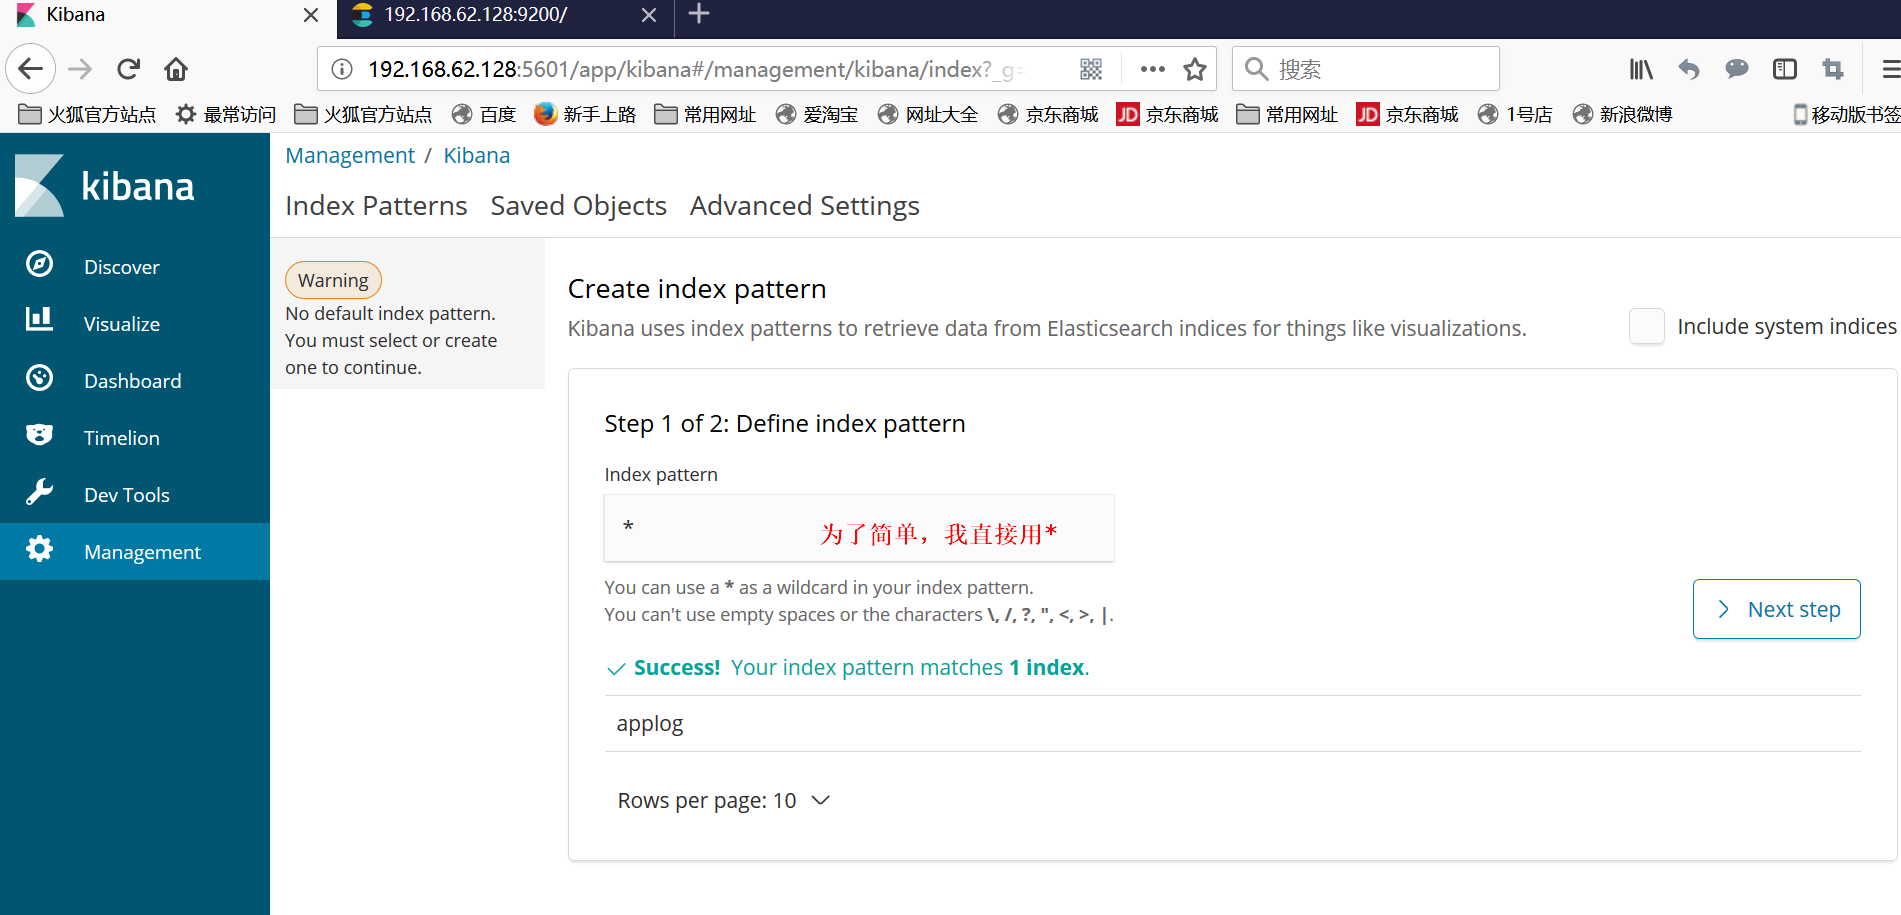
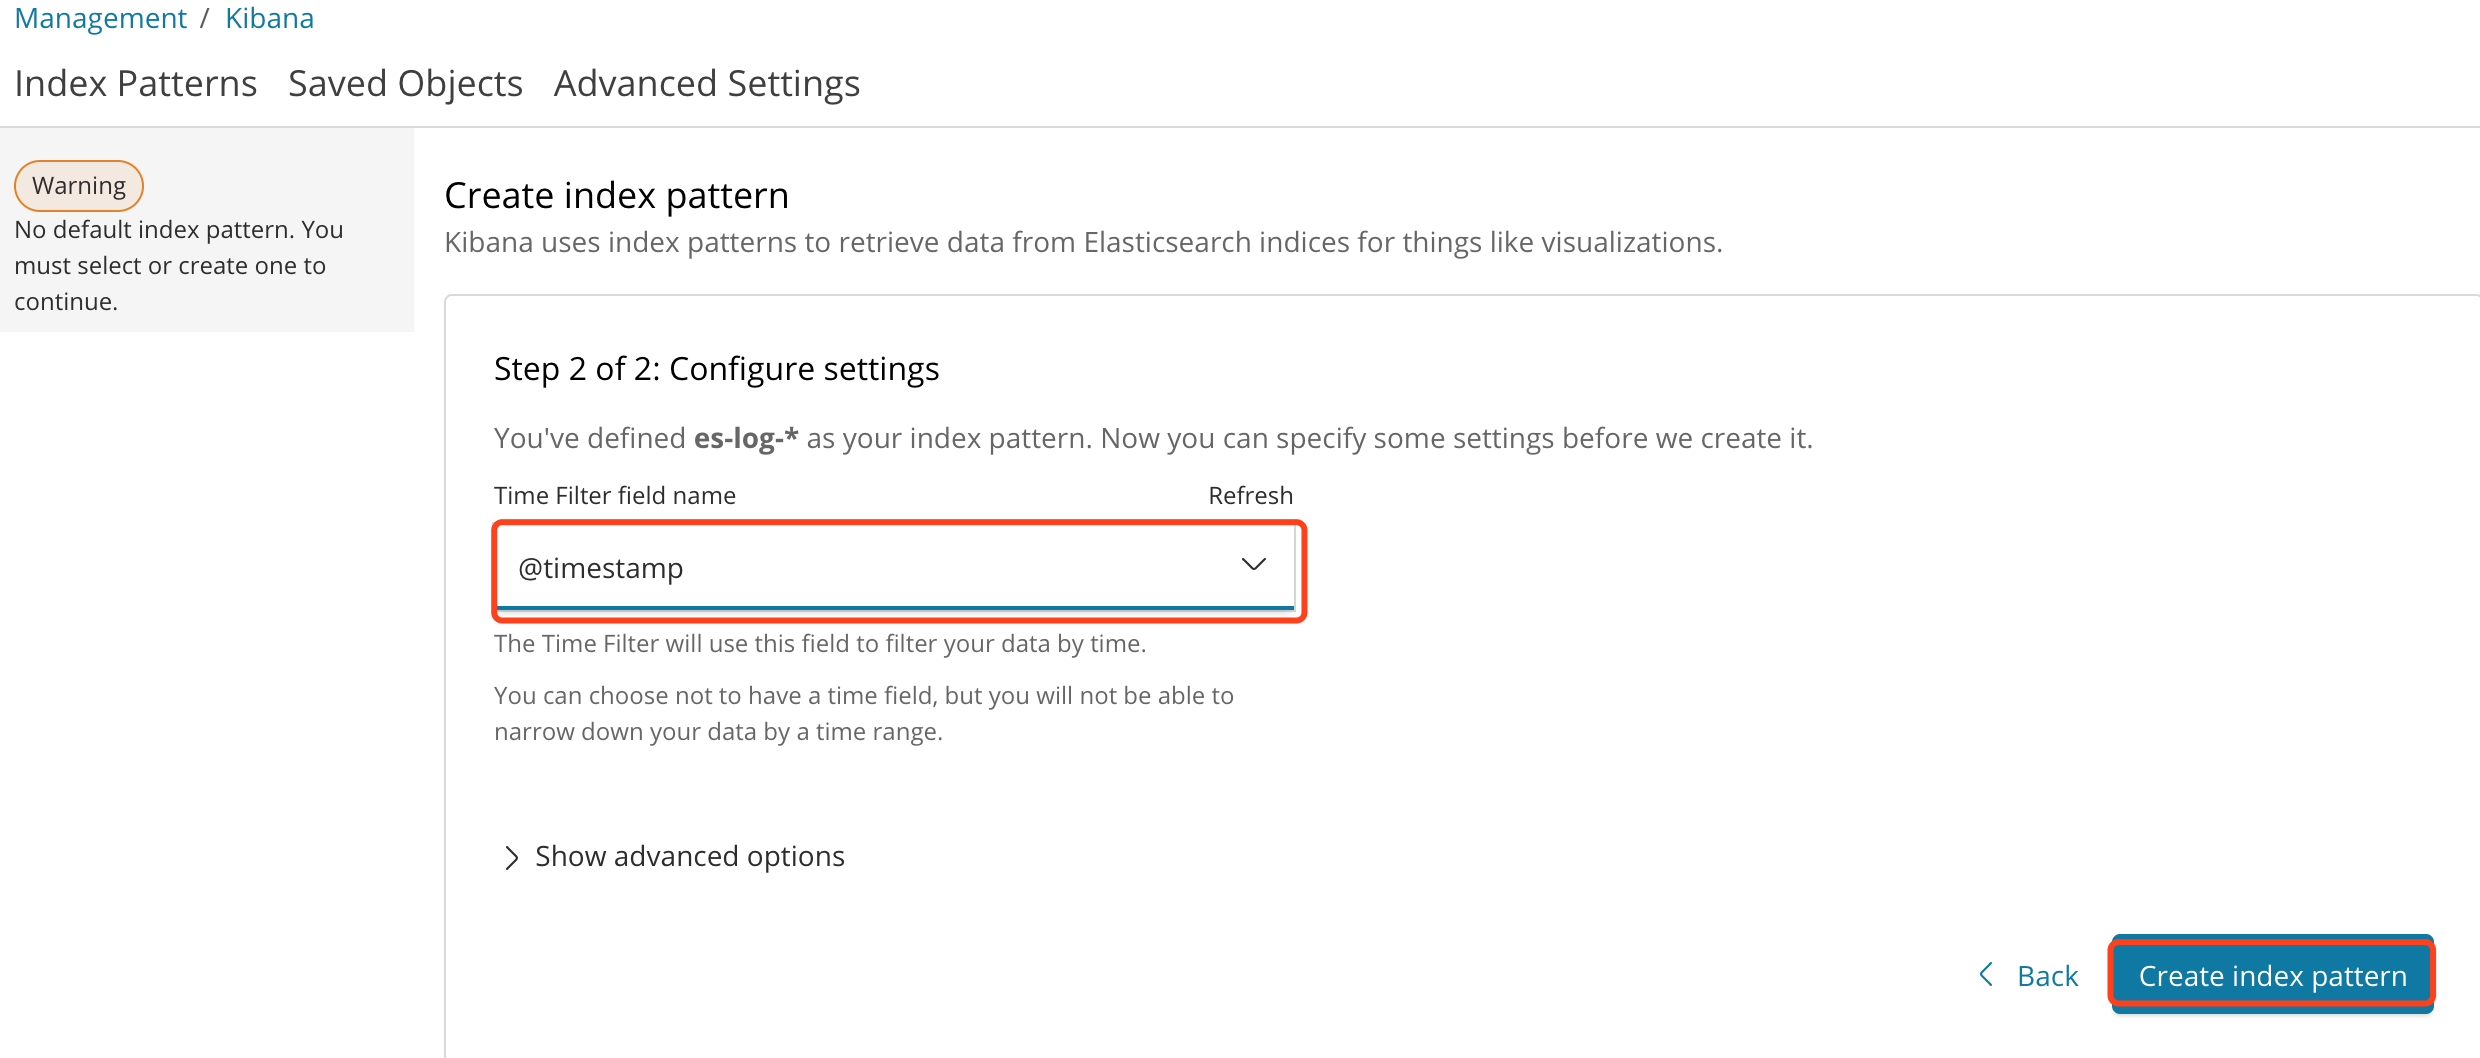
②按照注释配置,然后点击Next step,在第二页 选择@timestamp点击create创建
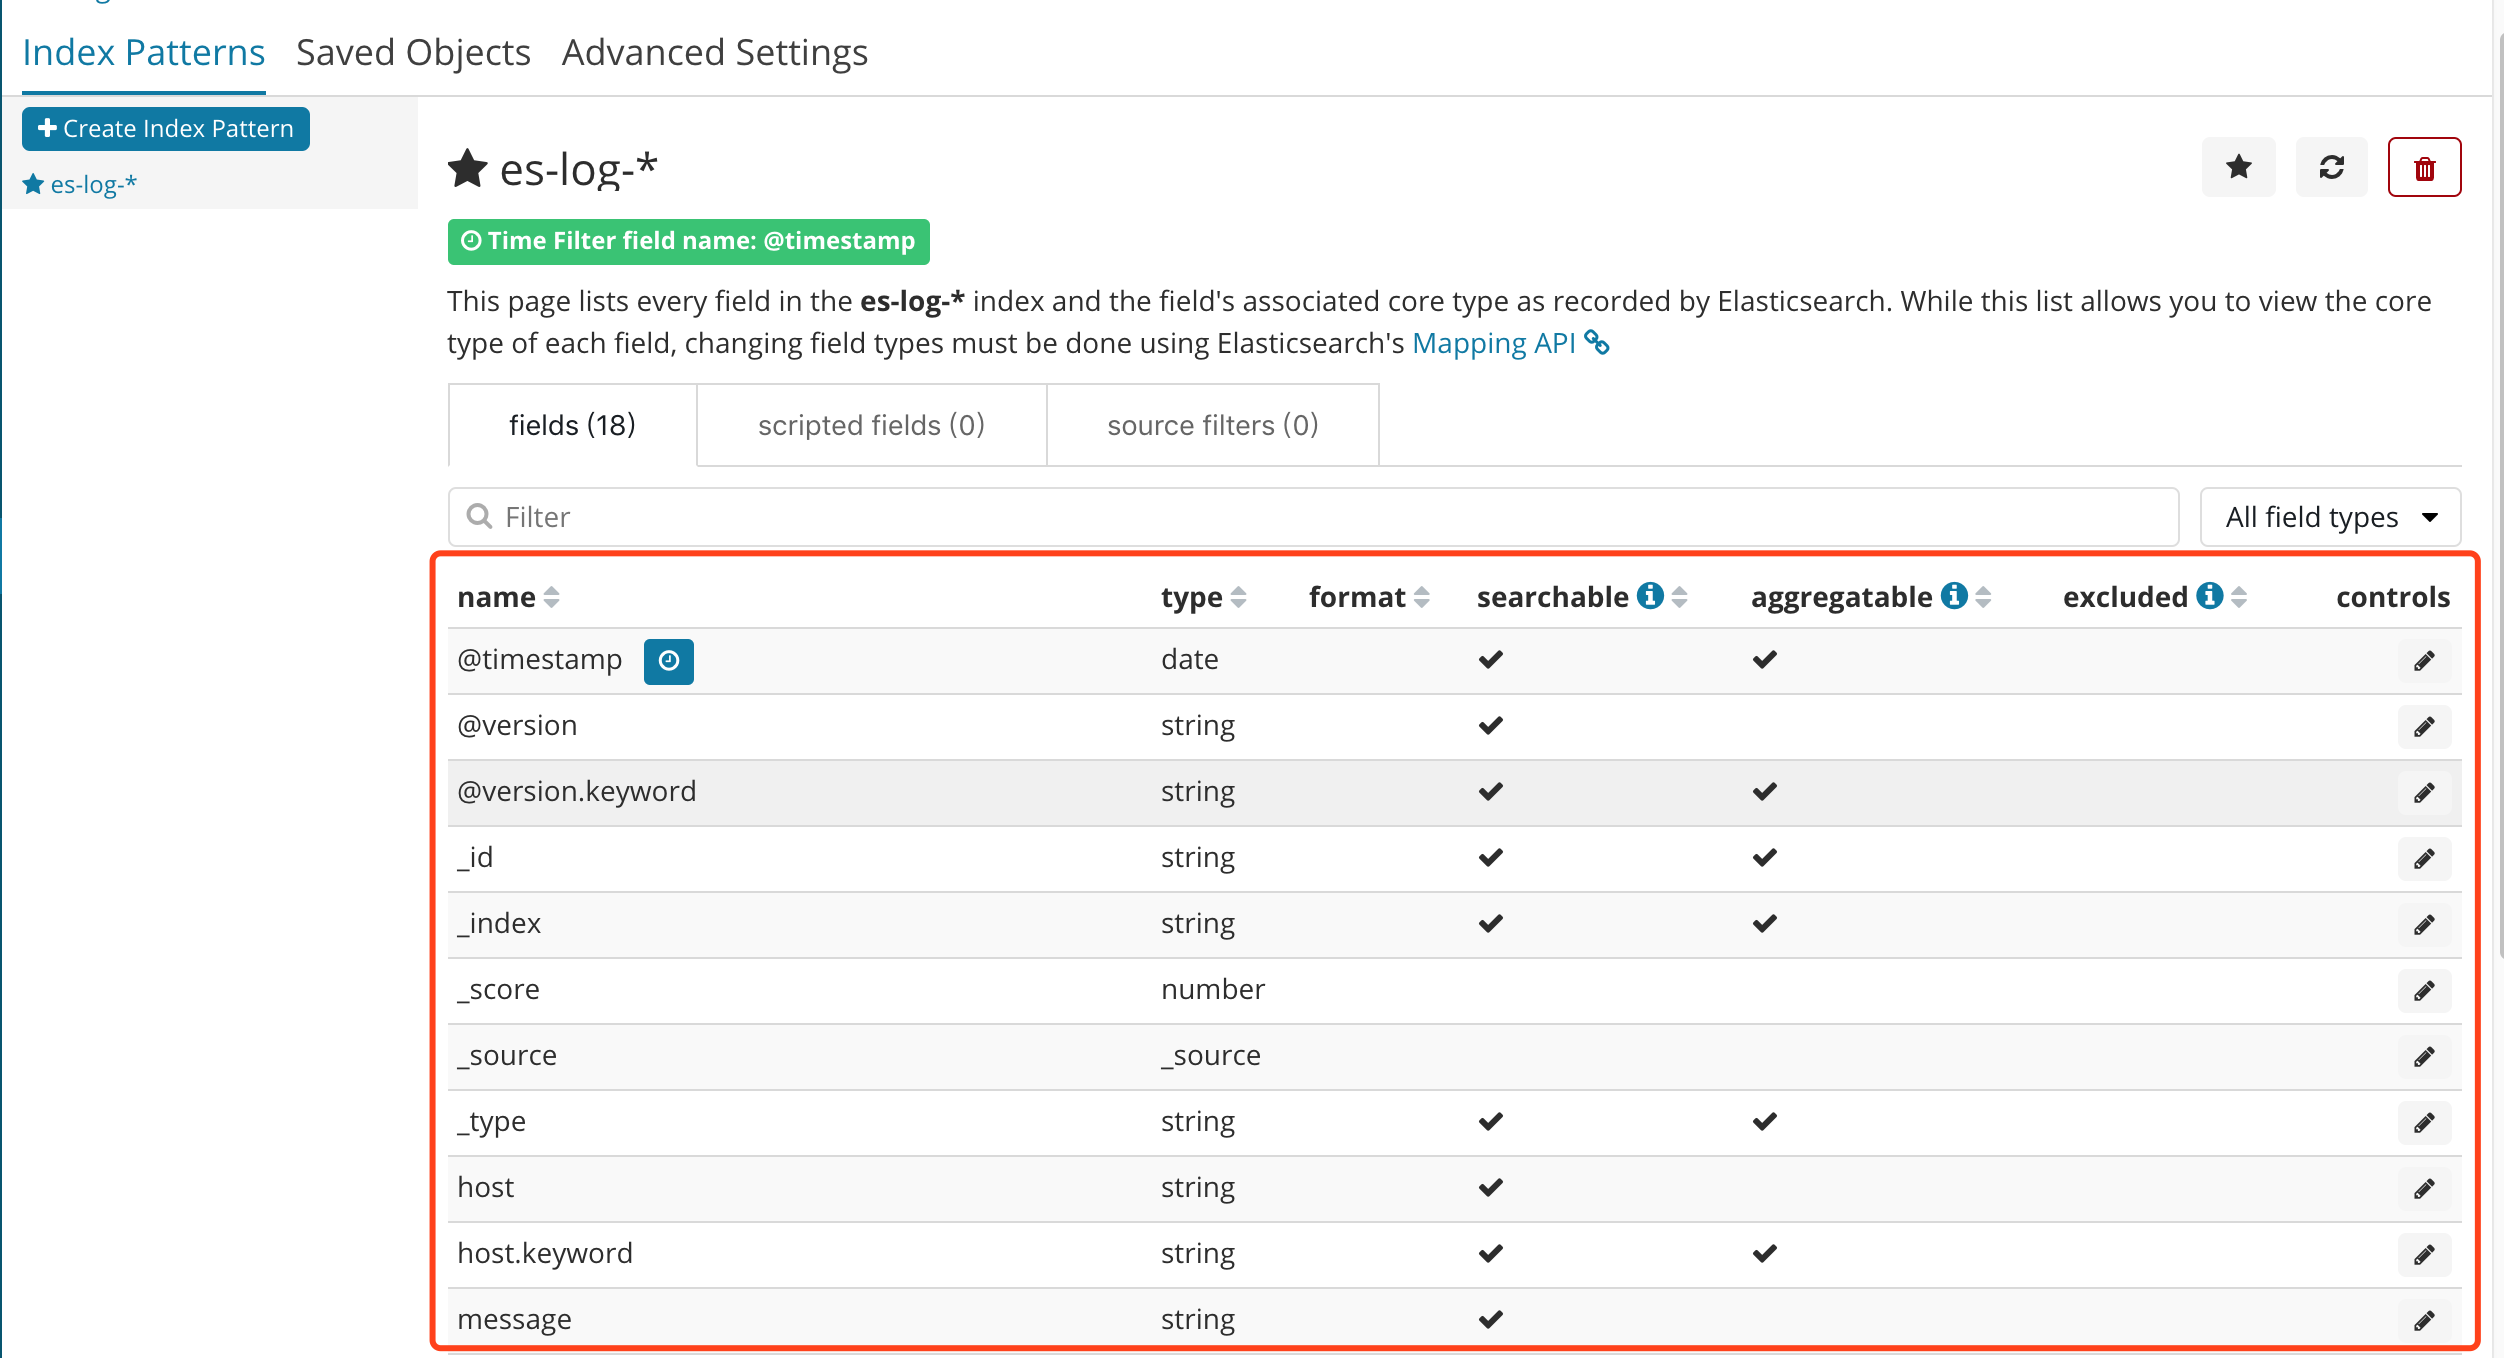
③创建完成之后,可以看到以下一个界面,红框内是 自动生成的域,也可以理解为 跟数据库中的字段类似,其中有一个message字段,就是我们想要的日志信息。
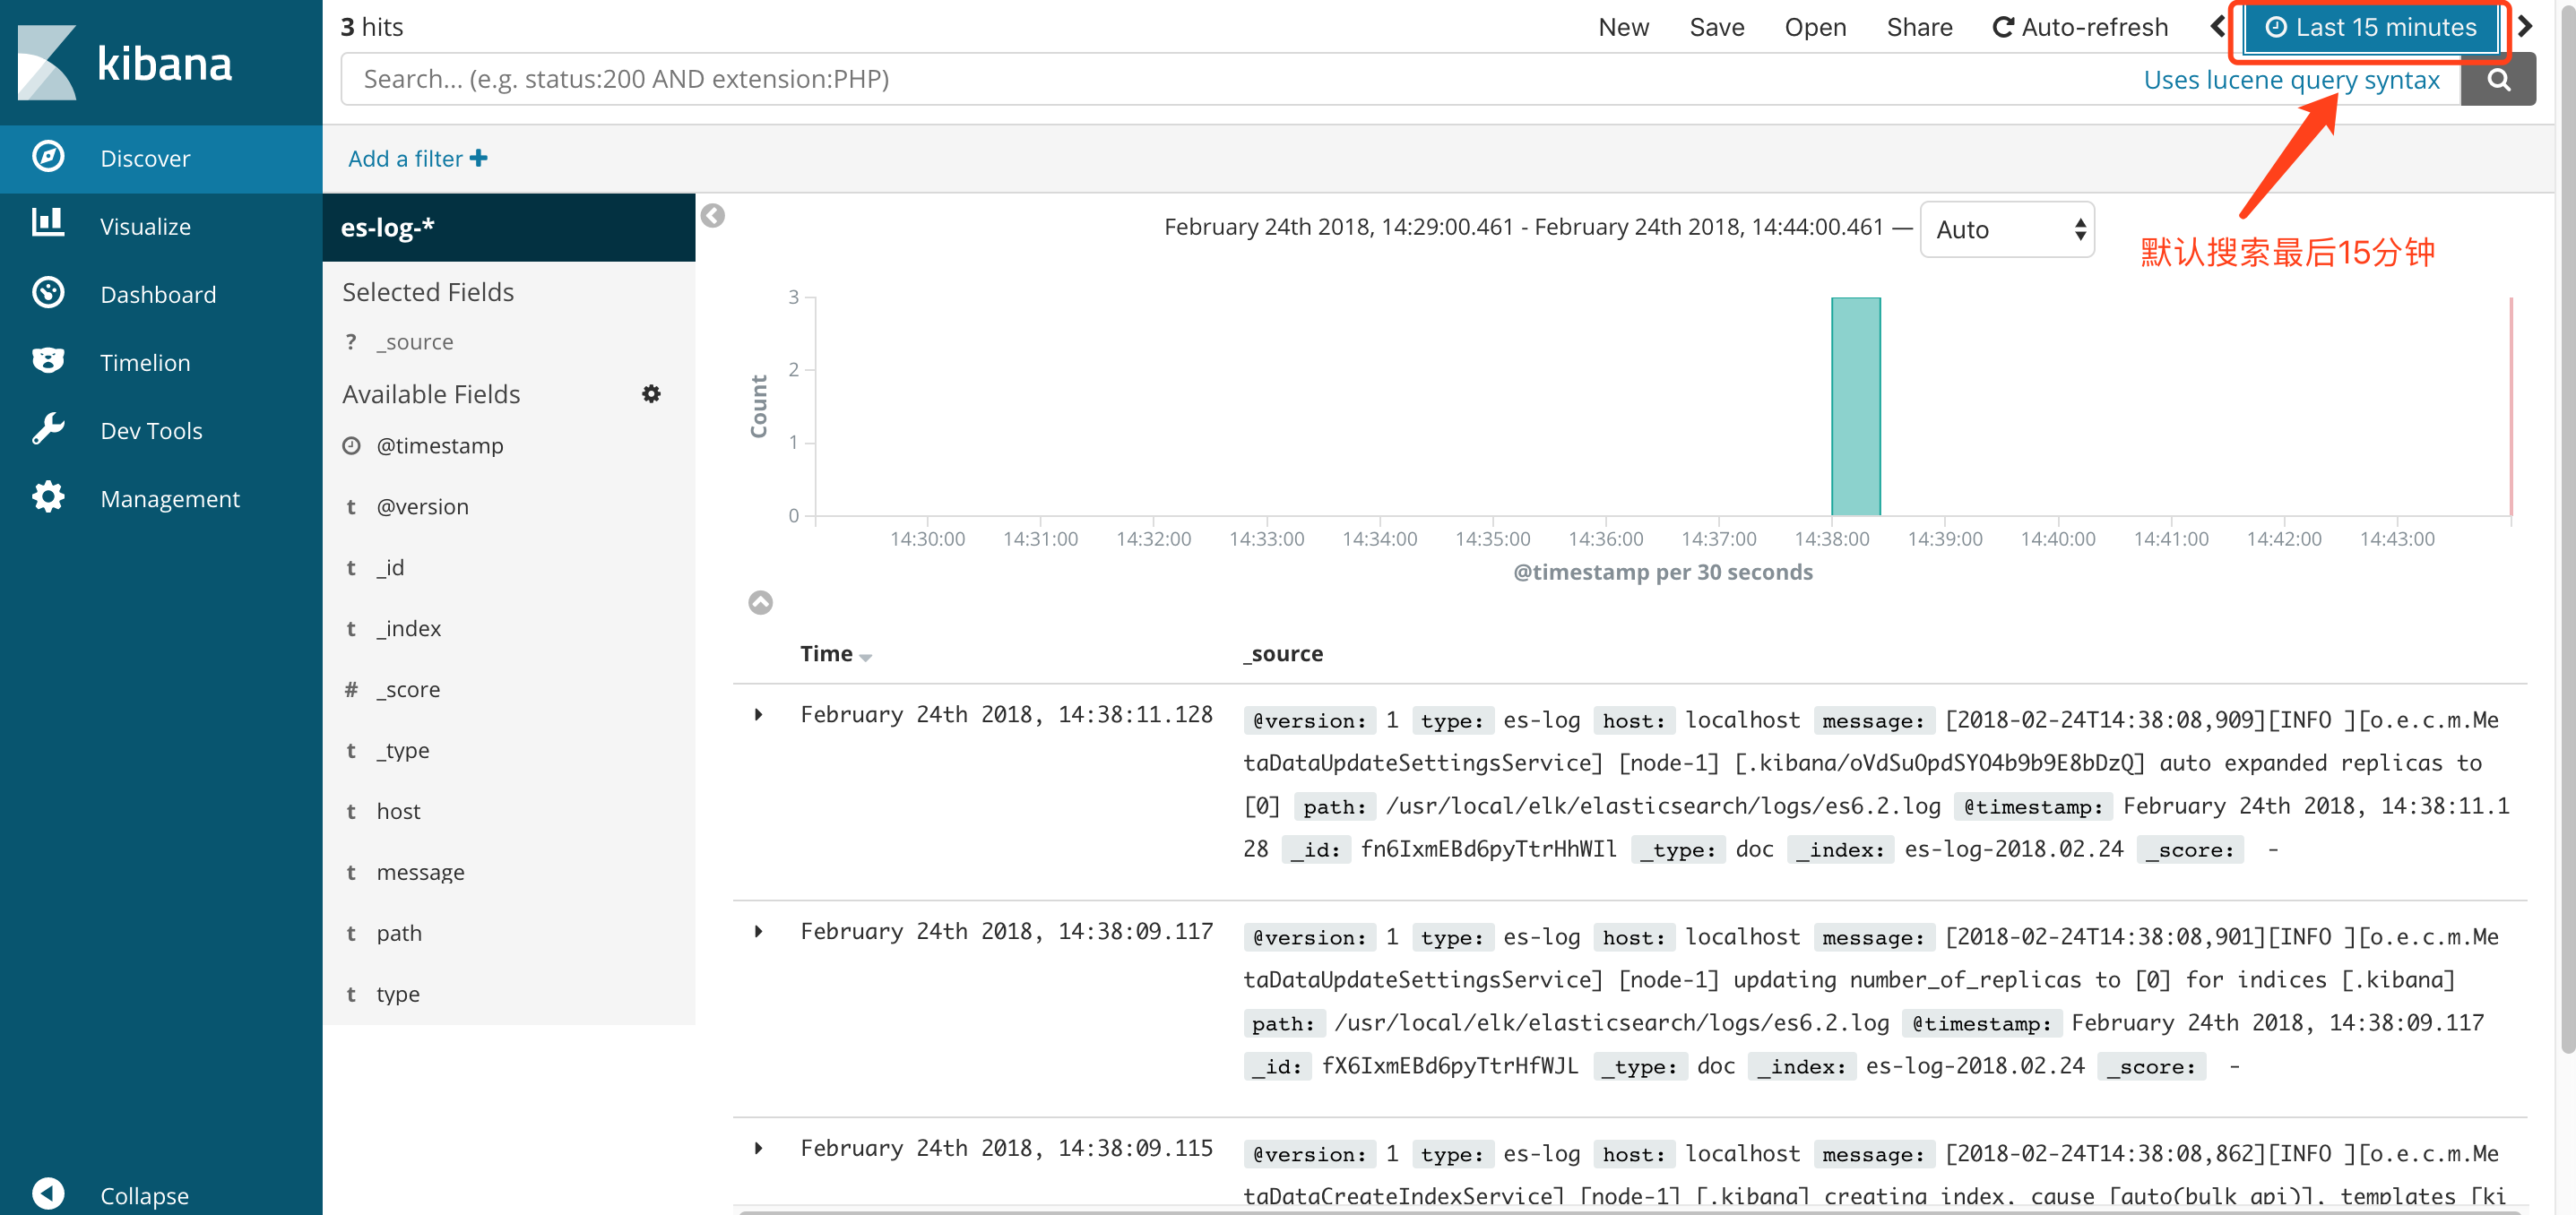
④再次点击Discover出现以下界面,可以看到默认搜索的是最后15分钟的日志,可以通过点击设置搜索的时间范围.
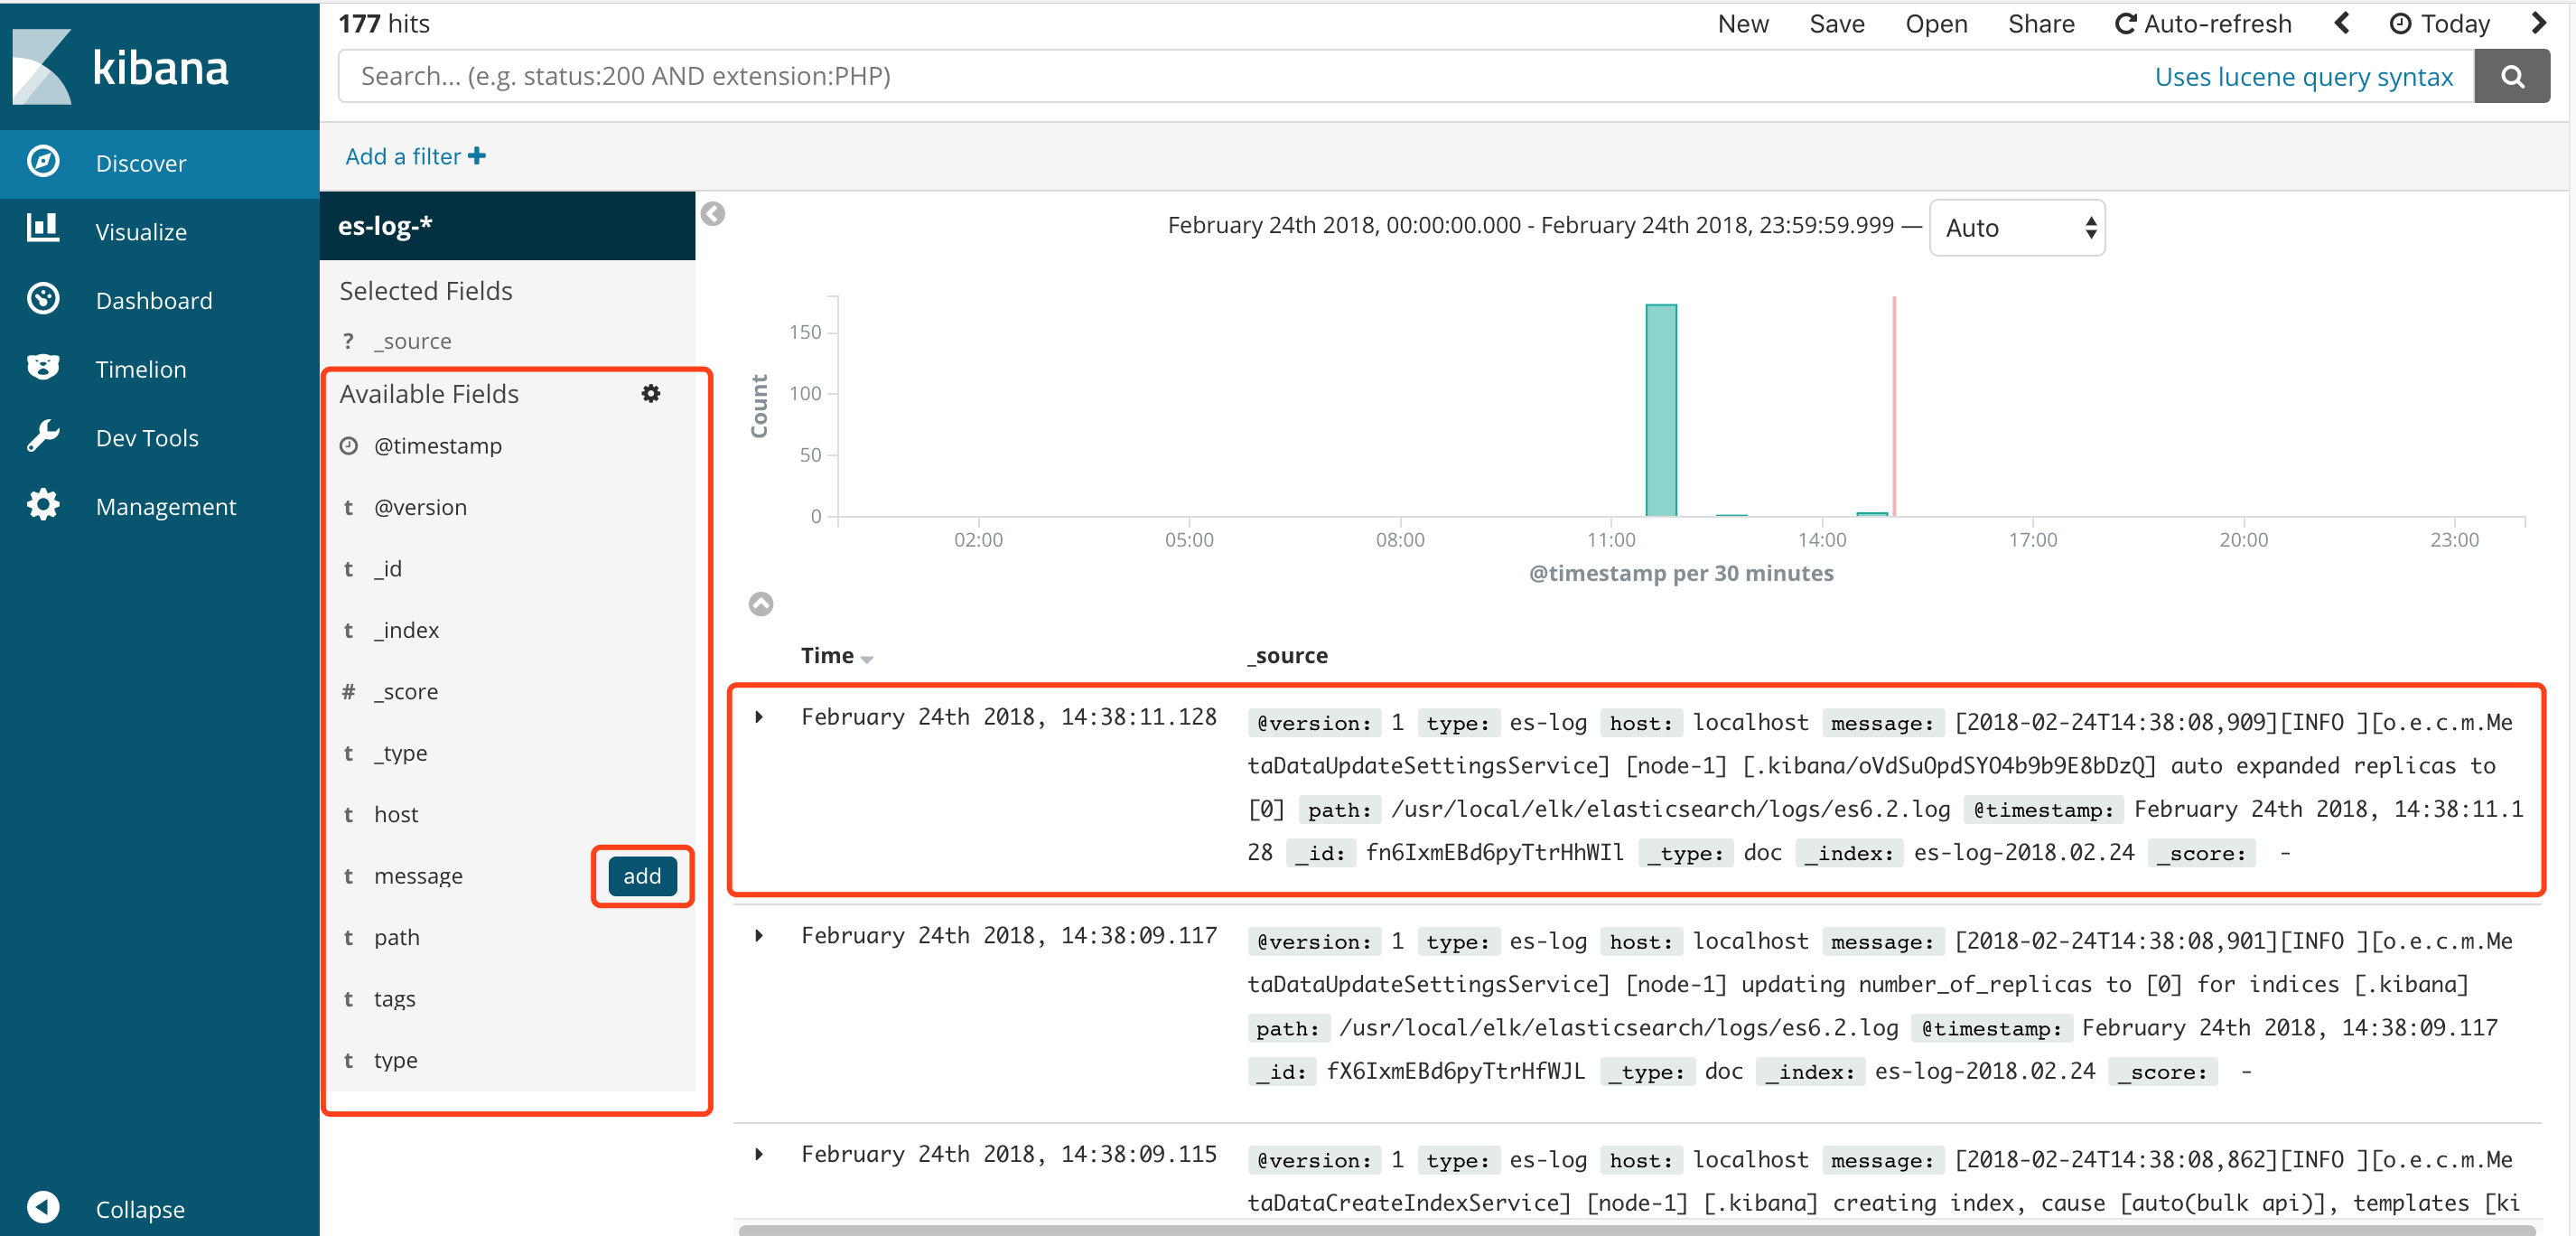
⑤可以点击右侧域的add设置需要显示的字段
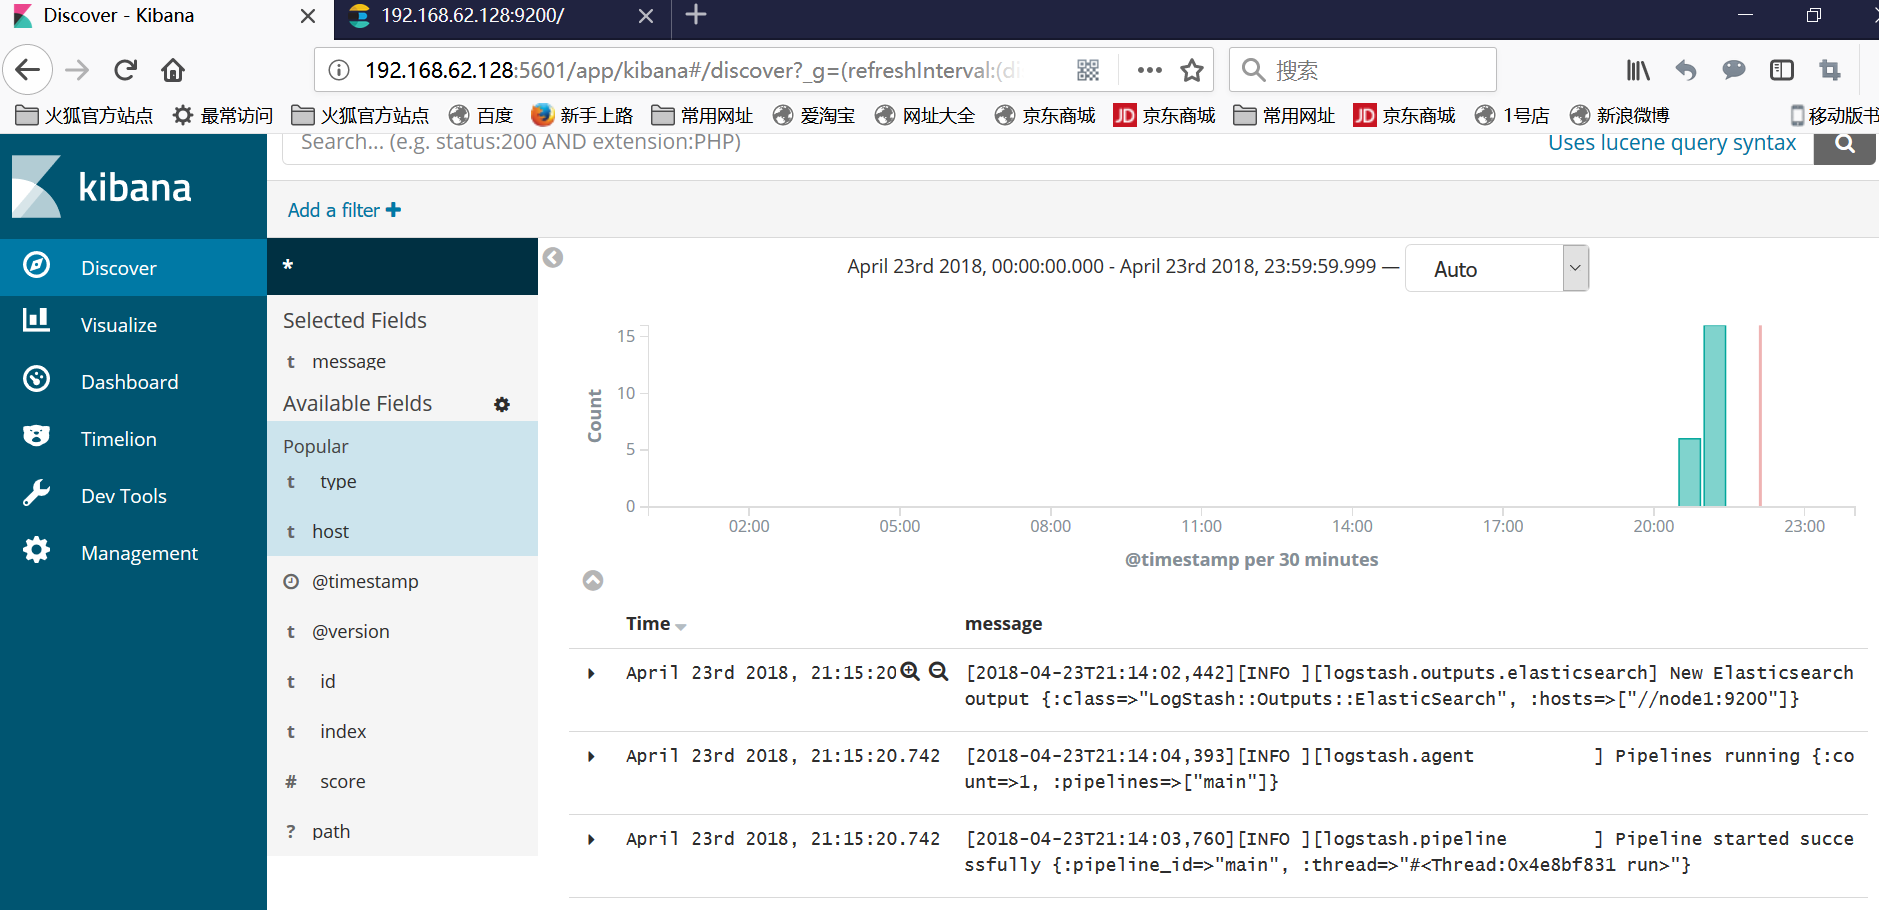
添加完成之后,日志显示如下:
参考:https://my.oschina.net/itblog/blog/547250
https://blog.csdn.net/abcd_d_/article/details/53018927
https://blog.csdn.net/qq_34021712/article/details/79364592
https://www.cnblogs.com/yincheng/p/logstash.html

 浙公网安备 33010602011771号