无人驾驶(一)道路线检查
说起无人驾驶,那大家肯定都有所了解,下面将会陆续写一些关于无人驾驶的博客,方便自己随时查看,也方便大家学习。
1.首先我们开车时,是安照道路线行驶的,那么在计算机视觉里,怎样去检查道路线呢?接下来,只是做一个简单的例子,方便大家理解其中的原理:

import matplotlib.pyplot as plt
import matplotlib.image as mpimg
import numpy as np

#read image and copy for next use
image = mpimg.imread("./image/test1.jpg")
image_copy = np.copy(image)

#set threadsholds for detection
threshold_r = 200
threshold_g = 200
threshold_b = 200
rgb_thresholds = [threshold_r, threshold_g, threshold_b]


#detection lines in the image
#in this image the lines of the road is white
#so we just set the thresholds
thresholds = (image_copy[:, :, 0] < rgb_thresholds[0]) \
              | (image_copy[:, :, 1] < rgb_thresholds[1]) \
              | (image_copy[:, :, 2] < rgb_thresholds[2])

image_copy[thresholds] = [0, 0, 0]


plt.imshow(image_copy)
plt.show()


在这个例子里面,我们发现线都是白色的,如果你了解RGB图片,你会知道,白色的RGB值是比较大的,所言在这里我们通过一些操作,使得白线留下来,其它部分保持为黑色,结果如下图:
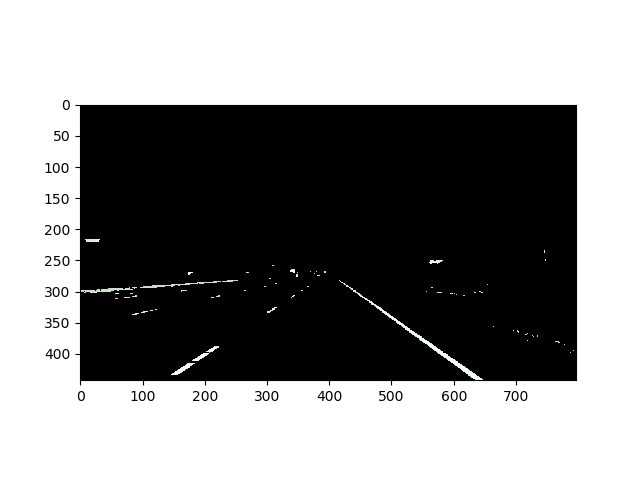
当然,细心的你一定会发现除了道路线还有其它的一些物体也被保留了下来。除此以外道路线不止一种颜色吧,这里只是作为个例子演示,具体的内容后面再提。
实际上,计算机是很笨的,这上面还有其它很多的物体痕迹,所以对于他们来判断如何行驶是特别困难的。那我们就要考虑,是不是要有选择性地保留图中的道路线,而去掉其它物体呢?
2.选择一个区域,包含道路线,不包含道路线以外的物体
import matplotlib.pyplot as plt
import matplotlib.image as mpimg
import numpy as np

# Read in the image and print some stats
image = mpimg.imread('./image/test1.jpg')
print('This image is: ', type(image),
         'with dimensions:', image.shape)

# Pull out the x and y sizes and make a copy of the image
ysize = image.shape[0]
xsize = image.shape[1]
region_select = np.copy(image)

# Define a triangle region of interest
# Keep in mind the origin (x=0, y=0) is in the upper left in image processing
# Note: if you run this code, you'll find these are not sensible values!!
# But you'll get a chance to play with them soon in a quiz
left_bottom = [0, 450]
right_bottom = [700, 450]
apex = [400, 270]

# Fit lines (y=Ax+B) to identify the  3 sided region of interest
# np.polyfit() returns the coefficients [A, B] of the fit
fit_left = np.polyfit((left_bottom[0], apex[0]), (left_bottom[1], apex[1]), 1)
fit_right = np.polyfit((right_bottom[0], apex[0]), (right_bottom[1], apex[1]), 1)
fit_bottom = np.polyfit((left_bottom[0], right_bottom[0]), (left_bottom[1], right_bottom[1]), 1)

# Find the region inside the lines
XX, YY = np.meshgrid(np.arange(0, xsize), np.arange(0, ysize))
region_thresholds = (YY > (XX*fit_left[0] + fit_left[1])) & \
                    (YY > (XX*fit_right[0] + fit_right[1])) & \
                    (YY < (XX*fit_bottom[0] + fit_bottom[1]))

# Color pixels red which are inside the region of interest
region_select[region_thresholds] = [255, 0, 0]

# Display the image
plt.imshow(region_select)
plt.show()


结果:

3.前面两部分共同运用到一起:
import matplotlib.pyplot as plt
import matplotlib.image as mpimg
import numpy as np

# Read in the image and print some stats
image = mpimg.imread('./image/test1.jpg')
print('This image is: ', type(image),
         'with dimensions:', image.shape)

# Pull out the x and y sizes and make a copy of the image
ysize = image.shape[0]
xsize = image.shape[1]
image_copy = np.copy(image)
region_select = np.copy(image)
line_image = np.copy(image)

# Define a triangle region of interest
# Keep in mind the origin (x=0, y=0) is in the upper left in image processing
# Note: if you run this code, you'll find these are not sensible values!!
# But you'll get a chance to play with them soon in a quiz
left_bottom = [0, 450]
right_bottom = [700, 450]
apex = [400, 270]

# Fit lines (y=Ax+B) to identify the  3 sided region of interest
# np.polyfit() returns the coefficients [A, B] of the fit
fit_left = np.polyfit((left_bottom[0], apex[0]), (left_bottom[1], apex[1]), 1)
fit_right = np.polyfit((right_bottom[0], apex[0]), (right_bottom[1], apex[1]), 1)
fit_bottom = np.polyfit((left_bottom[0], right_bottom[0]), (left_bottom[1], right_bottom[1]), 1)

# Find the region inside the lines
XX, YY = np.meshgrid(np.arange(0, xsize), np.arange(0, ysize))
region_thresholds = (YY > (XX*fit_left[0] + fit_left[1])) & \
                    (YY > (XX*fit_right[0] + fit_right[1])) & \
                    (YY < (XX*fit_bottom[0] + fit_bottom[1]))

# Color pixels red which are inside the region of interest
region_select[region_thresholds] = [255, 0, 0]

# Find the road lines in the region
#set threadsholds for detection
threshold_r = 200
threshold_g = 200
threshold_b = 200
rgb_thresholds = [threshold_r, threshold_g, threshold_b]


#detection lines in the image
#in this image the lines of the road is white
#so we just set the thresholds
thresholds = (image_copy[:, :, 0] < rgb_thresholds[0]) \
              | (image_copy[:, :, 1] < rgb_thresholds[1]) \
              | (image_copy[:, :, 2] < rgb_thresholds[2])

image_copy[thresholds] = [0, 0, 0]

#将道路线检测出来并标记为红色
line_image[~thresholds & region_thresholds] = [255, 0, 0]


# Display the image
plt.imshow(line_image)
#plt.imshow(image_copy)
#plt.imshow(region_select)
#plt.imshow(image_copy)
plt.show()


结果:

4.检测不同颜色的道路线
首先道路线有其它颜色,如果按上面的例子来做道路线检测肯定是不行的,于是这里采用Canny算法和高斯平滑算法
cv2.Canny(blur_gray, low_threshold, high_threshold) ,算法首先检查pixel大于high_threshold的像素点作为边缘,忽略其它像素点,然后对于在高阈值与阈值之间的像素点,如果与边缘相连,就保留,其它点都是黑色的,及像素值设为
0。这里要求低阈值与高阈值之间的比为1:3或者1:2
GaussianBlur(gray,(kernel_size, kernel_size), 0),这里的kernel_size是滤波器核的大小,要是奇数,CNN里面就有讲到这个,这里不说了。

下面是实例代码:

#doing all the relevant imports
import matplotlib.pyplot as plt
import matplotlib.image as mpimg
import numpy as np
import cv2

# Read in the image and convert to grayscale
image = mpimg.imread('./image/exit_ramp.jpg')
gray = cv2.cvtColor(image, cv2.COLOR_RGB2GRAY)

# Define a kernel size for Gaussian smoothing / blurring
# Note: this step is optional as cv2.Canny() applies a 5x5 Gaussian internally
kernel_size = 5
blur_gray = cv2.GaussianBlur(gray,(kernel_size, kernel_size), 0)

# Define parameters for Canny and run it
# NOTE: if you try running this code you might want to change these!
low_threshold = 50
high_threshold = 150
edges = cv2.Canny(blur_gray, low_threshold, high_threshold)

# Display the image
plt.imshow(edges, cmap='Greys_r')
plt.show()


 浙公网安备 33010602011771号