
本章介绍SpringBoot监控管理
Actuator 简介
Actuator 是 Spring Boot 提供的对应用系统的自省和监控功能。通过 Actuator,可以使用数据化的指标去度量应用的运行情况,比如查看服务器的磁盘、内存、CPU等信息,系统的线程、gc、运行状态等等。
Actuator 通常通过使用 HTTP 和 JMX 来管理和监控应用,大多数情况使用 HTTP 的方式。
Actuator 端点说明
| 端点 | 描述 |
|---|---|
| auditevents | 获取当前应用暴露的审计事件信息 |
| beans | 获取应用中所有的 Spring Beans 的完整关系列表 |
| caches | 获取公开可以用的缓存 |
| conditions | 获取自动配置条件信息,记录哪些自动配置条件通过和没通过的原因 |
| configprops | 获取所有配置属性,包括默认配置,显示一个所有 @ConfigurationProperties 的整理列版本 |
| env | 获取所有环境变量 |
| flyway | 获取已应用的所有Flyway数据库迁移信息,需要一个或多个 Flyway Bean |
| liquibase | 获取已应用的所有Liquibase数据库迁移。需要一个或多个 Liquibase Bean |
| health | 获取应用程序健康指标(运行状况信息) |
| httptrace | 获取HTTP跟踪信息(默认情况下,最近100个HTTP请求-响应交换)。需要 HttpTraceRepository Bean |
| info | 获取应用程序信息 |
| integrationgraph | 显示 Spring Integration 图。需要依赖 spring-integration-core |
| loggers | 显示和修改应用程序中日志的配置 |
| logfile | 返回日志文件的内容(如果已设置logging.file.name或logging.file.path属性) |
| metrics | 获取系统度量指标信息 |
| mappings | 显示所有@RequestMapping路径的整理列表 |
| scheduledtasks | 显示应用程序中的计划任务 |
| sessions | 允许从Spring Session支持的会话存储中检索和删除用户会话。需要使用Spring Session的基于Servlet的Web应用程序 |
| shutdown | 关闭应用,要求endpoints.shutdown.enabled设置为true,默认为 false |
| threaddump | 获取系统线程转储信息 |
| heapdump | 返回hprof堆转储文件 |
| jolokia | 通过HTTP公开JMX bean(当Jolokia在类路径上时,不适用于WebFlux)。需要依赖 jolokia-core |
| prometheus | 以Prometheus服务器可以抓取的格式公开指标。需要依赖 micrometer-registry-prometheus |
Actuator 使用及配置
1、新建一个SpringBoot Web项,引入spring-boot-starter-actuator依赖
1 <dependency>
2     <groupId>org.springframework.boot</groupId>
3     <artifactId>spring-boot-starter-actuator</artifactId>
4     <optional>true</optional>
5 </dependency>
完整pom如下:


 1 <?xml version="1.0" encoding="UTF-8"?>
 2 <project xmlns="http://maven.apache.org/POM/4.0.0"
 3          xmlns:xsi="http://www.w3.org/2001/XMLSchema-instance"
 4          xsi:schemaLocation="http://maven.apache.org/POM/4.0.0 http://maven.apache.org/xsd/maven-4.0.0.xsd">
 5     <modelVersion>4.0.0</modelVersion>
 6
 7     <groupId>com.test</groupId>
 8     <artifactId>test-springboot-actuator</artifactId>
 9     <version>1.0-SNAPSHOT</version>
10
11
12     <parent>
13         <groupId>org.springframework.boot</groupId>
14         <artifactId>spring-boot-starter-parent</artifactId>
15         <version>2.1.8.RELEASE</version>
16     </parent>
17
18     <properties>
19         <project.build.sourceEncoding>UTF-8</project.build.sourceEncoding>
20         <project.reporting.outputEncoding>UTF-8</project.reporting.outputEncoding>
21         <java.version>1.8</java.version>
22     </properties>
23
24     <dependencies>
25         <dependency>
26             <groupId>org.springframework.boot</groupId>
27             <artifactId>spring-boot-starter-web</artifactId>
28         </dependency>
29
30         <dependency>
31             <groupId>org.springframework.boot</groupId>
32             <artifactId>spring-boot-starter-actuator</artifactId>
33             <optional>true</optional>
34         </dependency>
35
36
37         <dependency>
38             <groupId>org.springframework.boot</groupId>
39             <artifactId>spring-boot-starter-test</artifactId>
40             <scope>test</scope>
41         </dependency>
42
43     </dependencies>
44
45
46     <!-- SpringBoot打包插件,可以将代码打包成一个可执行的jar包 -->
47     <build>
48         <plugins>
49             <plugin>
50                 <groupId>org.springframework.boot</groupId>
51                 <artifactId>spring-boot-maven-plugin</artifactId>
52             </plugin>
53         </plugins>
54     </build>
55 </project>
2、启动项目,访问地址 http://localhost:8080/actuator,获取内容如下:
{
    "_links": {
        "self": {
            "href": "http://localhost:8080/actuator",
            "templated": false
        },
        "health": {
            "href": "http://localhost:8080/actuator/health",
            "templated": false
        },
        "health-component": {
            "href": "http://localhost:8080/actuator/health/{component}",
            "templated": true
        },
        "health-component-instance": {
            "href": "http://localhost:8080/actuator/health/{component}/{instance}",
            "templated": true
        },
        "info": {
            "href": "http://localhost:8080/actuator/info",
            "templated": false
        }
    }
}
可以看到,只有health和info是因为actuator默认只暴露了health和info端点
2、编辑application.properties配置文件,打开其他端点,以及配置管理端点的访问路径
1 # 默认端点可用
2 management.endpoints.enabled-by-default=true
3 # 通过HTTP公开所有的端点
4 management.endpoints.web.exposure.include=*
5 # 自定义管理端点路径 默认是:/actuator
6 management.endpoints.web.base-path=/actuator
常用端点详解
1、health
默认情况下 health 端点是开放的,访问 http://127.0.0.1:8080/actuator/health 即可看到应用运行状态。
{"status":"UP"}
如果需要看到详细信息,则需要做添加配置:
management.endpoint.health.show-details=always
显示内容如下:
{"status":"UP","details":{"diskSpace":{"status":"UP","details":{"total":250790436864,"free":150934597632,"threshold":10485760}}}}
2、info
查看应用信息是否在 application.properties 中配置。如我们在项目中配置是:
info.app.name=Spring Boot Actuator Demo
info.app.version=v1.0.0
info.app.description=Spring Boot Actuator Demo
访问 http://127.0.0.1:8080/actuator/info 返回信息如下:
{"app":{"name":"Spring Boot Actuator Demo","version":"v1.0.0","description":"Spring Boot Actuator Demo"}}
3、env
通过 env 可以获取到所有关于当前 Spring Boot 应用程序的运行环境信息,如:操作系统信息(systemProperties)、环境变量信息、JDK 版本及 ClassPath 信息、当前启用的配置文件(activeProfiles)、propertySources、应用程序配置信息(applicationConfig)等。
可以通过 http://127.0.0.1:8080/actuator/env/{name} ,name表示想要查看的信息,可以独立显示。
4、beans
访问 http://127.0.0.1:8080/actuator/beans 返回部分信息如下:
{
    "contexts": {
        "application": {
            "beans": {
                "endpointCachingOperationInvokerAdvisor": {
                    "aliases": [],
                    "scope": "singleton",
                    "type": "org.springframework.boot.actuate.endpoint.invoker.cache.CachingOperationInvokerAdvisor",
                    "resource": "class path resource [org/springframework/boot/actuate/autoconfigure/endpoint/EndpointAutoConfiguration.class]",
                    "dependencies": [
                        "environment"
                    ]
                },
                "defaultServletHandlerMapping": {
                    "aliases": [],
                    "scope": "singleton",
                    "type": "org.springframework.web.servlet.HandlerMapping",
                    "resource": "class path resource [org/springframework/boot/autoconfigure/web/servlet/WebMvcAutoConfiguration$EnableWebMvcConfiguration.class]",
                    "dependencies": []
                },
                ...
            },
            "parentId": null
        }
    }
}
5、conditions
通过 conditions 可以在应用运行时查看代码了某个配置在什么条件下生效,或者某个自动配置为什么没有生效。
{
    "contexts": {
        "application": {
            "positiveMatches": {...},
            "negativeMatches": {...},
            "unconditionalClasses": [...]
        }
    }
}
6、loggers
获取系统的日志信息。
访问 http://127.0.0.1:8080/actuator/loggers 返回部分信息如下:
{
    "levels": [
        "OFF",
        "ERROR",
        "WARN",
        "INFO",
        "DEBUG",
        "TRACE"
    ],
    "loggers": {
        "ROOT": {
            "configuredLevel": "INFO",
            "effectiveLevel": "INFO"
        },
        "com": {
            "configuredLevel": null,
            "effectiveLevel": "INFO"
        },
        ...
    }
}
7、mappings
查看所有 URL 映射,即所有 @RequestMapping 路径的整理列表。
访问 http://127.0.0.1:8080/actuator/mappings 返回部分信息如下:
8、heapdump
访问:http://127.0.0.1:8080/actuator/heapdump会自动生成一个 GZip 压缩的 Jvm 的堆文件 heapdump,我们可以使用 JDK 自带的 Jvm 监控工具 VisualVM 打开此文件查看。
9、threaddump
获取系统线程的转储信息,主要展示了线程名、线程ID、线程的状态、是否等待锁资源等信息。在工作中,我们可以通过查看线程的情况来排查相关问题。
访问 http://127.0.0.1:8080/actuator/threaddump
10、metrics
访问 http://127.0.0.1:8080/actuator/metrics 可以获取系统度量指标信息项如下:
{
    "names": [
        "jvm.memory.max",
        "jvm.threads.states",
        "jvm.gc.pause",
        "http.server.requests",
        "process.files.max",
        "jvm.gc.memory.promoted",
        "system.load.average.1m",
        "jvm.memory.used",
        "jvm.gc.max.data.size",
        "jvm.memory.committed",
        "system.cpu.count",
        "logback.events",
        "tomcat.global.sent",
        "jvm.buffer.memory.used",
        "tomcat.sessions.created",
        "jvm.threads.daemon",
        "system.cpu.usage",
        "jvm.gc.memory.allocated",
        "tomcat.global.request.max",
        "tomcat.global.request",
        "tomcat.sessions.expired",
        "jvm.threads.live",
        "jvm.threads.peak",
        "tomcat.global.received",
        "process.uptime",
        "tomcat.sessions.rejected",
        "process.cpu.usage",
        "tomcat.threads.config.max",
        "jvm.classes.loaded",
        "jvm.classes.unloaded",
        "tomcat.global.error",
        "tomcat.sessions.active.current",
        "tomcat.sessions.alive.max",
        "jvm.gc.live.data.size",
        "tomcat.threads.current",
        "process.files.open",
        "jvm.buffer.count",
        "jvm.buffer.total.capacity",
        "tomcat.sessions.active.max",
        "tomcat.threads.busy",
        "process.start.time"
    ]
}
11、shutdown
开启可以接口关闭 Spring Boot 应用,要使用这个功能需要做如下配置:
1 # 开启应用关闭端口
2 management.endpoint.shutdown.enabled=true
3 # 暴露shutdown的web端口
4 management.endpoints.web.exposure.include=shutdown
可以通过 post(仅支持 post) 请求访问 http://127.0.0.1:8080/actuator/shutdown 关闭应用。

自定义HealthIndicator
1、自定义组件,实现HealthIndicator接口,并注入容器中,代码如下:
 1 // 注入Spring容器中
 2 @Component
 3 public class MyAppHealthIndicator implements HealthIndicator {
 4     @Override
 5     public Health health() {
 6         // 自定义的检查方法
 7         Health build = Health.up().build();
 8         return build;
 9     }
10 }
2、启动项目,访问 http://localhost:8080/actuator/health,效果如下:

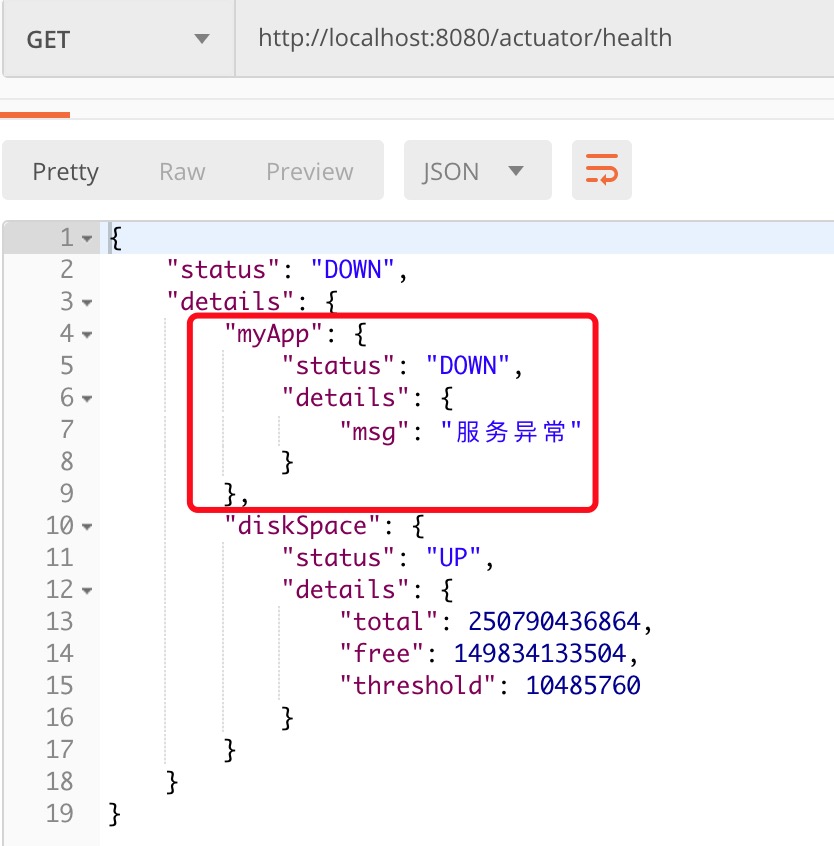
3、修改组件代码,如下:
 1 // 注入Spring容器中
 2 @Component
 3 public class MyAppHealthIndicator implements HealthIndicator {
 4     @Override
 5     public Health health() {
 6         // 自定义的检查方法
 7         // Health build = Health.up().build();
 8         return Health.down().withDetail("msg", "服务异常").build();
 9     }
10 }
4、重启项目,效果如下:


 浙公网安备 33010602011771号