Self-Driving Car 02
1. Setting up the problem
Your job is to teach the car how to perceive the world around it. When we drive, we use our eyes to figure out how fast to go and where the lane lines are and where to turn. However, a car doesnot have eyes. We can use cameras and other sensors to achieve a similar function. And we need to teach the car how to do. The first project is to identify and track the position of the lane lines in a series of images.
2. Identifying Lane Lines by Color

The lane lines are white, so how do we select the white pixels in an image.
What color actually means in the case of digital images. In this case, it means that our image is actually made up of a stack of three images, red, green and blue (RGB). These images are sometimes called color channels. Each of these color channels contains pixels whose values range from zero to 255, where zero was the darkest possible value and 255 is the brightest possible value.
PURE WHITE=[255,255,255]
3. Region select
Mainly, the region where the lane lines are.
4. Computer vision
When we talk to the computer vision, we use the algorithms to let a computer see the world like we see it. Full of depth, and color and shapes and meaning.
5. Canny Edge Detection
The goal is to identify the boundaries of an object in an image.
A. First, we will convert to grayscale.
B. Next, we compute the gradient(梯度斜率), where the brightness of each pixel corresponds to the strength of the gradient at that point.
We are going to find edges by tracing out the pixels that follow the strongest gradients.
We can more easily detect objects by their shape.
What is about the edge?
edges=cv2.Canny(gray, low_threshold,high_theshold)
The Canny function to an image called gray and the output will be another image called edges.
Low_threshold determine how strong the edges must be to be detected. Just the strength of the gradient.
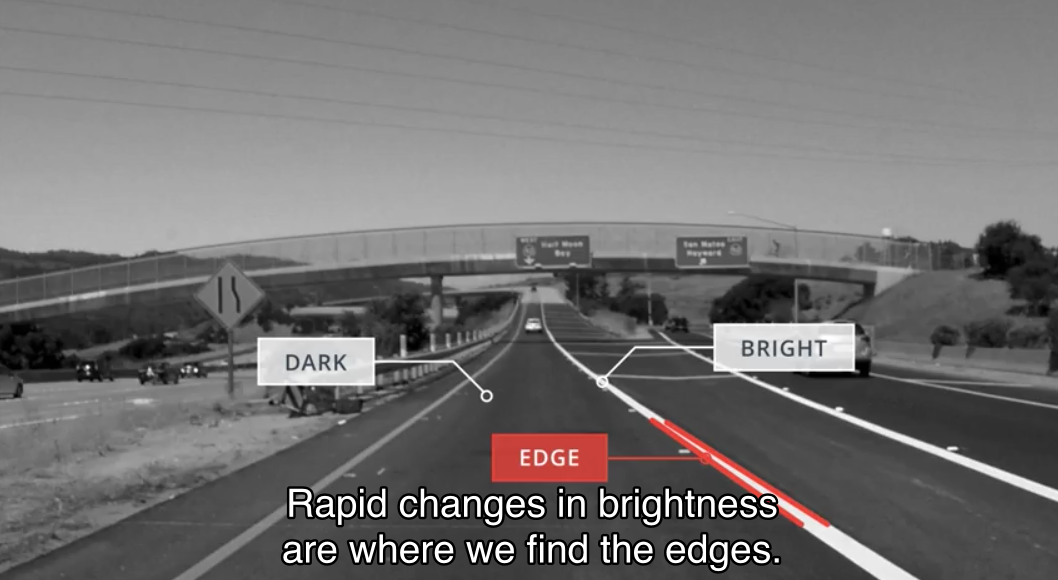
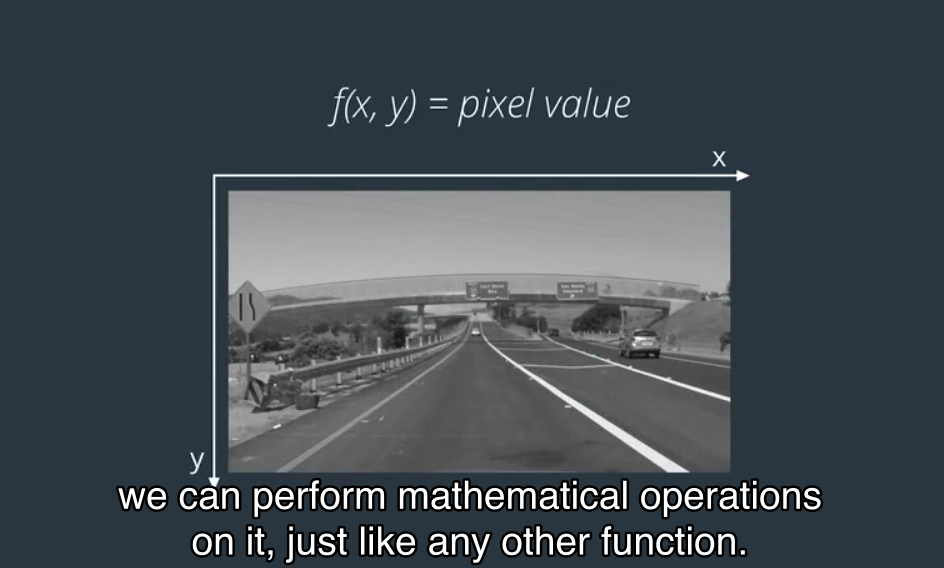
Rapid changes in brightness are where we find the edges. We can perform mathematical operations on it, just like any other function. f(x,y)=pixel value. We can take its derivative.
df/dx =just a measure of change of this function.
A small derivative means small change, and big derivative means big change.
Images are two-dimensional. Computin the gradient gives us thick edges.
7. Hough Introduction
To find lines I need to first adopt a model of a line ane then fit that model to the assortment of dots in my edge detected image.


 浙公网安备 33010602011771号