
windows ELK最新版本 7.14.1环境搭建
最近需要搭建(在Win Server上,即Windows环境)一套ELK环境,感觉网上新版本资料较少,期间也遇到了一些坑,在此记录一下吧
1.下载&安装
首先要先下载各组件,以下有官方对应下载链接
ElasticSearch(核心存储、检索引擎)
https://www.elastic.co/cn/downloads/elasticsearch
logstash(数据处理)
https://www.elastic.co/cn/downloads/logstash
kibana(可视化管理端)
https://www.elastic.co/cn/downloads/kibana
filebeat(发送数据)
https://www.elastic.co/cn/downloads/past-releases/filebeat-7-14-1
下载完后均解压到各自目录即可
2.服务运行
首先是elasticSearch,最新版本下载后需要更改配置文件,下面给出示例及部分配置信息:
# ---------------------------------- Cluster -----------------------------------
#
# Use a descriptive name for your cluster:
# 集群名
cluster.name: ELK-application
#
# ------------------------------------ Node ------------------------------------
#
# Use a descriptive name for the node:
# 节点名
node.name: node-1
#
# Add custom attributes to the node:
#
#node.attr.rack: r1
#
# ----------------------------------- Paths ------------------------------------
#
# 默认情况下,Elasticsearch 会把插件、日志以及你最重要的数据放在安装目录下。这会带来不幸的事故, 如果你重新安装 Elasticsearch 的时候不小心把安装目录覆盖了。如果你不小心,你就可能把你的全部数据删掉了。
#
# 不要笑,这种情况,我们见过很多次了。
#
# 最好的选择就是把你的数据目录配置到安装目录以外的地方, 同样你也可以选择转移你的插件和日志目录。
#
#path.data: /path/to/data
#
# Path to log files:
#
#path.logs: /path/to/logs
#
# ----------------------------------- Memory -----------------------------------
#
# Lock the memory on startup:
#
#bootstrap.memory_lock: true
#
# Make sure that the heap size is set to about half the memory available
# on the system and that the owner of the process is allowed to use this
# limit.
#
# Elasticsearch performs poorly when the system is swapping the memory.
#
# ---------------------------------- Network -----------------------------------
#
# By default Elasticsearch is only accessible on localhost. Set a different
# address here to expose this node on the network:
# 绑定ip 目前只是单击版本,可按如下更改
network.host: 0.0.0.0
#
# By default Elasticsearch listens for HTTP traffic on the first free port it
# finds starting at 9200. Set a specific HTTP port here:
#
http.port: 9200
#
# For more information, consult the network module documentation.
#
# --------------------------------- Discovery ----------------------------------
#
# Pass an initial list of hosts to perform discovery when this node is started:
# The default list of hosts is ["127.0.0.1", "[::1]"]
#
#discovery.seed_hosts: ["host1", "host2"]
discovery.seed_hosts: ["127.0.0.1"]

#
# Bootstrap the cluster using an initial set of master-eligible nodes:
#
#cluster.initial_master_nodes: ["node-1", "node-2"]
# 对应上面节点名
cluster.initial_master_nodes: ["node-1"]
#
# For more information, consult the discovery and cluster formation module documentation.
#
# ---------------------------------- Various -----------------------------------
#
# Require explicit names when deleting indices:
#
#action.destructive_requires_name: true
接下来开始启动服务,进入\bin目录,双击执行elasticsearch.bat批处理程序
访问:localhost:9200,如果有响应json就代表启动成功了
kibana解压后直接进行\bin目录运行kibana.bat即可
访问:localhost:5601,进入管理端代表启动成功
logstash解压后在\bin目录下新建logstash.conf配置文件
input {
##输入数据来自beat 通信端口为5044
  beats {
	port => 5044
  }
##如果不想使用beat 只想简单走下业务流程 可以使用标准输入 注释掉beats块 加上 stdin {} 标准输入模式下启动logstash后 直接在窗口输入数据即可进行测试
}

filter {
	grok {
##        匹配示例(tomcat access日志):192.168.20.187 - - [08/Sep/2021:08:01:26 +0800] "GET /urtpdb/hAdmin/js/jquery.min.js HTTP/1.1" 200 84349
	  match =>{ "message" => "%{IP:request_ip}\ -\ -\ \[%{HTTPDATE:request_datetime}\]\ %{QUOTEDSTRING:request}\ %{NUMBER:response}\ %{NUMBER:sent_bytes}"}
	}
##      取消解析的字段
##	mutate{
##		remove_field => ["host","path","message","@timestamp","@version"]
##}
}

output {
        ##输出到elasticSearch
	elasticsearch { hosts => ["192.168.52.99:9200"]
                                        ## 添加至的索引名字
					index => "project_index_%{+YYYY.MM.dd}"
					document_type =>"project_log"
				  }
        ##输出到当前控制台
	stdout { codec => rubydebug }
}
进入\bin目录下,在资源管理器地址栏输入cmd并回车,以当前路径为基础打开了cmd窗口,输入启动命令:logstash.bat -f logstash.conf
filebeat需要安装在需要推送的机器上,测试的话可安装在本地,更改对应推送ip信息即可
filebeat解压后需要更改配置信息,主要就是数据从哪来,又要到哪去,即输入输出,配置文件是安装目录下的filebeat.yml
filebeat.inputs:

# Each - is an input. Most options can be set at the input level, so
# you can use different inputs for various configurations.
# Below are the input specific configurations.

- type: log

  # Change to true to enable this input configuration.
  enabled: true

  # Paths that should be crawled and fetched. Glob based paths.
  paths:
    ##该目录下的文件内容发生改变时,就会将数据进行推送
    - D:\jenkins_20210819\logs\*.txt
output.logstash:
  # The Logstash hosts
  ##推送到logstash,通信端口5044
  hosts: ["192.168.52.99:5044"]
进入安装目录下打开cmd,输入命令启动服务:filebeat -e -c filebeat.yml,之后可在如上配置的目录下新增文件并添加内容进行测试
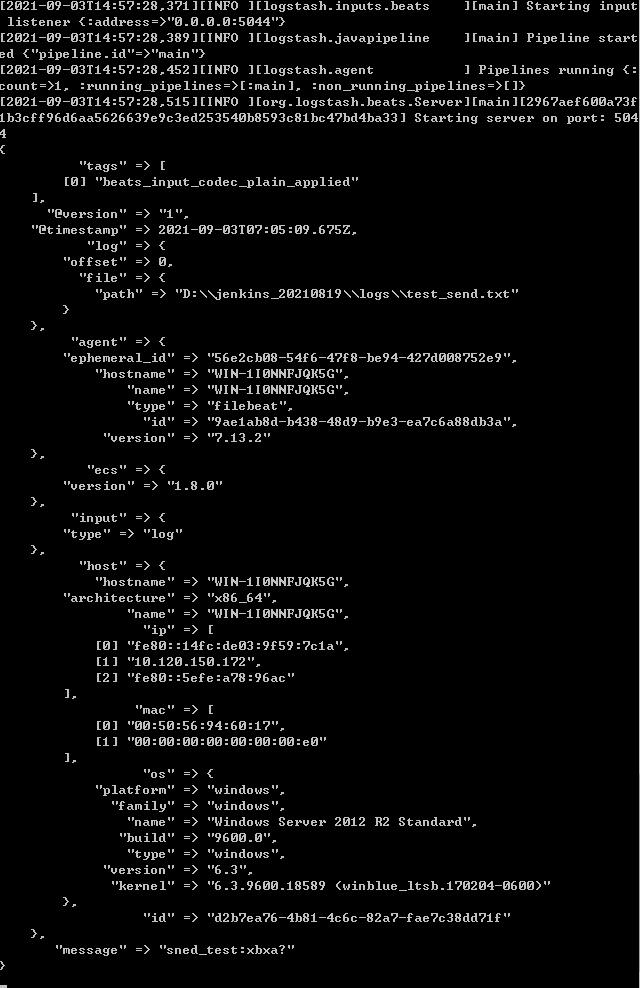
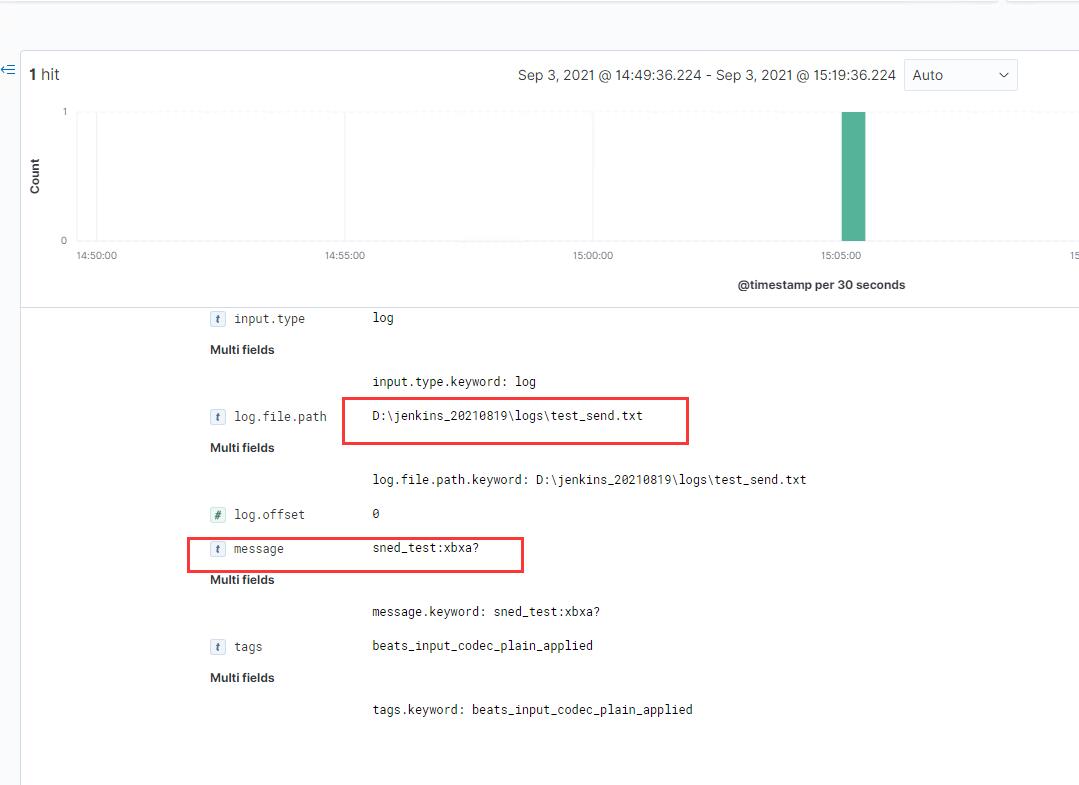
查看logstash出现如下内容代表数据发送成功:
最后可以通过访问kibana查看添加的数据
http://localhost:5601
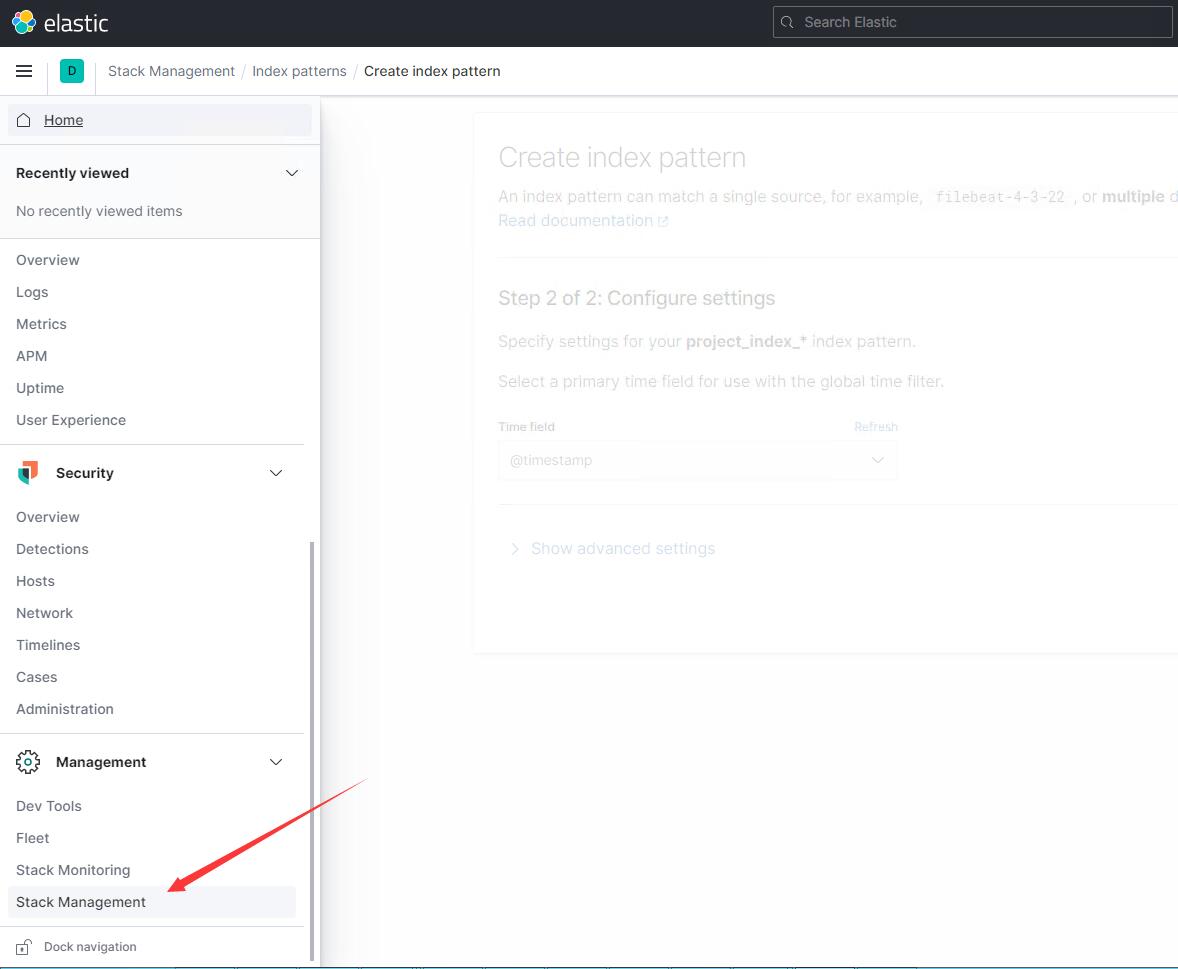
找到如下菜单
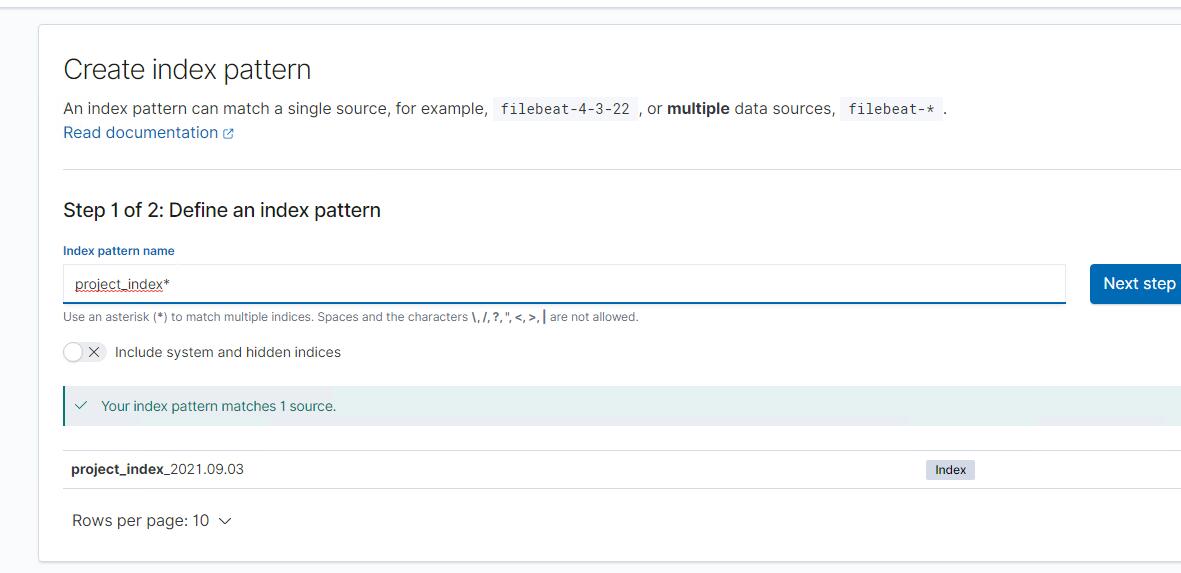
选择创建索引匹配,输入的名字要可以匹配到logstash中配置的输出索引名
点击下一步,时间戳可以选择第一个timestamp,完成创建
之后选中discover菜单
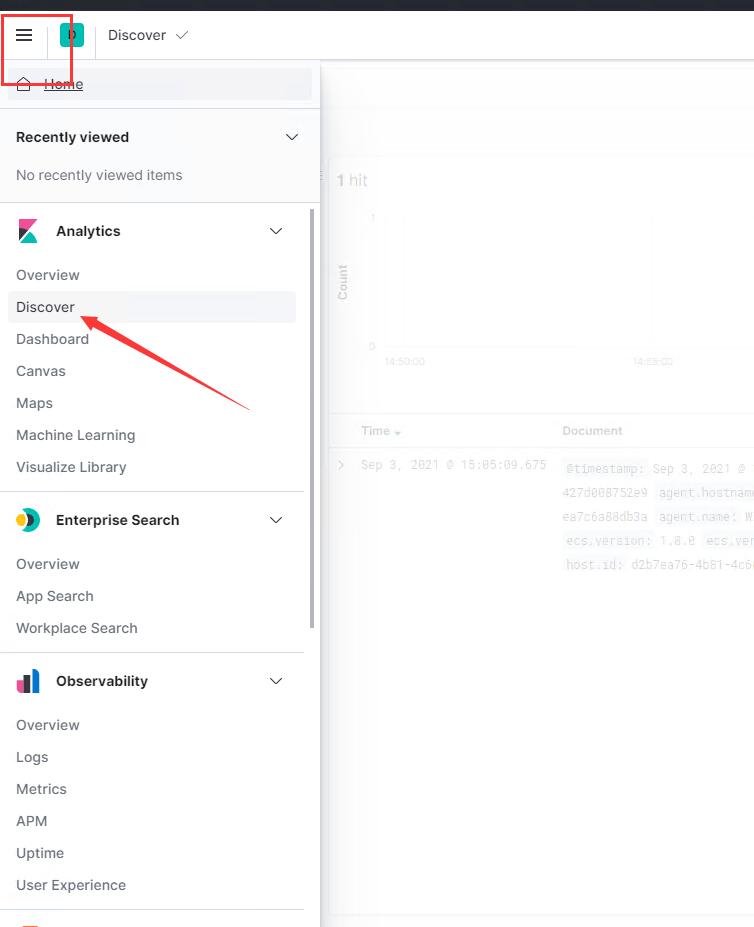
选择刚刚创建的index pattern
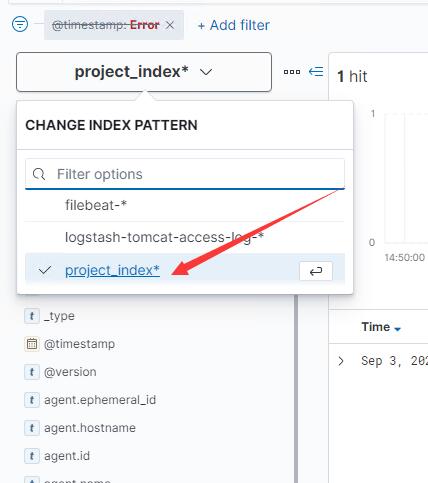
发现已经成功存储到elasticsearch
3.踩过的坑
(后续整理后更新)
关于logstash grok
因为正则表达式书写有误或格式错误导致启动失败,这个还是要靠自己多琢磨手写练一下,可以先在在线网站上解析成功后在放到项目里 https://www.5axxw.com/tools/v2/grok.html
4.后续准备更新的内容
1.加入过滤器(已更新)
只需要在logstash的配置文件中加入
grok {
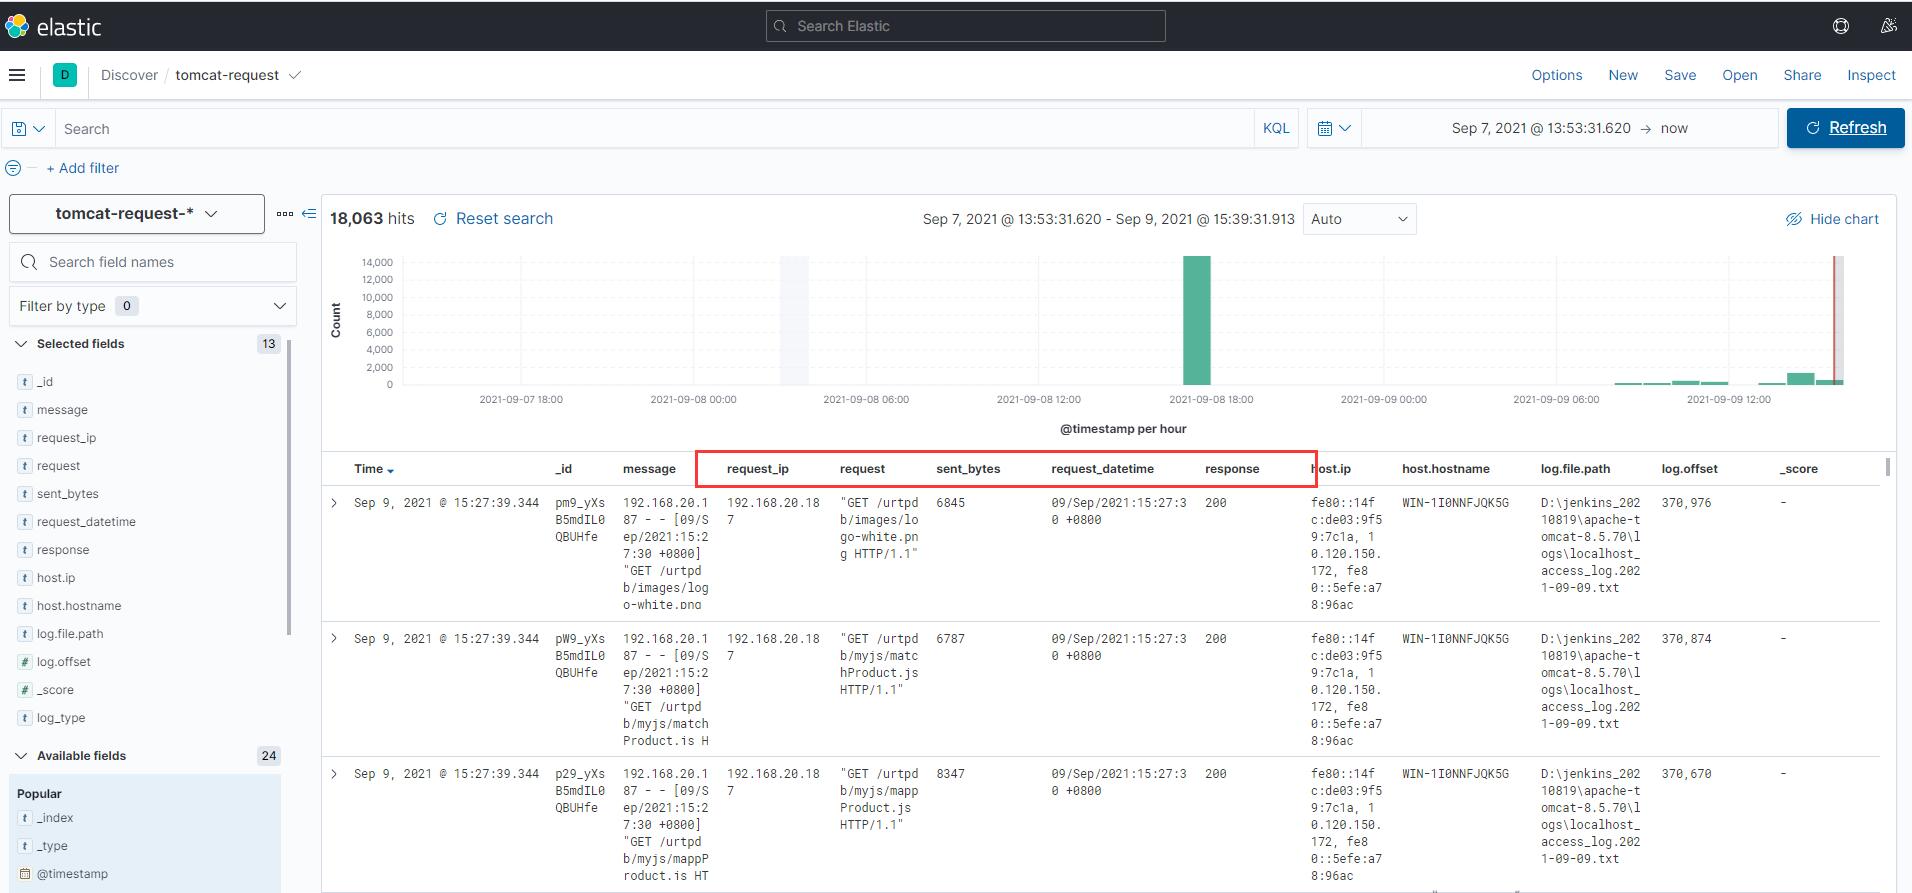
## 匹配示例(tomcat access日志):192.168.20.187 - - [08/Sep/2021:08:01:26 +0800] "GET /urtpdb/hAdmin/js/jquery.min.js HTTP/1.1" 200 84349
match =>{ "message" => "%{IP:request_ip}\ -\ -\ \[%{HTTPDATE:request_datetime}\]\ %{QUOTEDSTRING:request}\ %{NUMBER:response}\ %{NUMBER:sent_bytes}"}
}
部分字段解释:%{IP:request_ip} 以“IP”模式进行解析并写入字段request_ip \ 为转义的空格符 斜杠[(斜杠[无法显示所以使用汉字表示)为转义符号[
匹配模式可参考https://help.aliyun.com/document_detail/129387.html
下面是匹配的效果图:
2.搭建elasticsearch集群
