

highchart和ecahrt折线图性能对比
https://www.cnblogs.com/lsjwq/p/11077281.html
之前看到一篇比较性能的博文,我也稍微试了下,觉得差距没这么大
46055条数据,10条曲线,也就是不到50W个数据点
线条宽度都为1,不显示点形状,以获得较高性能
echart v4.0 highchart v8.0
测试过程不算严谨,仅供参考
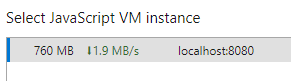
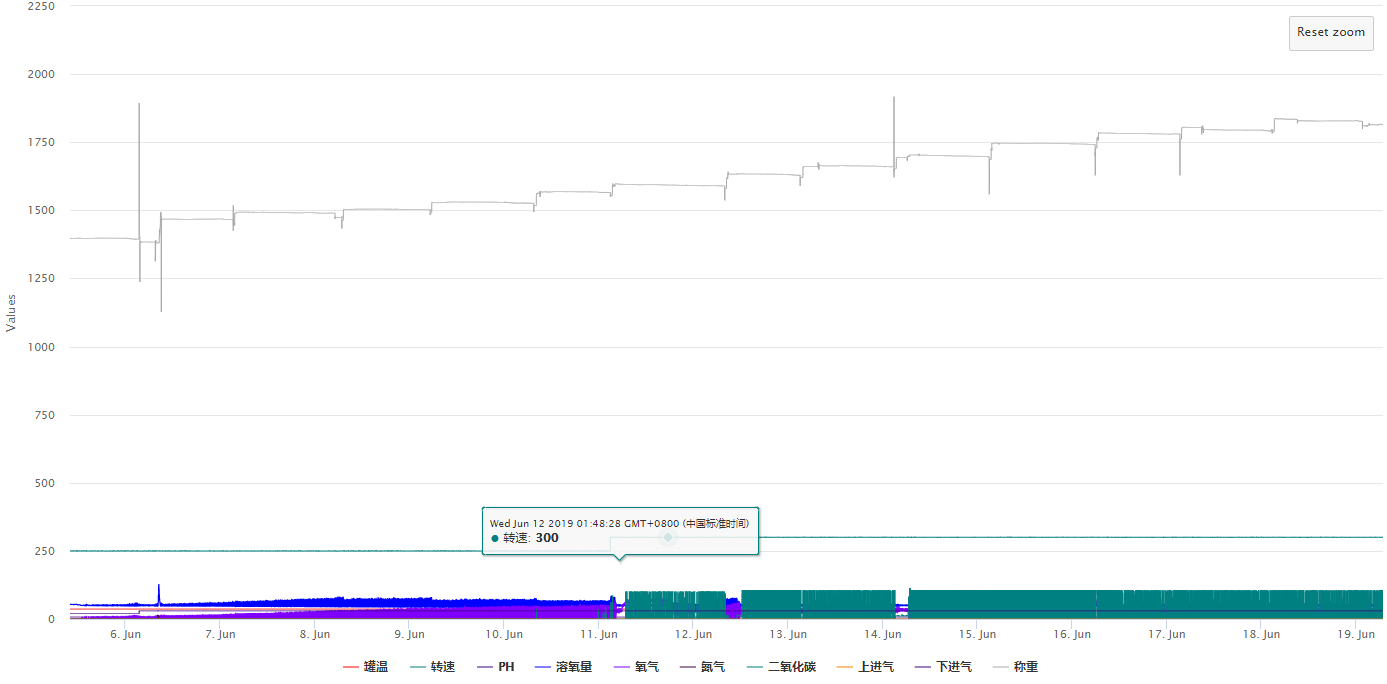
1,echart
页面进程内存占用939M
js vm: 760M


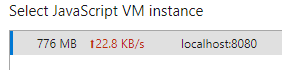
svg渲染 978M :
js vm:776M

在大量数据下,svg不会少占内存,而且在数据量密集时会更卡,几乎无法动态,canvas还能勉强缩放,两秒刷一帧,随着数据放大逐渐流畅
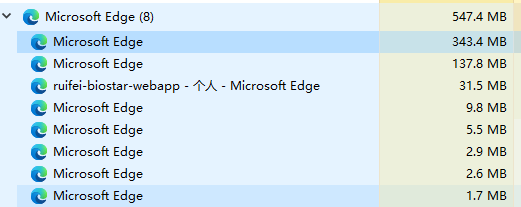
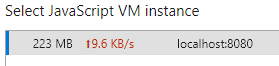
2,highchart
进程占用:343M 低很多
js vm:223M
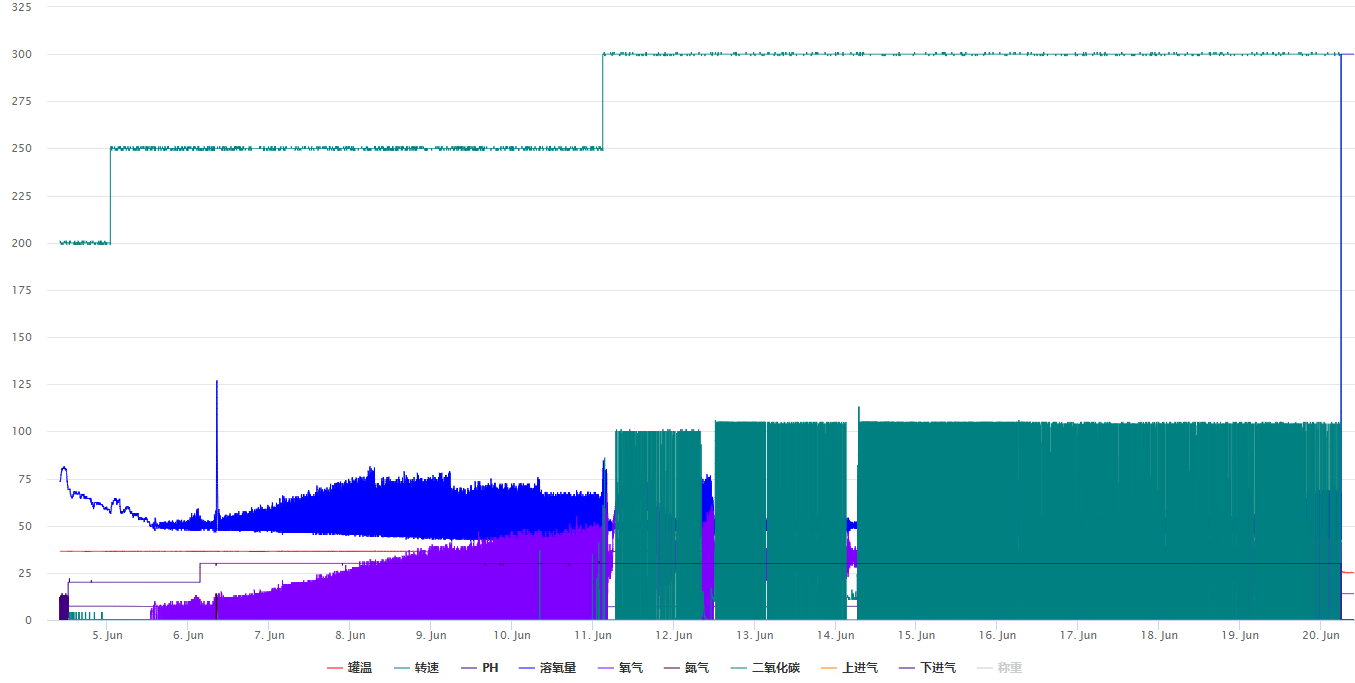
不勾选数字较大的称重后,数据极为夸张
流畅度不高,而且由于放大时没有动画,比较讨巧,也要好几秒才有相应,随着数据放大较为流畅
总体来说,highchart虽然是svg但是比echart的svg好很多,比echart的canvas性能也更好一些,主要是内存占用较小,在流畅度上由于操作和动画机制不同,不能直接对比,但是并没有感觉highchart比echart好很多
浏览器的快捷方式加上这样的参数,可以提升一定的内存, --args --js-flags="--max_old_space_size=4096",不过实际最高也就2g多一点吧,v8引擎的限制,设置的再高也没用,所以echart我还没开成4个过,highchart占用内存小,一个界面要4个chart同步操作的话可能只能用highchart了。
建议在实际使用时增加时间范围选择和数据间隔时间来减少数据量,否则几乎撑不住。
做为对比,wpf下我用的chart控件可以显示4个甚至8个这样的chart同步操作,缩放非常流畅,4个chart内存占用才1G
一些使用方法,我这种类给每个我用的chart都做了,C#的用了3个chart了。


private static ToLower(str: string): string {
        let allsmallList = ['dopv', 'phpv'];
        for (let index = 0; index < allsmallList.length; index++) {
            const s = allsmallList[index];
            if (str.toLowerCase() == s)
                return s;
        }
        //全大写的字母变成全小写,和后台统一改
        // var rt = /^[A-Z]+$/;
        // if (rt.test(str.replace(str[0], str[0].toUpperCase()))) {
        //     return str.toLowerCase();
        // }

        let str2 = str.replace(str[0], str[0].toLowerCase());
        return str2;
    }

    public static AddAllLineSeries(chartOption: any, batchDatas: Array<BatchData>, lineCodes: string[], lineProperties: Array<lineProperty>) {
        lineCodes.forEach(linecode => {
            linecode = echartLineSeriesHelper.ToLower(linecode);
            echartLineSeriesHelper.AddLineSeries(chartOption, batchDatas, linecode, lineProperties);
        });
    }

    public static AddLineSeries(chartOption: any, batchDatas: Array<BatchData>, lineCode: string, lineProperties: Array<lineProperty>) {

        let datas: Array<LineSeriesData>;
        let lineprop = lineProperties.firstOrDefault(lp => lp.lineCode == lineCode);
        if (lineprop) {
            if (lineprop.lineUnit == '%') {
                datas = batchDatas.map(d => new LineSeriesData(lineprop.lineName, d.recordTime, d[lineCode] * 100));
            }
            else {

                datas = batchDatas.map(d => new LineSeriesData(lineprop.lineName, d.recordTime, d[lineCode]));
            }
            echartLineSeriesHelper.AddLineSeriesInner(chartOption, datas, lineprop, 'online');

        }
    }

    public static AppendBatchDataToSeries(chartOption: any, batchData: BatchData, lineProperties: Array<lineProperty>) {
        let series: LineSeries[] = chartOption.series;
        lineProperties.forEach(lineprop => {
            series.forEach(ser => {
                if (ser.name == lineprop.lineName) {
                    let linecode = echartLineSeriesHelper.ToLower(lineprop.lineCode);
                    ser.data.push(new LineSeriesData(ser.name, new Date(batchData.recordTime), batchData[linecode]));
                    if (ser.data.length > 10000) {
                        ser.data.shift();
                    }
                }
            });
        });
    }

    public static AppendBatchDatasToSeries(chartOption: any, batchDatas: BatchData[], lineProperties: Array<lineProperty>) {
        let series: LineSeries[] = chartOption.series;
        lineProperties.forEach(lineprop => {
            series.forEach(ser => {
                if (ser.name == lineprop.lineName) {
                    let linecode = echartLineSeriesHelper.ToLower(lineprop.lineCode);
                    batchDatas.forEach(batchData => {
                        ser.data.push(new LineSeriesData(ser.name, new Date(batchData.recordTime), batchData[linecode]));
                    });
                }
            });
        });
    }

    public static InitBatchDataSeries(chartOption: any, lineProperties: Array<lineProperty>) {
        lineProperties.forEach(lineprop => {
            echartLineSeriesHelper.AddLineSeriesInner(chartOption, [], lineprop, 'online');
        });
    }

    private static AddLineSeriesInner(chartOption: any, datas: LineSeriesData[], lineProperty: lineProperty, dataType: string) {
        let lineSeries: LineSeries = {
            name: '',
            data: [],
            type: 'line',
            roam: true,
            showSymbol: false,
            lineStyle: {
                normal: {
                    color: ''
                },
                width:1
            },
            dataType: 'online'
        };

        lineSeries.name = lineProperty.lineName;
        lineSeries.data = datas;

        let color: string
        if (lineProperty.lineColor.startsWith('#')) {
            color = '#' + lineProperty.lineColor.substr(3, 6);
        }
        else {
            color = lineProperty.lineColor;
        }

        lineSeries.lineStyle.normal.color = color;
        chartOption.color.push(color);
        chartOption.series.push(lineSeries);
    }
private static ToLower(str: string): string {
        let allsmallList = ['dopv', 'phpv'];
        for (let index = 0; index < allsmallList.length; index++) {
            const s = allsmallList[index];
            if (str.toLowerCase() == s)
                return s;
        }
        //全大写的字母变成全小写,和后台统一改
        // var rt = /^[A-Z]+$/;
        // if (rt.test(str.replace(str[0], str[0].toUpperCase()))) {
        //     return str.toLowerCase();
        // }

        let str2 = str.replace(str[0], str[0].toLowerCase());
        return str2;
    }

    public static AddAllLineSeries(chartOption: any, batchDatas: Array<BatchData>, lineCodes: string[], lineProperties: Array<lineProperty>) {
        lineCodes.forEach(linecode => {
            linecode = highchartLineSeriesHelper.ToLower(linecode);
            highchartLineSeriesHelper.AddLineSeries(chartOption, batchDatas, linecode, lineProperties);
        });
    }

    public static AddLineSeries(chartOption: any, batchDatas: Array<BatchData>, lineCode: string, lineProperties: Array<lineProperty>) {

        let datas: Array<HighChartLineSeriesData>;
        let lineprop = lineProperties.firstOrDefault(lp => lp.lineCode == lineCode);
        if (lineprop) {
            if (lineprop.lineUnit == '%') {
                datas = batchDatas.map(d => new HighChartLineSeriesData(lineprop.lineName, d.recordTime, d[lineCode] * 100));
            }
            else {

                datas = batchDatas.map(d => new HighChartLineSeriesData(lineprop.lineName, d.recordTime, d[lineCode]));
            }
            highchartLineSeriesHelper.AddLineSeriesInner(chartOption, datas, lineprop, 'online');

        }
    }

    public static AppendBatchDataToSeries(chartOption: any, batchData: BatchData, lineProperties: Array<lineProperty>) {
        let series: HighChartLineSeries[] = chartOption.series;
        lineProperties.forEach(lineprop => {
            series.forEach(ser => {
                if (ser.name == lineprop.lineName) {
                    let linecode = highchartLineSeriesHelper.ToLower(lineprop.lineCode);
                    ser.data.push(new HighChartLineSeriesData(ser.name, new Date(batchData.recordTime), batchData[linecode]));
                    if (ser.data.length > 10000) {
                        ser.data.shift();
                    }
                }
            });
        });
    }

    public static AppendBatchDatasToSeries(chartOption: any, batchDatas: BatchData[], lineProperties: Array<lineProperty>) {
        let series: HighChartLineSeries[] = chartOption.series;
        lineProperties.forEach(lineprop => {
            series.forEach(ser => {
                if (ser.name == lineprop.lineName) {
                    let linecode = highchartLineSeriesHelper.ToLower(lineprop.lineCode);
                    batchDatas.forEach(batchData => {
                        ser.data.push(new HighChartLineSeriesData(ser.name, new Date(batchData.recordTime), batchData[linecode]));
                    });
                }
            });
        });
    }

    public static InitBatchDataSeries(chartOption: any, lineProperties: Array<lineProperty>) {
        lineProperties.forEach(lineprop => {
            highchartLineSeriesHelper.AddLineSeriesInner(chartOption, [], lineprop, 'online');
        });
    }

    private static AddLineSeriesInner(chartOption: any, datas: HighChartLineSeriesData[], lineProperty: lineProperty, dataType: string) {
        let lineSeries: HighChartLineSeries = {
            name: '',
            data: [],
            type: 'line',
            dataType: 'online',
            lineWidth: 1,
            color:'',
            marker:{enabled:false}
        };

        lineSeries.name = lineProperty.lineName;
        lineSeries.data = datas;

        let color: string
        if (lineProperty.lineColor.startsWith('#')) {
            color = '#' + lineProperty.lineColor.substr(3, 6);
        }
        else {
            color = lineProperty.lineColor;
        }

        lineSeries.color = color;
        //chartOption.color.push(color);
        chartOption.series.push(lineSeries);
    }
{
      title: {
        text: ""
      },
      //renderer:'svg',
      color:[],
      legend: { data: [] },
      tooltip: {
        trigger: "axis",
        formatter: function(params: LineSeriesData[]) {
          let tootip = "";
          params.slice(0, 6).forEach(param => {
            tootip += param.name + " : " + param.value[1] + "<br/>";
          });

          return tootip;
        },
        axisPointer: {
          animation: false
        }
      },
      dataZoom: [
       {
          show: true,
          realtime: true,
          start: 65,
          end: 85
        },
        {
          type: "inside",
          show: true,
          realtime: true,
          start: 65,
          end: 85
        }
      ],
      xAxis: {
        type: "time",
        splitLine: {
          show: true
        }
      },
      yAxis: [
        {
          type: "value",
          splitLine: {
            show: true
          }
        }
      ],
      series: [],
      animation: false
    }
{
      plotOptions: {
        series: {
          turboThreshold: 1000000
        },
        radius: 0
      },
      title: {
        text: ""
      },
      chart: {
        zoomType: "x"
      },
      boost: {
        useGPUTranslations: true
      },
      color: [],
      legend: { data: [] },

      xAxis: {
        type: "datetime"
      },
      yAxis: [
        {
          type: "linear"
        }
      ],
      series: []
    }
最后两个使用参数
PS:echart使用了echart-vue,不过不用vue组件直接用echart内存也差不多,highchart的vue组件使用失败,只能用div id初始化
不要尝试用vue router路由去切换这种数据量的chart了,虽然组件会保持数据,但是把DOM重新绘制出来还是很慢的,我多个tab时都是用v-show切换的
再PS: 这也就是我不依赖electron做桌面端的原因之一,web端性能限制和内存限制,然后第三方c++组件也不方便调用
补充,我发现lightningjs用webgl绘制的,性能好很多

 浙公网安备 33010602011771号