

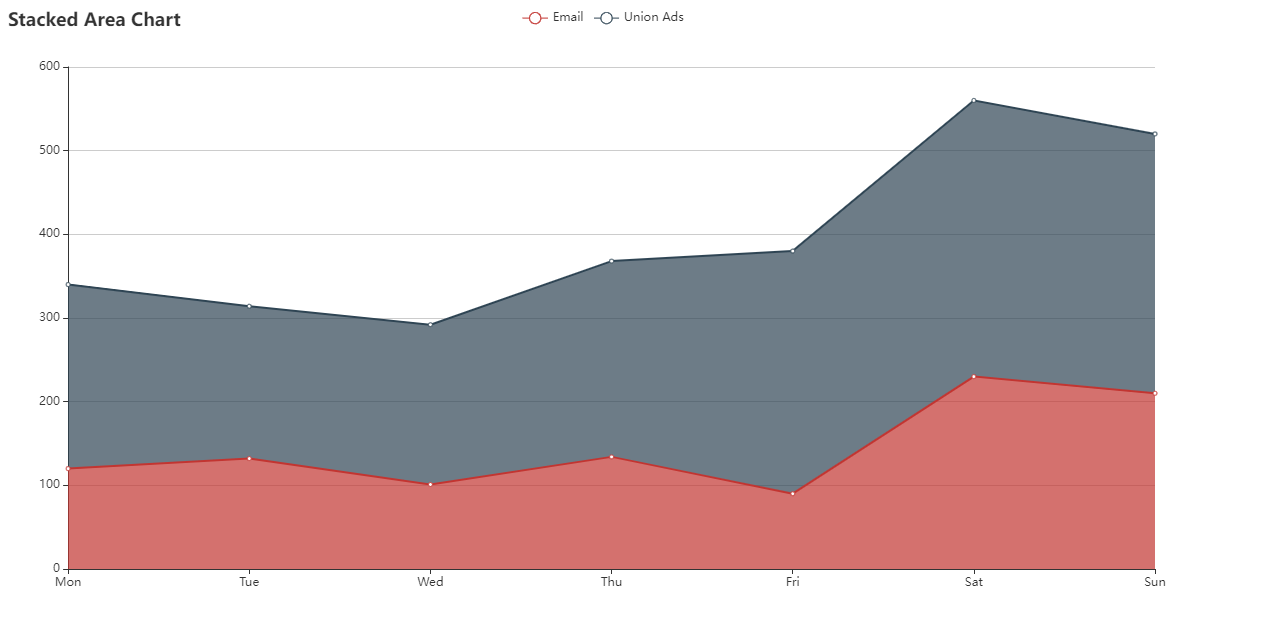
前端 echar 堆叠面积图
实际使用是删掉 这句
stack: 'Total',
从官网搞过来的demo,一开始还没注意
<!DOCTYPE html>
<html>
<head>
    <meta charset="utf-8" />
    <title></title>
</head>
<body>

    <script type="text/javascript" src="https://cdn.jsdelivr.net/npm/echarts@4.8.0/dist/echarts.min.js"></script>

    <div id="main" style="width: 1200px; height: 600px; margin-bottom: 500px;"></div>


    <script type="text/javascript">
        var myChart = echarts.init(document.getElementById('main'));


        option = {
                        //toolbox: {
            //    feature: {
            //        saveAsImage: {}
            //    }
            //},
            title: {
                text: 'Stacked Area Chart'
            },
            tooltip: {
                trigger: 'axis',
                axisPointer: {
                    type: 'cross',
                    label: {
                        backgroundColor: '#6a7985'
                    }
                }
            },
            legend: {
                data: ['Email', 'Union Ads']
            },
            grid: {
                left: '3%',
                right: '4%',
                bottom: '3%',
                containLabel: true
            },
            xAxis: [
                {
                    type: 'category',
                    boundaryGap: false,
                    data: ['Mon', 'Tue', 'Wed', 'Thu', 'Fri', 'Sat', 'Sun']
                }
            ],
            yAxis: [
                {
                    type: 'value'
                }
            ],
            series: [
                {
                    name: 'Email',
                    type: 'line',
                    stack: 'Total',
                    areaStyle: {},
                    emphasis: {
                        focus: 'series'
                    },
                    data: [120, 132, 101, 134, 90, 230, 210]
                },
                {
                    name: 'Union Ads',
                    type: 'line',
                    stack: 'Total',
                    areaStyle: {},
                    emphasis: {
                        focus: 'series'
                    },
                    data: [220, 182, 191, 234, 290, 330, 310]
                },
            ]
        };


        myChart.setOption(option);

    </script>

</body>
</html>

 浙公网安备 33010602011771号