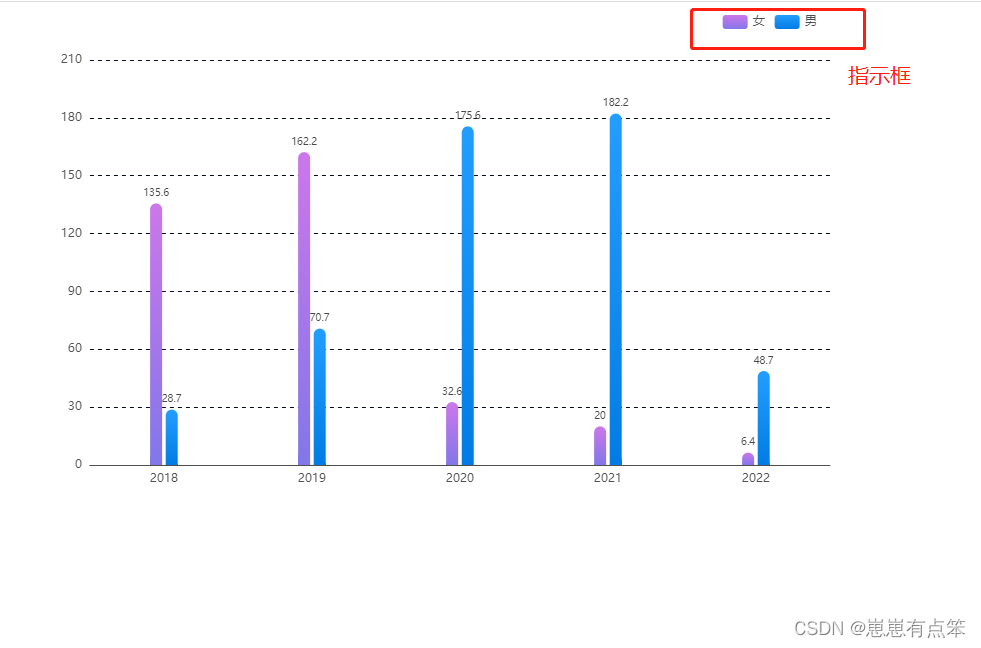
echarts柱状图 双柱状图基本用法
<script>
echarts_1()
function echarts_1() {
var myChart = echarts.init(document.getElementById('echart'));
option = {
calculable: true,
legend: {
// 指示框名字 注意!要和下方series中的name一起改
data: ['女', '男'],
// 指示框位置 距离上下左右多少
right: '5%',
// top: '50%',
textStyle: {
color: '#4F4F4F' //字体颜色
}
},
title: {
text: '对象编号',
textStyle: {
color: '#5DC3FF',
fontSize: 14,
fontWeight: 'normal'
},
left: 10,
top: 39
},
tooltip: {
trigger: 'axis',
textStyle: {
fontSize: 14 // 文字字体大小
},
axisPointer: {
type: 'shadow',
shadowStyle: {
color: 'rgba(25, 114, 162, 0.4)',
width: 1,
lineStyle: {
type: 'solid'
}
}
}
},
xAxis: [
{
type: 'category',
data: ['2018', '2019', '2020', '2021', '2022'],
axisLine: { //x轴线的颜色以及宽度
show: true, //是否显示X轴
lineStyle: {
color: "#4F4F4F",
}
},
axisLabel: {
// interval: 0, //间隔几条显示
// rotate: 20, // 切斜度数
// fontSize: 10, //字体大小
},
axisTick: {
//是否显示刻度线
show: false
},
}
],
yAxis: [
{
type: 'value',
inverse: true, //倒叙
axisTick: {
//y轴刻度线
show: false
},
axisLine: {
show: false, // Y轴
lineStyle: {
color: "#4F4F4F",
}
},
splitLine: { // 表格里面Y轴线条
show: true,
lineStyle: {
type: 'dashed', //虚线
color: '#04072F' //虚线颜色
}
}
}
],
// 整体大小
grid: {
left: '3%',
right: '4%',
top: '10%',
bottom: '5%',
containLabel: true
},
series: [
{
barWidth: 12,//柱子宽度
name: '女',
type: 'bar',
data: [
135.6, 162.2, 32.6, 20.0, 6.4
],
itemStyle: {
//颜色样式部分
normal: {
barBorderRadius: [20, 20, 0, 0], //圆角[上左,上右,下右,下左]
label: {
show: true, //开启数字显示
position: 'top', //在上方显示数字
textStyle: { //数值样式
color: '#474646', //字体颜色
fontSize: 10 //字体大小
}
},
// 柱状图颜色渐变
color: new echarts.graphic.LinearGradient(0, 1, 0, 0, [
{ offset: 0, color: "#8277E9" },
{ offset: 1, color: "#CC77E9" },
]),
}
}
},
{
barWidth: 12,//柱子宽度
name: '男',
type: 'bar',
data: [
28.7, 70.7, 175.6, 182.2, 48.7
],
itemStyle: {
//颜色样式部分
normal: {
barBorderRadius: [20, 20, 0, 0], //圆角[上左,上右,下右,下左]
label: {
show: true, //开启数字显示
position: 'top', //在上方显示数字
textStyle: { //数值样式
color: '#474646', //字体颜色
fontSize: 10 //字体大小
}
},
// 柱状图颜色渐变
color: new echarts.graphic.LinearGradient(0, 1, 0, 0, [
{ offset: 0, color: "#017CE4" },
{ offset: 1, color: "#249EFD" },
]),
}
}
}
]
};
//自定义滚动条
if (data > 7) {
let endDataZoom = Math.ceil((7 * 100) / data.personNum.length);
option.dataZoom = [
{
type: 'inside',
startValue: 0,
endValue: 2,
minValueSpan: 2,
maxValueSpan: 2,
yAxisIndex: [0],
witdth: 8,
bottom: 10,
handleStyle: {
color: '#074e90',
borderColor: '#074e90'
},
showDataShadow: false,
handleIcon:
'path://M30.9,53.2C16.8,53.2,5.3,41.7,5.3,27.6S16.8,2,30.9,2C45,2,56.4,13.5,56.4,27.6S45,53.2,30.9,53.2z M30.9,3.5M36.9,35.8h-1.3z M27.8,35.8 h-1.3H27L27.8,35.8L27.8,35.8z',
handleSize: '80%',
fillerColor: '#074e90',
backgroundColor: 'transparent',
borderColor: 'transparent',
start: 0, //数据窗口范围的起始百分比,表示1%
end: endDataZoom, //数据窗口范围的结束百分比,表示35%坐标
zoomOnMouseWheel: false, // 关闭滚轮缩放
moveOnMouseWheel: true, // 开启滚轮平移
moveOnMouseMove: true // 鼠标移动能触发数据窗口平移
},
{
type: 'slider',
realtime: true,
startValue: 0,
endValue: 2,
width: 8,
bottom: 10,
yAxisIndex: [0], // 控制y轴滚动
showDetail: false, // 拖拽时是否展示滚动条两侧的文字
top: '1%',
right: '5',
handleStyle: {
color: '#074e90',
borderColor: '#074e90'
},
showDataShadow: false,
handleIcon:
'path://M30.9,53.2C16.8,53.2,5.3,41.7,5.3,27.6S16.8,2,30.9,2C45,2,56.4,13.5,56.4,27.6S45,53.2,30.9,53.2z M30.9,3.5M36.9,35.8h-1.3z M27.8,35.8 h-1.3H27L27.8,35.8L27.8,35.8z',
handleSize: '80%',
fillerColor: '#074e90',
backgroundColor: 'transparent',
borderColor: 'transparent'
}
];
} else {
option.dataZoom = [];
}
// 使用刚指定的配置项和数据显示图表。
myChart.setOption(option);
myChart.off('click');
myChart.on('click', param => {
console.log(param)
});
window.addEventListener("resize", function () {
myChart.resize();
})
}
</script>
这里有注意的详细看法

最终内容
* //柱状图横向时与XAxis,yAxis中type 互换位置

 浙公网安备 33010602011771号