
20242322《Python程序设计》综合实践报告(实验四)
2024-2025-2 20242217《Python程序设计》综合实践报告(实验四)
课程:《Python程序设计》
班级:2423
姓名:郭智汶
学号:20242322
实验教师:王志强老师
实验日期:2025年6月9日
必修/选修:公选课
一、选题
我经常会在网上浏览电影相关的资讯,尤其是对豆瓣电影非常感兴趣。每次查看这些电影信息时,我都会发现其中蕴含着丰富的数据,比如电影的评分、评论数量、导演、演员等,这些数据背后可能隐藏着许多有趣的现象和趋势。然而,这些数据分散在网页中,提取起来比较麻烦,需要逐个手动记录,效率很低。于是,我萌生了通过编程的方式自动爬取这些数据的想法。
在学习Python的过程中,我了解到Python有强大的网络爬虫库,能够帮助我实现数据的自动化抓取。于是,我开始尝试编写代码来爬取豆瓣电影TOP250的相关数据。在爬取数据的过程中,我发现单纯地获取数据还不够,如果能将这些数据进行可视化分析,就能更直观地展示电影的评分分布、受欢迎程度等信息。因此,我又进一步学习了Python的数据可视化库,比如Matplotlib和Seaborn,尝试将爬取到的数据通过图表的形式展示出来。
在实现这个项目的过程中,我遇到了不少困难。比如,豆瓣网站有一定的反爬虫机制,这使得爬取数据时需要考虑如何合理设置请求头、延时等参数,以避免被封禁IP。另外,在数据可视化方面,如何选择合适的图表类型来清晰地呈现数据也是一个挑战。不过,通过查阅大量的在线教程和文档,我逐渐克服了这些难题。同时,在AI的帮助下,我还对代码进行了优化,使其更加高效和稳定。虽然过程中出现了一些bug和小插曲,让我感到有些挫败,但最终我成功实现了这个项目。虽然我的编程能力还有待提高,但通过这个项目,我不仅学到了很多关于网络爬虫和数据可视化的知识,还锻炼了自己的问题解决能力。
二、实验目的
1.实现豆瓣电影TOP250数据的爬取:通过编写Python爬虫代码,从豆瓣电影网站爬取TOP250电影的相关信息,包括电影名称、评分、导演、演员、评价人数、简介等。
2.实现数据的清洗与预处理:对爬取到的原始数据进行清洗,提取有用信息,如从电影信息中分离出导演和演员,从标题中提取年份和国家/地区等,并将清洗后的数据保存为CSV文件。
3.实现数据的可视化分析:利用Python的数据可视化库,对清洗后的数据进行分析,绘制评分分布直方图、不同国家/地区电影数量对比图、评分与评价人数的关系图、各年代电影数量统计图以及高评分电影简介的词云图,以直观展示电影数据的特征和趋势。
4.实现数据的存储与导出:将爬取到的电影数据存储为CSV文件,方便后续的查看和分析。
三、实验环境
Python 3.8+
主要库:requests, BeautifulSoup, pandas, matplotlib, seaborn
开发工具:Jupyter Notebook/VSCode
四、实验原理
网络爬虫原理:通过HTTP请求获取网页内容,使用HTML解析库提取所需数据
数据可视化原理:使用绘图库将结构化数据转化为直观图表
豆瓣电影TOP250页面结构:采用分页展示,每一页包含25部电影信息
五、实验流程
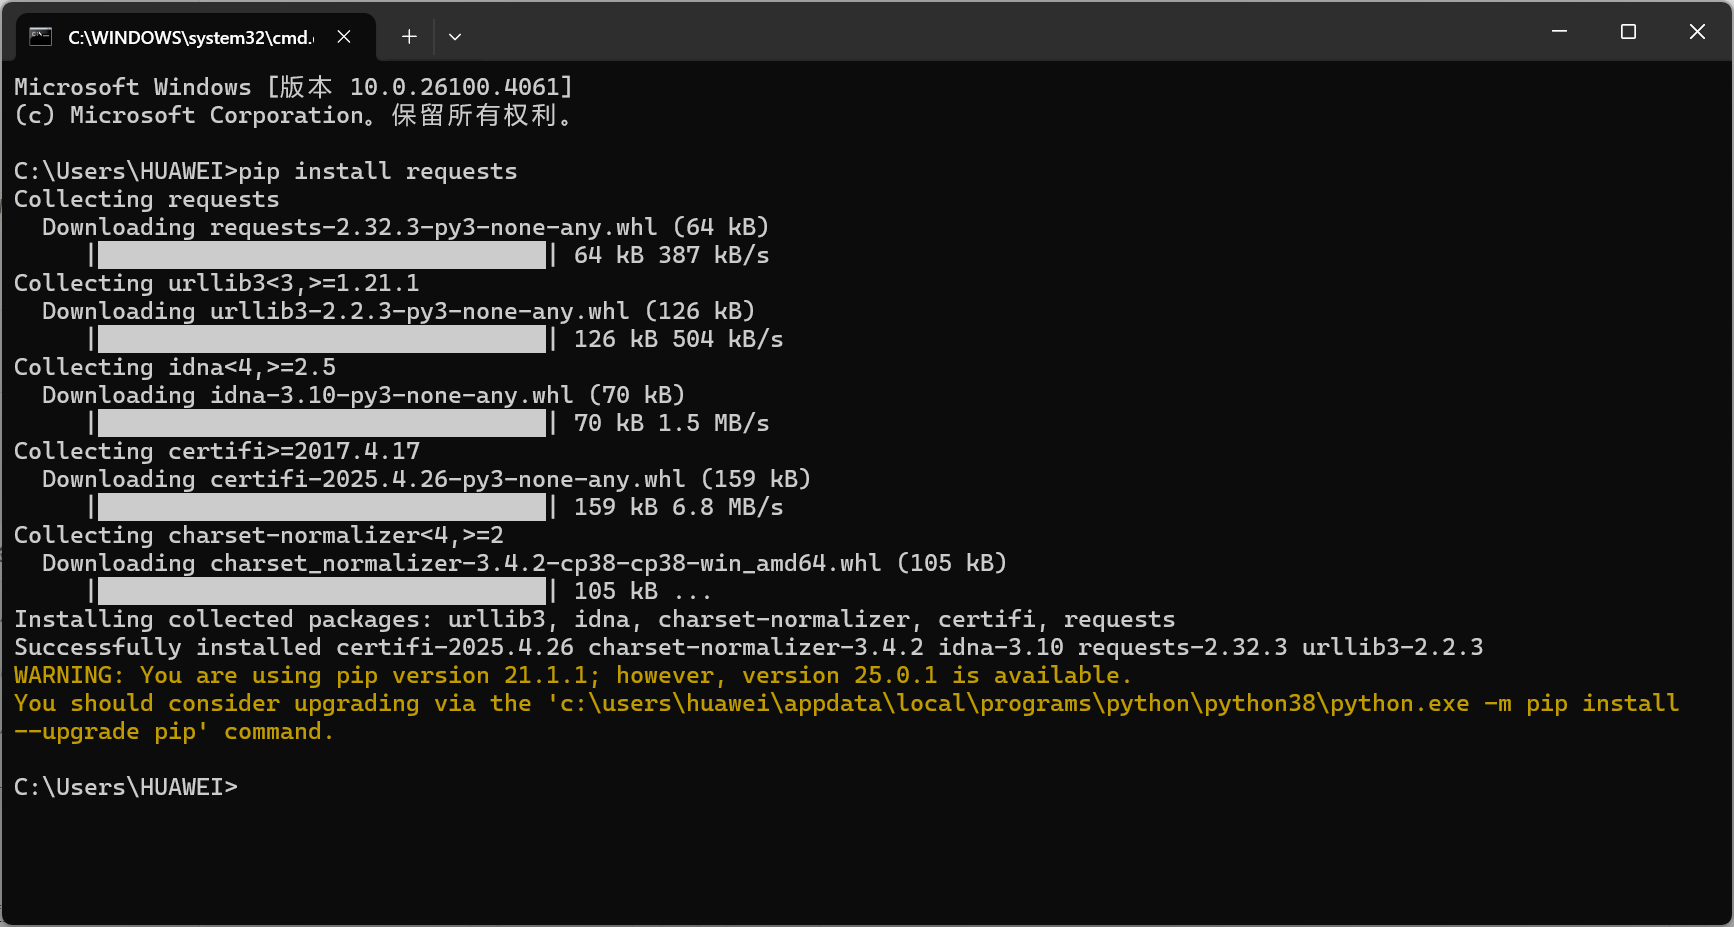
- 准备工作:安装必要库
pip install requests
![]()
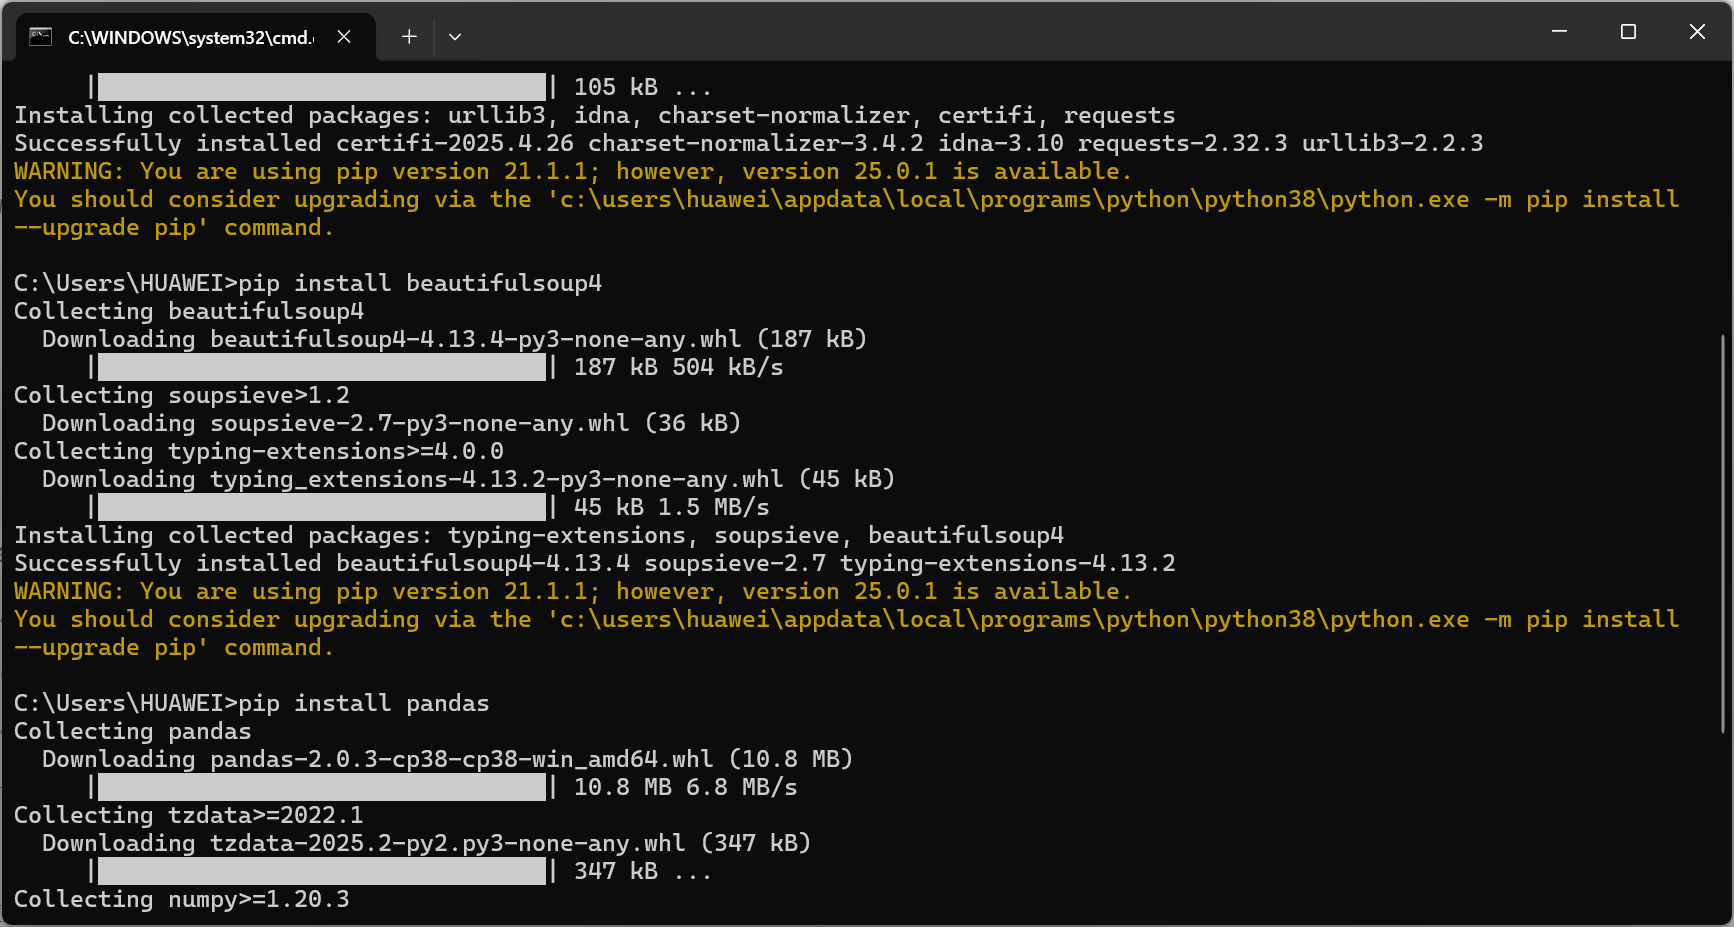
pip install beautifulsoup4
![]()
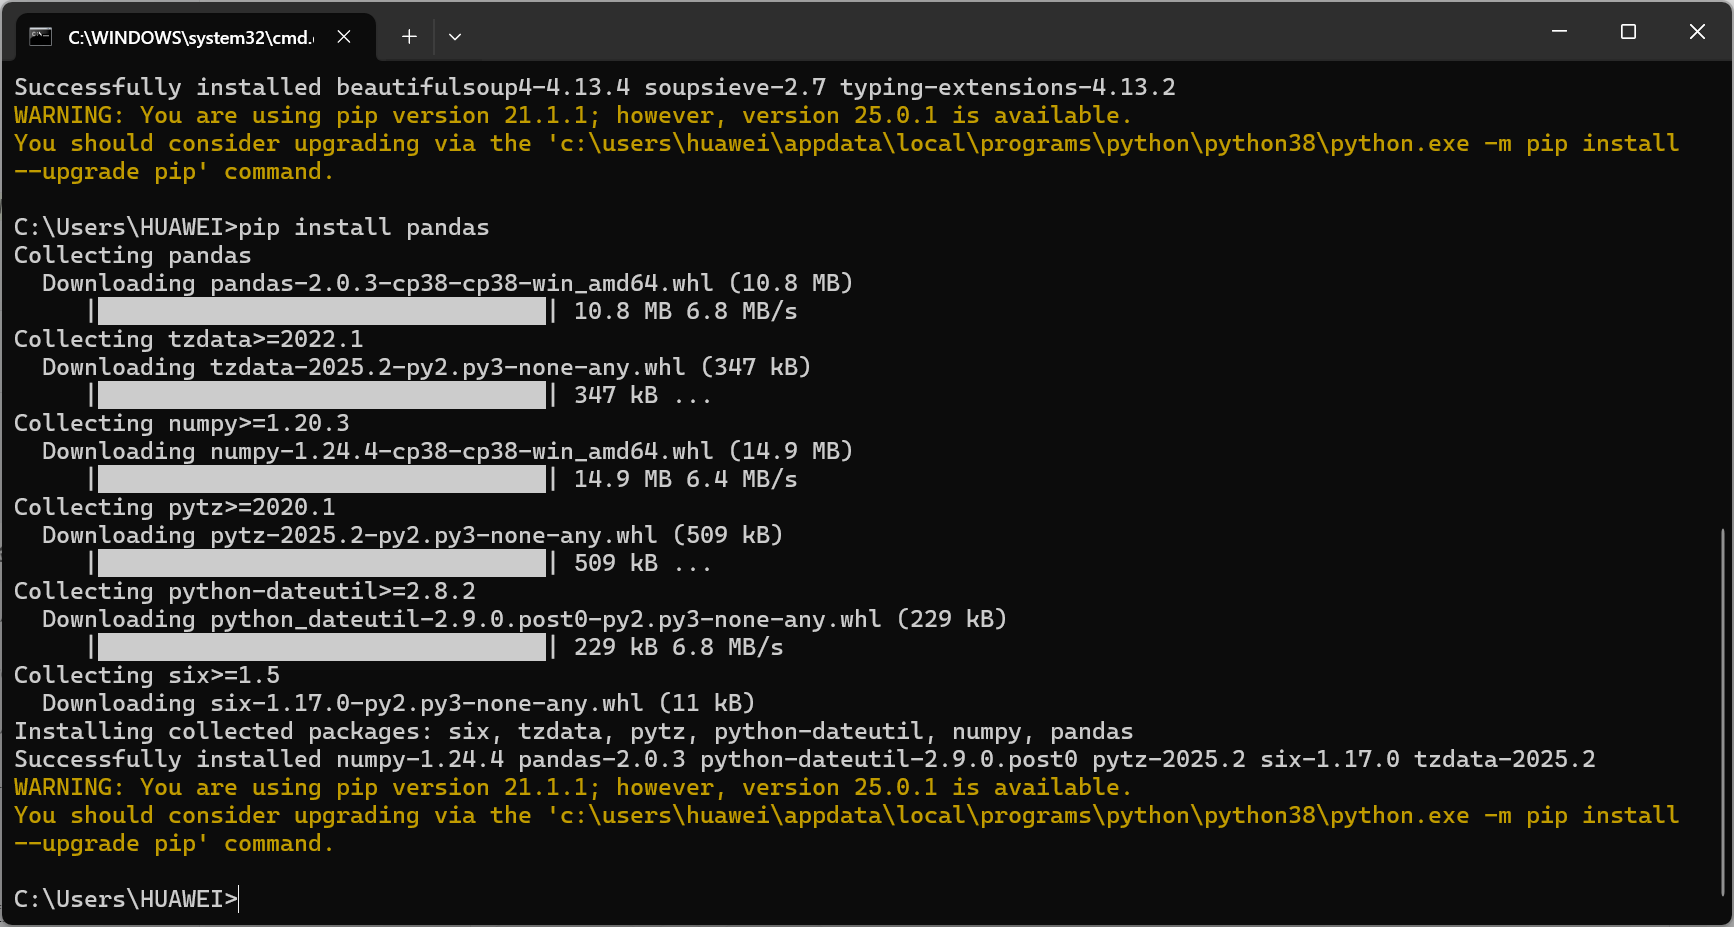
pip install pandas
![]()
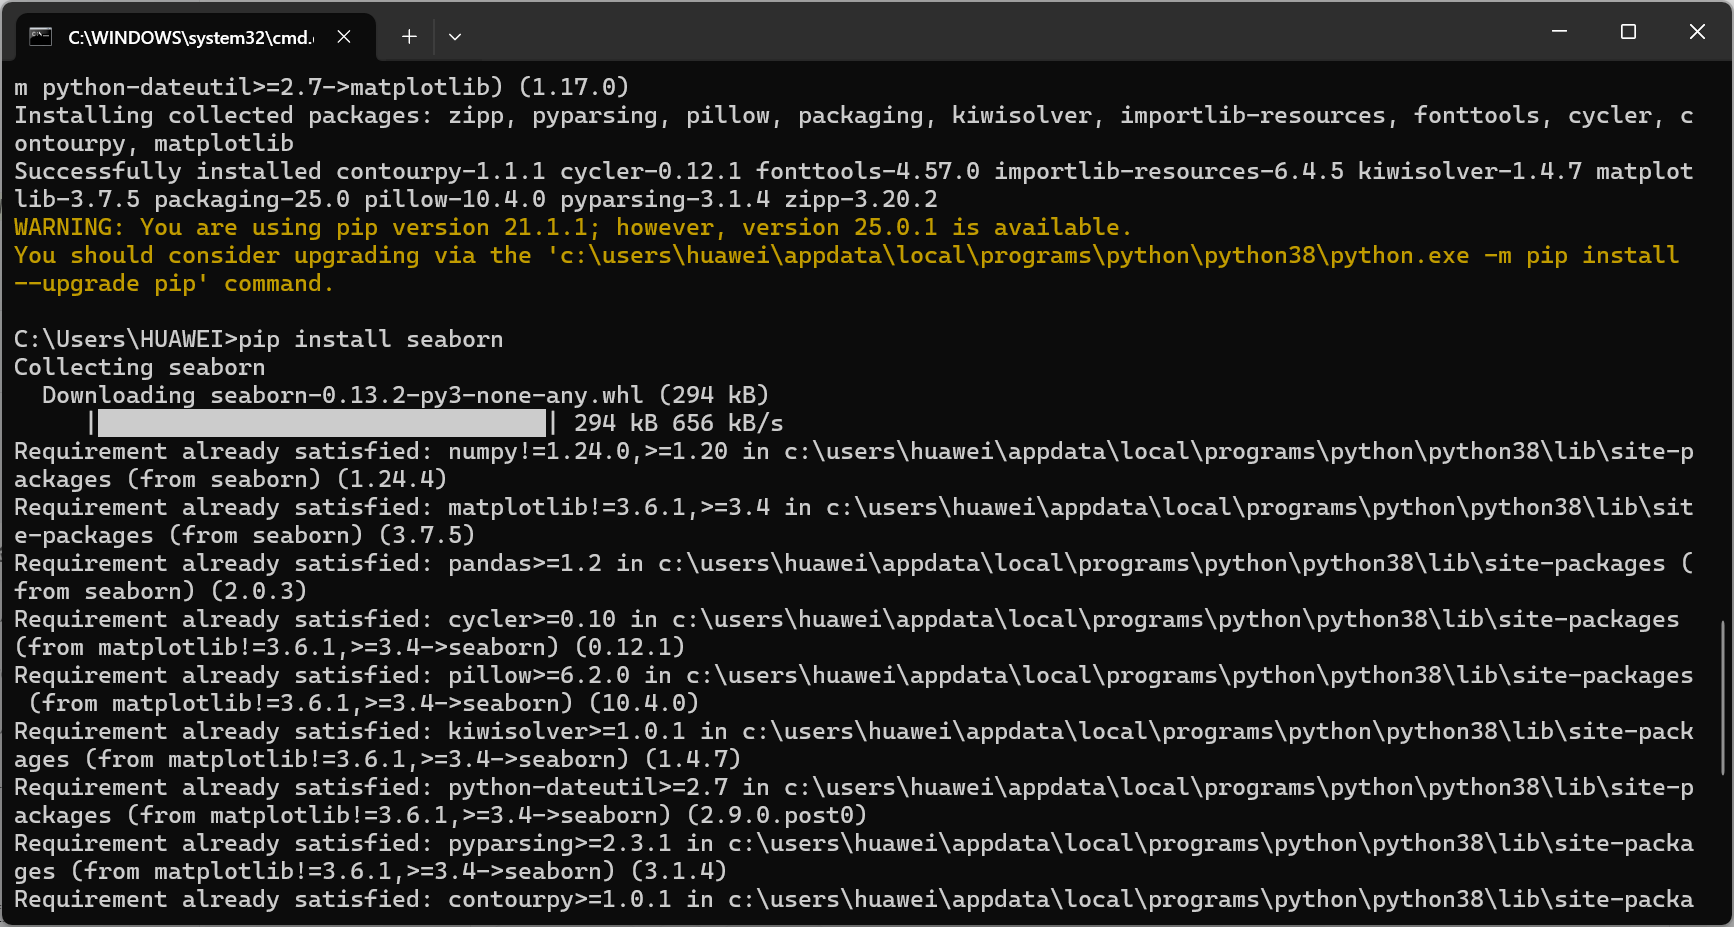
pip install matplotlib
pip install seaborn
![]()
- 编写代码并存入文件
![]()
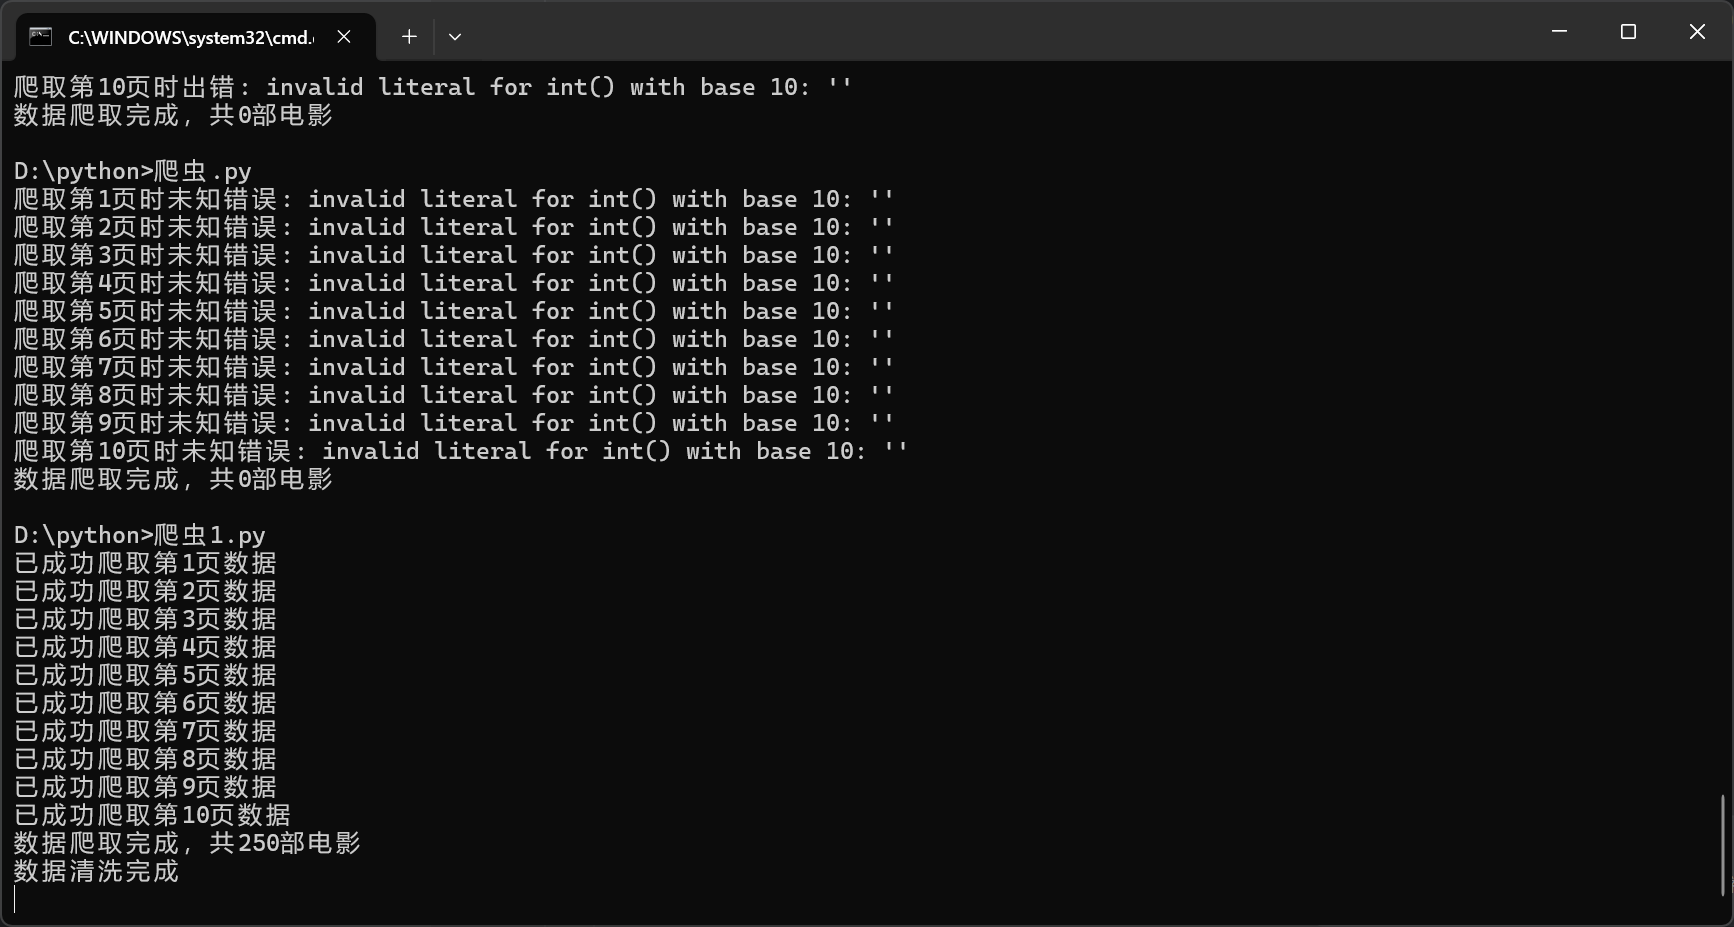
3.实现豆瓣电影数据爬取
![]()
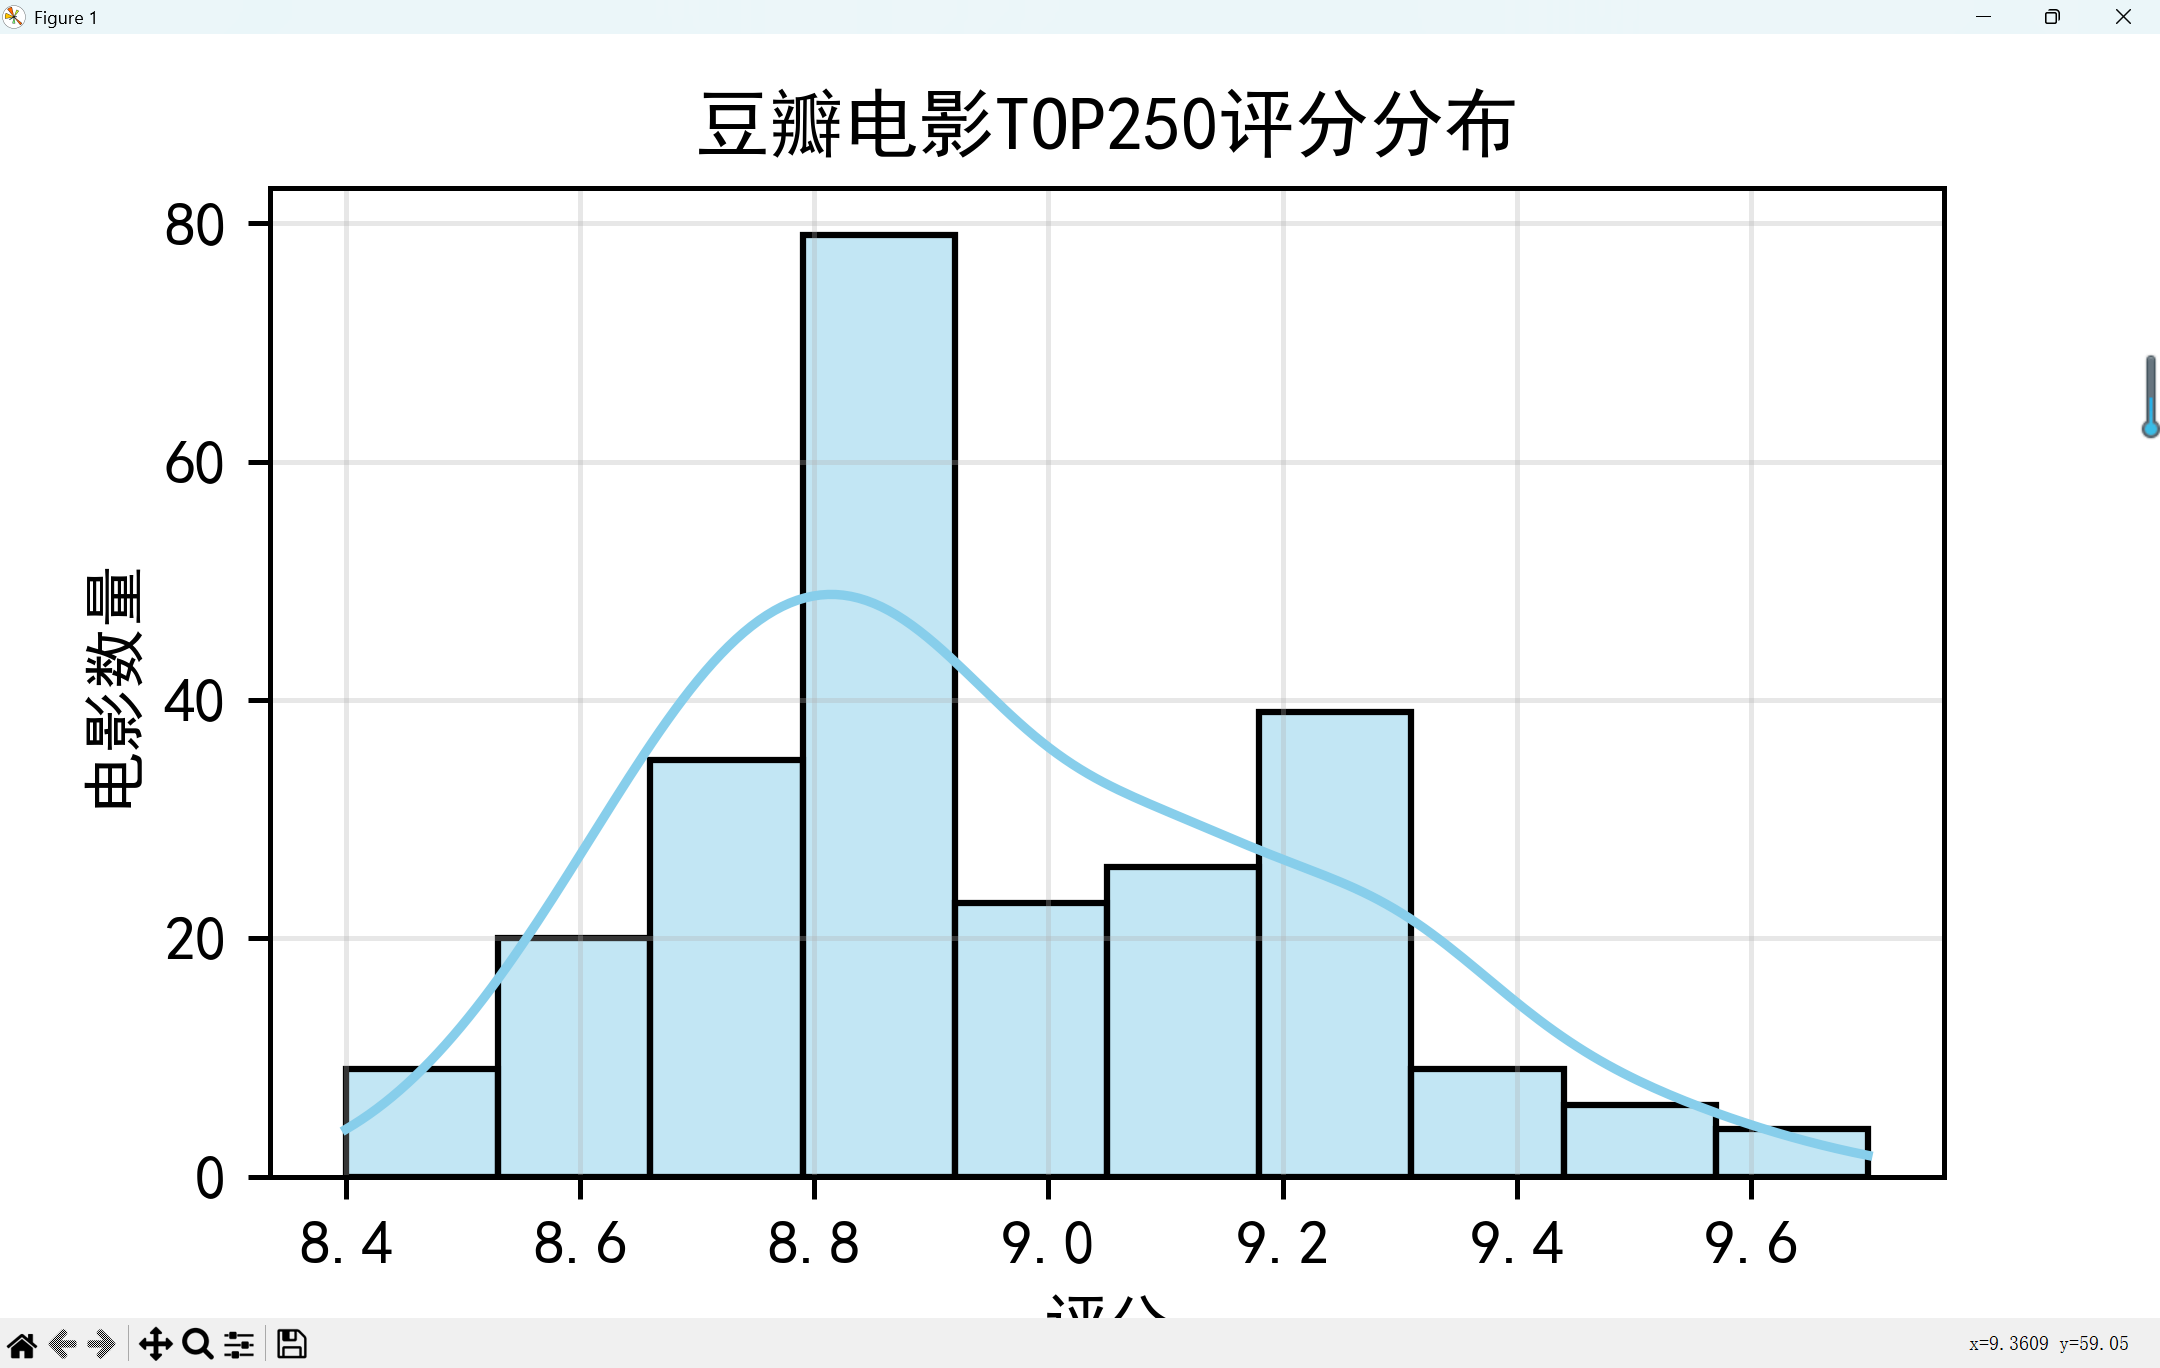
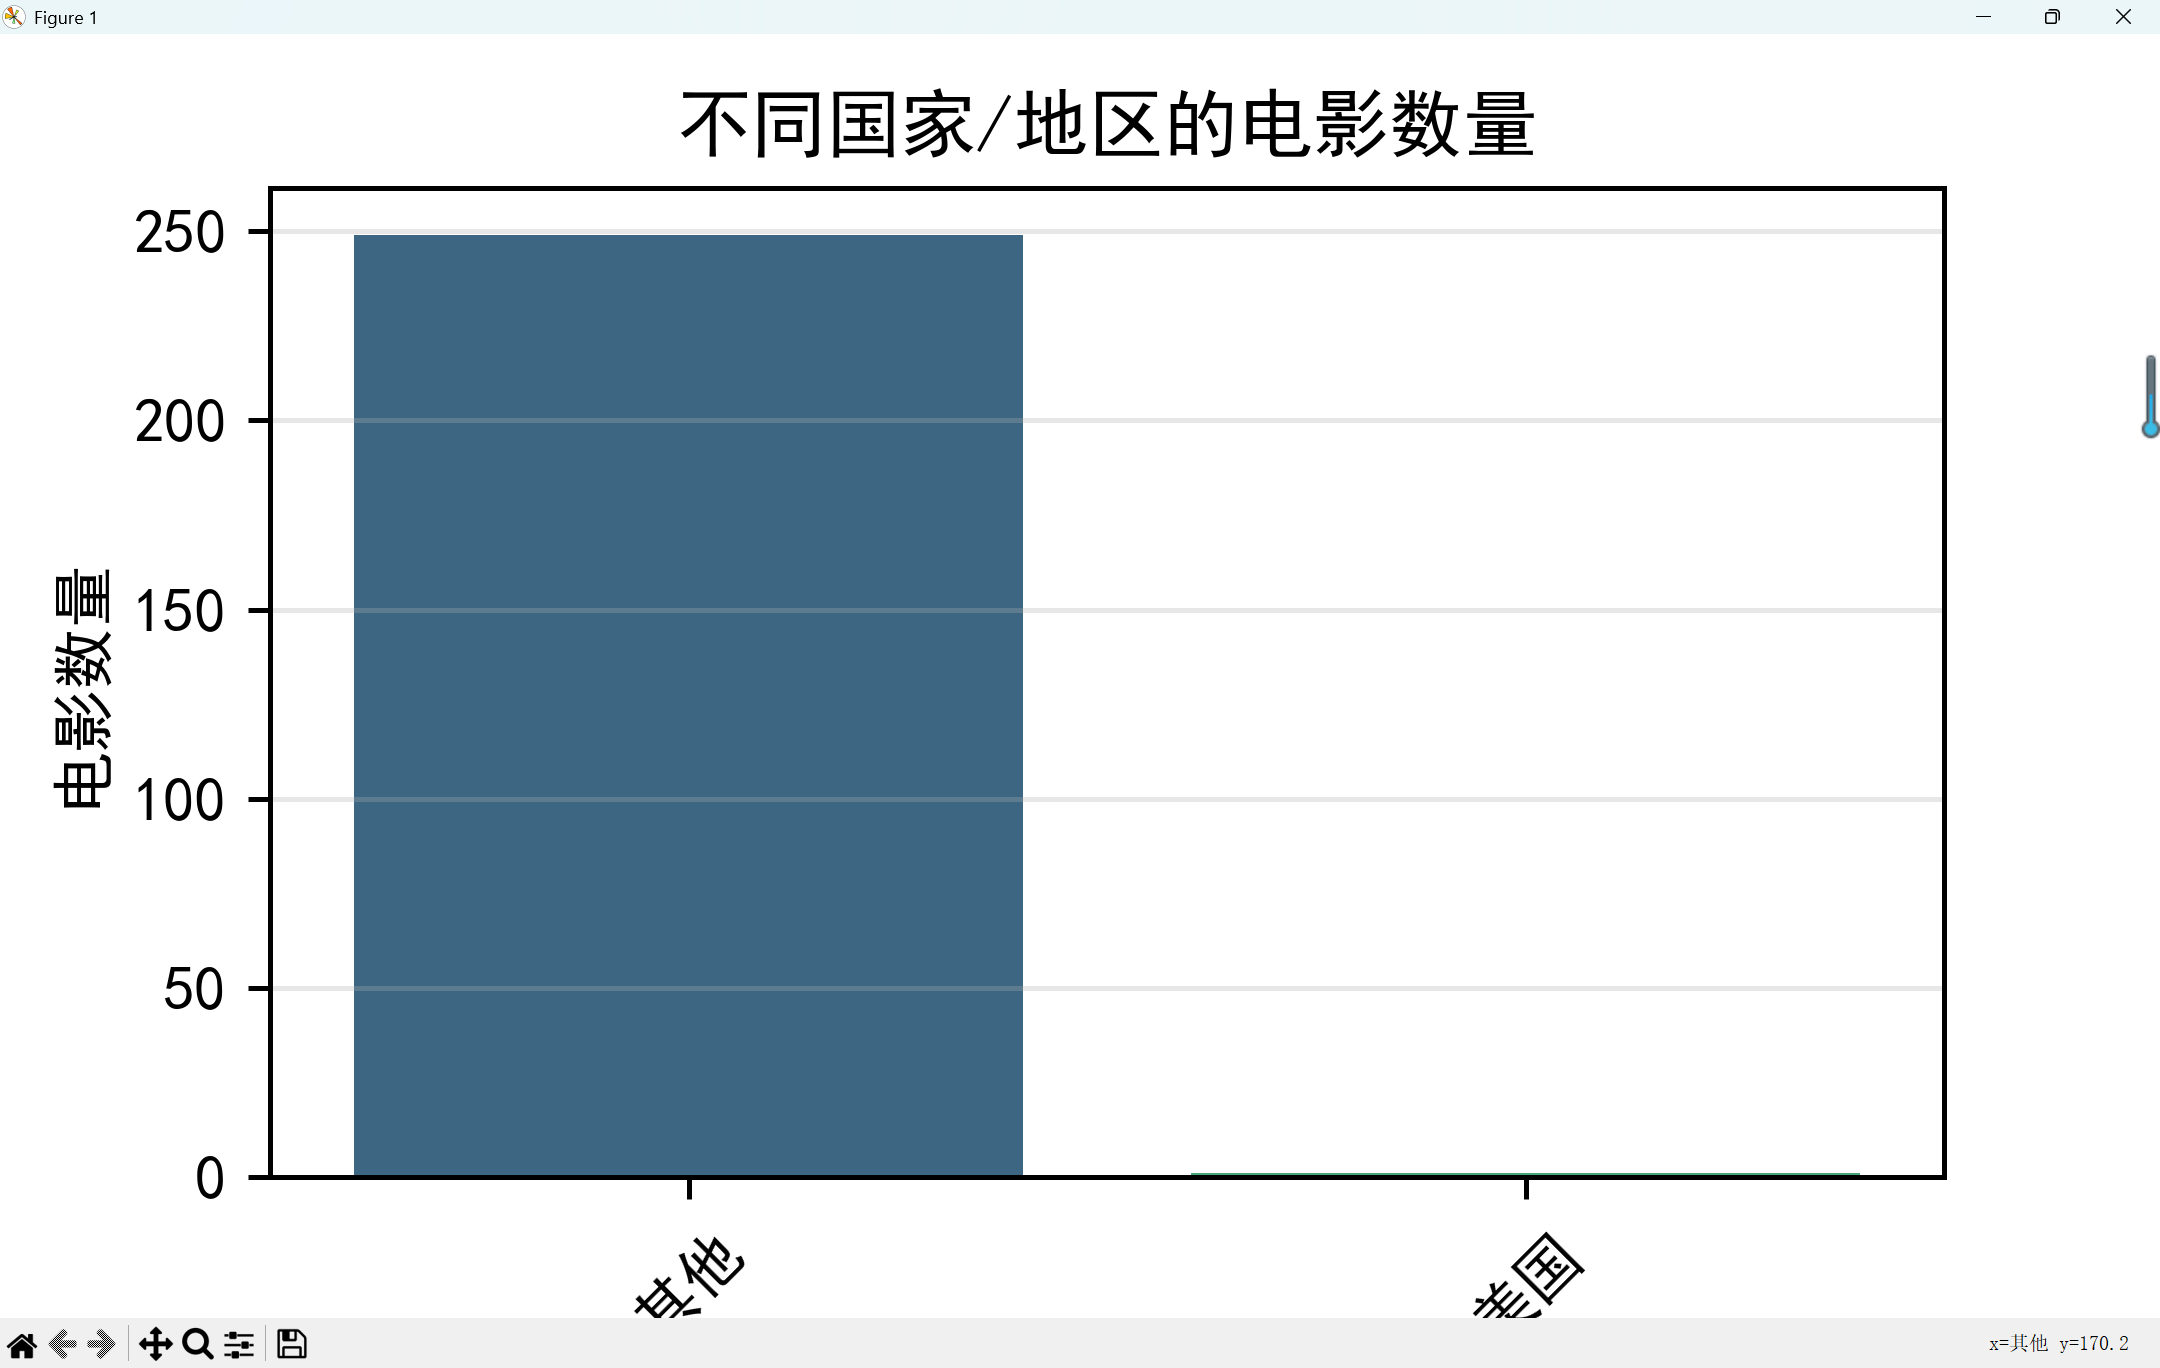
- 数据可视化分析
![]()
![]()
![]()
![]()
![]()
六、完整代码
import requests
from bs4 import BeautifulSoup
import pandas as pd
import time
import random
headers = {
'User-Agent': 'Mozilla/5.0 (Windows NT 10.0; Win64; x64) AppleWebKit/537.36 (KHTML, like Gecko) Chrome/91.0.4472.124 Safari/537.36',
'Accept': 'text/html,application/xhtml+xml,application/xml;q=0.9,image/webp,/;q=0.8',
'Accept-Language': 'zh-CN,zh;q=0.8,en;q=0.6',
'Connection': 'keep-alive',
}
proxies_list = []
all_movies = []
for start in range(0, 250, 25):
url = f'https://movie.douban.com/top250?start={start}'
proxies = random.choice(proxies_list) if proxies_list else None
try:
response = requests.get(url, headers=headers, timeout=15, proxies=proxies)
response.raise_for_status()
with open(f'page_{start}.html', 'w', encoding='utf-8') as f:
f.write(response.text)
soup = BeautifulSoup(response.text, 'html.parser')
movie_list = soup.find('ol', class_='grid_view').find_all('li')
for movie in movie_list:
movie_info = {}
title_span = movie.find('span', class_='title')
title = title_span.text if title_span else "未知名称"
movie_info['title'] = title
link_tag = movie.find('a')
link = link_tag['href'] if link_tag and 'href' in link_tag.attrs else "#"
movie_info['link'] = link
rating_span = movie.find('span', class_='rating_num')
rating = float(rating_span.text) if rating_span else 0.0
movie_info['rating'] = rating
try:
star_div = movie.find('div', class_='star')
if star_div:
votes_span = star_div.find_all('span')[-1]
votes_text = votes_span.text.strip()
votes = int(votes_text.replace('人评价', ''))
else:
votes = 0
except Exception as e:
print(f"解析电影 '{title}' 的评价人数失败: {e}")
votes = 0
movie_info['votes'] = votes
quote_p = movie.find('p', class_='quote')
intro = quote_p.find('span', class_='inq').text if quote_p and quote_p.find('span', class_='inq') else "暂无简介"
movie_info['intro'] = intro
info_p = movie.find('p', class_='')
info = info_p.text.strip() if info_p else "未知信息"
movie_info['info'] = info
all_movies.append(movie_info)
time.sleep(random.uniform(3, 8))
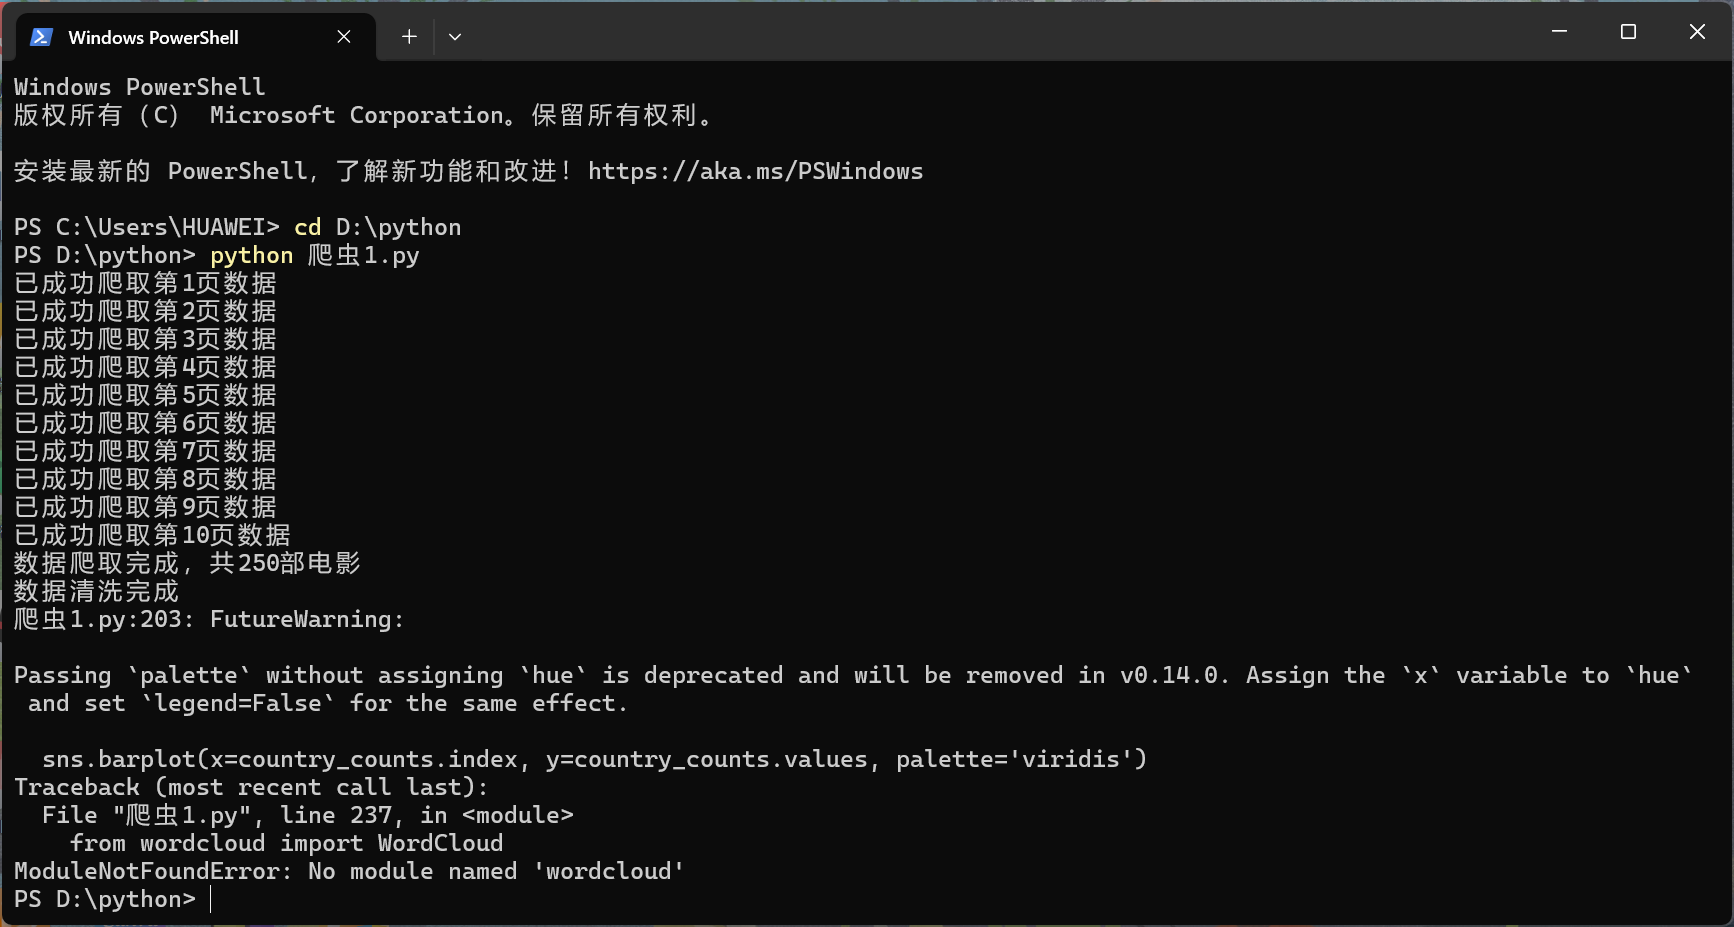
print(f"已成功爬取第{start // 25 + 1}页数据")
except requests.exceptions.HTTPError as http_err:
print(f"爬取第{start // 25 + 1}页时HTTP错误: {http_err}")
time.sleep(10)
except requests.exceptions.RequestException as req_err:
print(f"爬取第{start // 25 + 1}页时请求异常: {req_err}")
time.sleep(10)
except AttributeError as attr_err:
print(f"爬取第{start // 25 + 1}页时解析错误(可能页面结构变化): {attr_err}")
break
except Exception as e:
print(f"爬取第{start // 25 + 1}页时未知错误: {e}")
time.sleep(10)
df = pd.DataFrame(all_movies)
df.to_csv('douban_movies_top250.csv', index=False, encoding='utf-8-sig')
print(f"数据爬取完成,共{len(df)}部电影")
def extract_director_and_actors(info_text):
parts = info_text.split('\n') if info_text else []
parts = [p.strip() for p in parts if p.strip()]
director = "未知"
actors = "未知"
for part in parts:
if "导演" in part:
director = part.replace("导演: ", "").strip()
break
for part in parts:
if "主演" in part:
actors = part.replace("主演: ", "").strip()
break
return director, actors
def extract_year_and_country(title):
year = "未知"
country = "未知"
if "(" in title and ")" in title:
year_part = title.split("(")[-1].split(")")[0]
if year_part.isdigit():
year = year_part
if "美国" in title or "USA" in title or "US" in title:
country = "美国"
elif "中国" in title or "大陆" in title or "香港" in title or "台湾" in title:
country = "中国"
elif "日本" in title:
country = "日本"
elif "韩国" in title:
country = "韩国"
elif "英国" in title or "UK" in title:
country = "英国"
elif "法国" in title:
country = "法国"
elif "德国" in title:
country = "德国"
elif "印度" in title:
country = "印度"
else:
country = "其他"
return year, country
df['director'], df['actors'] = zip(df['info'].apply(extract_director_and_actors))
df['year'], df['country'] = zip(df['title'].apply(extract_year_and_country))
df['year'] = pd.to_numeric(df['year'], errors='coerce')
df.to_csv('douban_movies_cleaned.csv', index=False, encoding='utf-8-sig')
print("数据清洗完成")
import matplotlib.pyplot as plt
import seaborn as sns
plt.rcParams['figure.dpi'] = 300
plt.rcParams['font.sans-serif'] = ['SimHei']
plt.rcParams['axes.unicode_minus'] = False
plt.figure(figsize=(10, 6))
sns.histplot(df['rating'], bins=10, kde=True, color='skyblue')
plt.title('豆瓣电影TOP250评分分布')
plt.xlabel('评分')
plt.ylabel('电影数量')
plt.grid(True, alpha=0.3)
plt.savefig('rating_distribution.png')
plt.show()
country_counts = df['country'].value_counts()
plt.figure(figsize=(12, 6))
sns.barplot(x=country_counts.index, y=country_counts.values, palette='viridis')
plt.title('不同国家/地区的电影数量')
plt.xlabel('国家/地区')
plt.ylabel('电影数量')
plt.xticks(rotation=45)
plt.grid(True, axis='y', alpha=0.3)
plt.savefig('country_movie_counts.png')
plt.show()
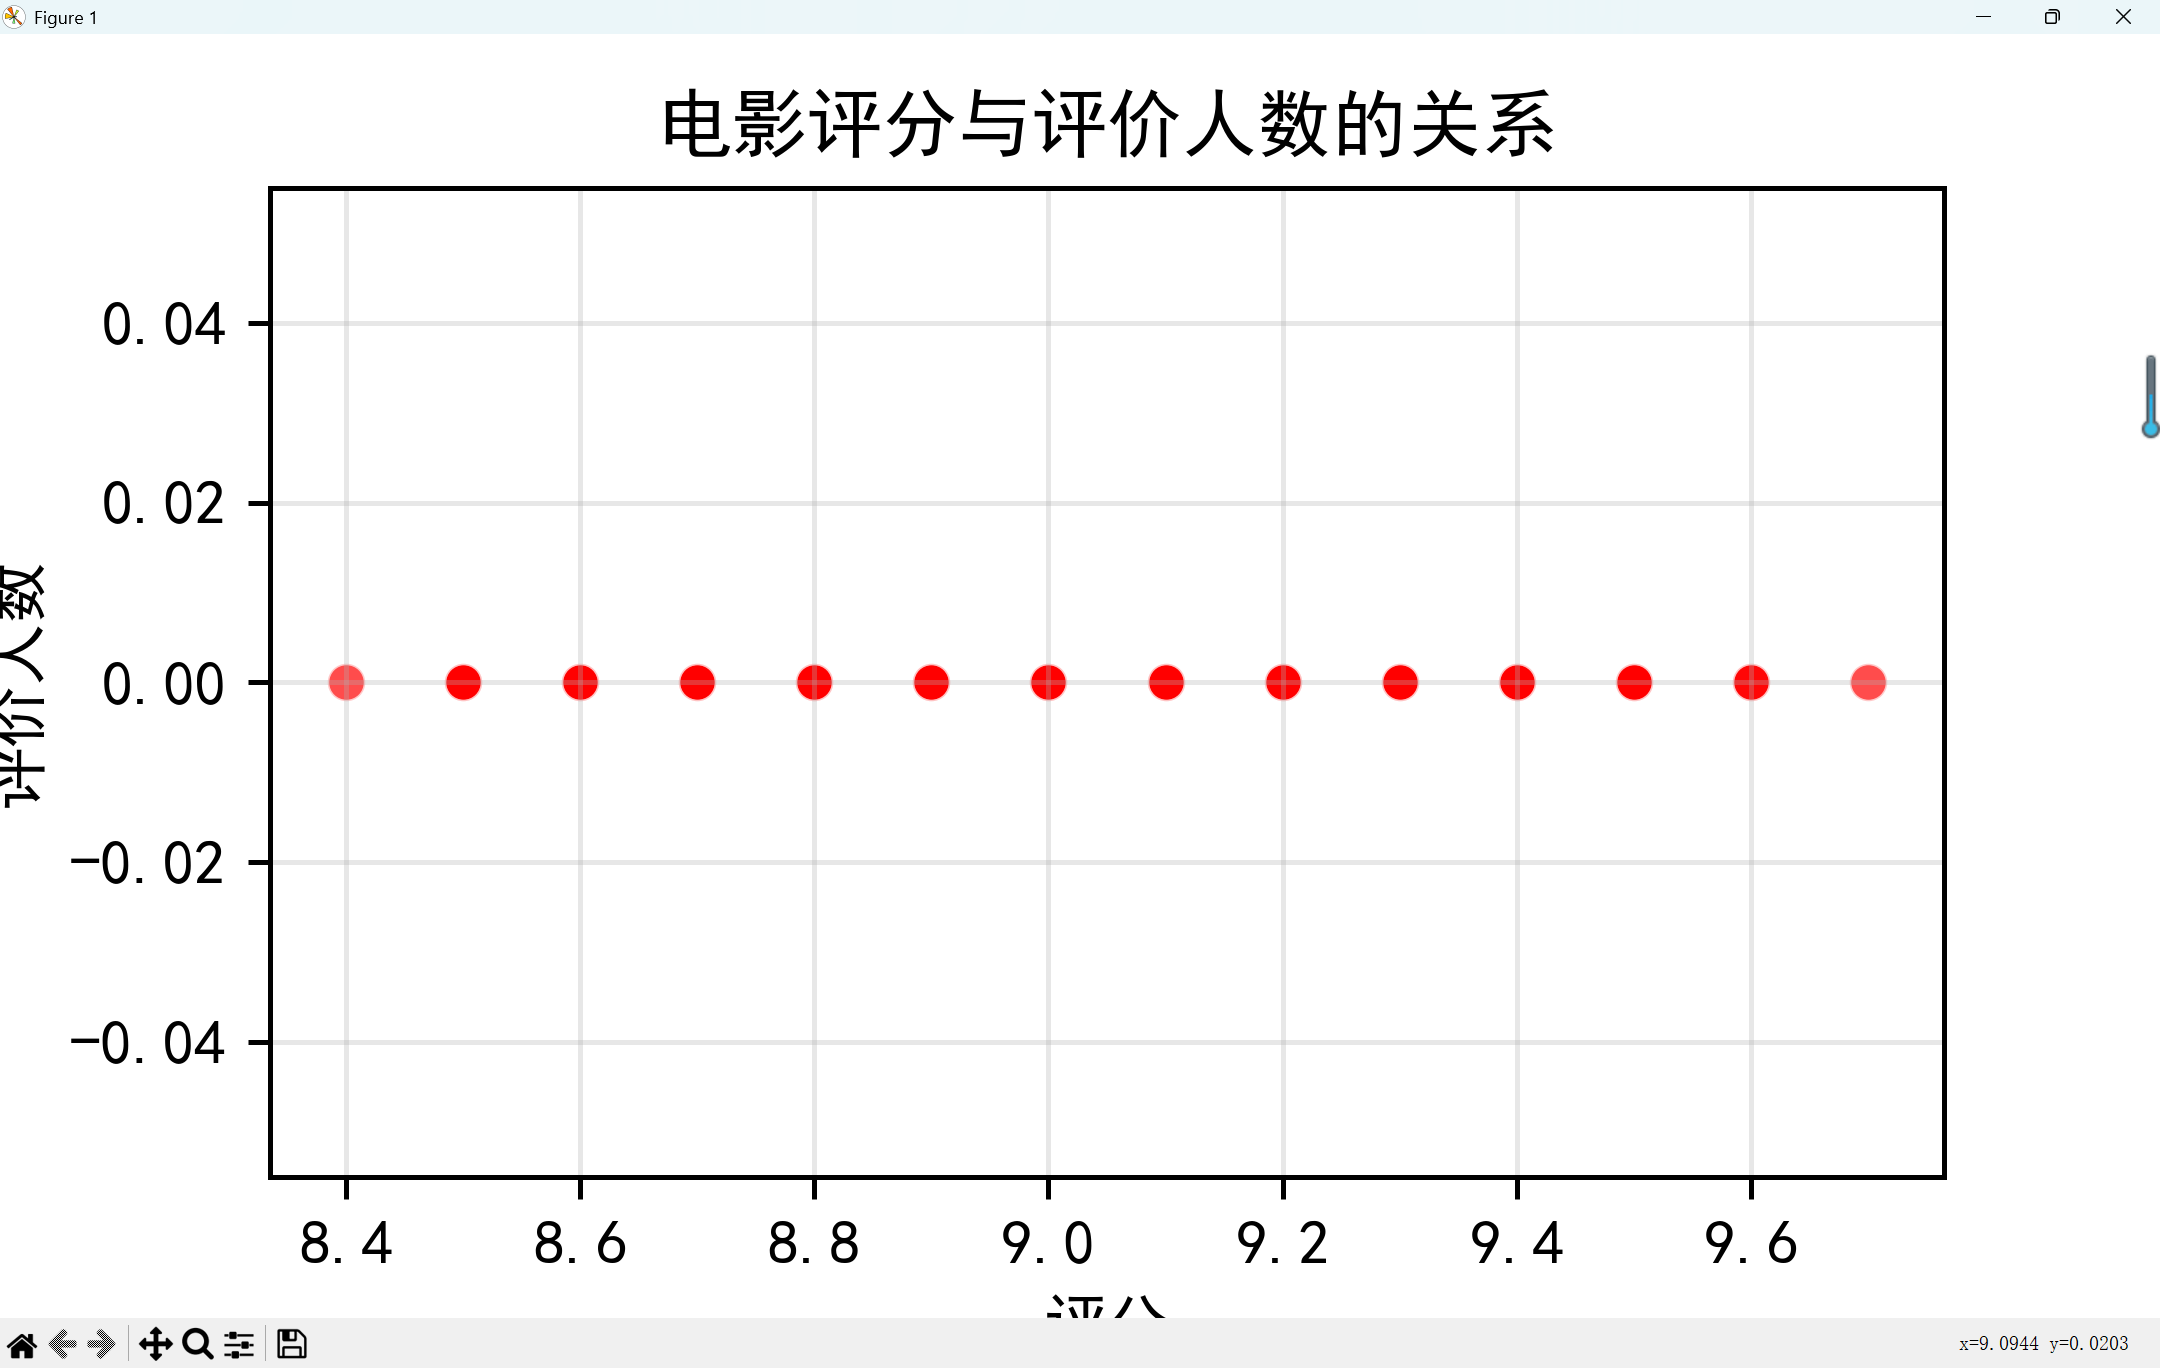
plt.figure(figsize=(10, 6))
sns.scatterplot(x='rating', y='votes', data=df, color='red', alpha=0.7)
plt.title('电影评分与评价人数的关系')
plt.xlabel('评分')
plt.ylabel('评价人数')
plt.grid(True, alpha=0.3)
plt.savefig('rating_votes_relationship.png')
plt.show()
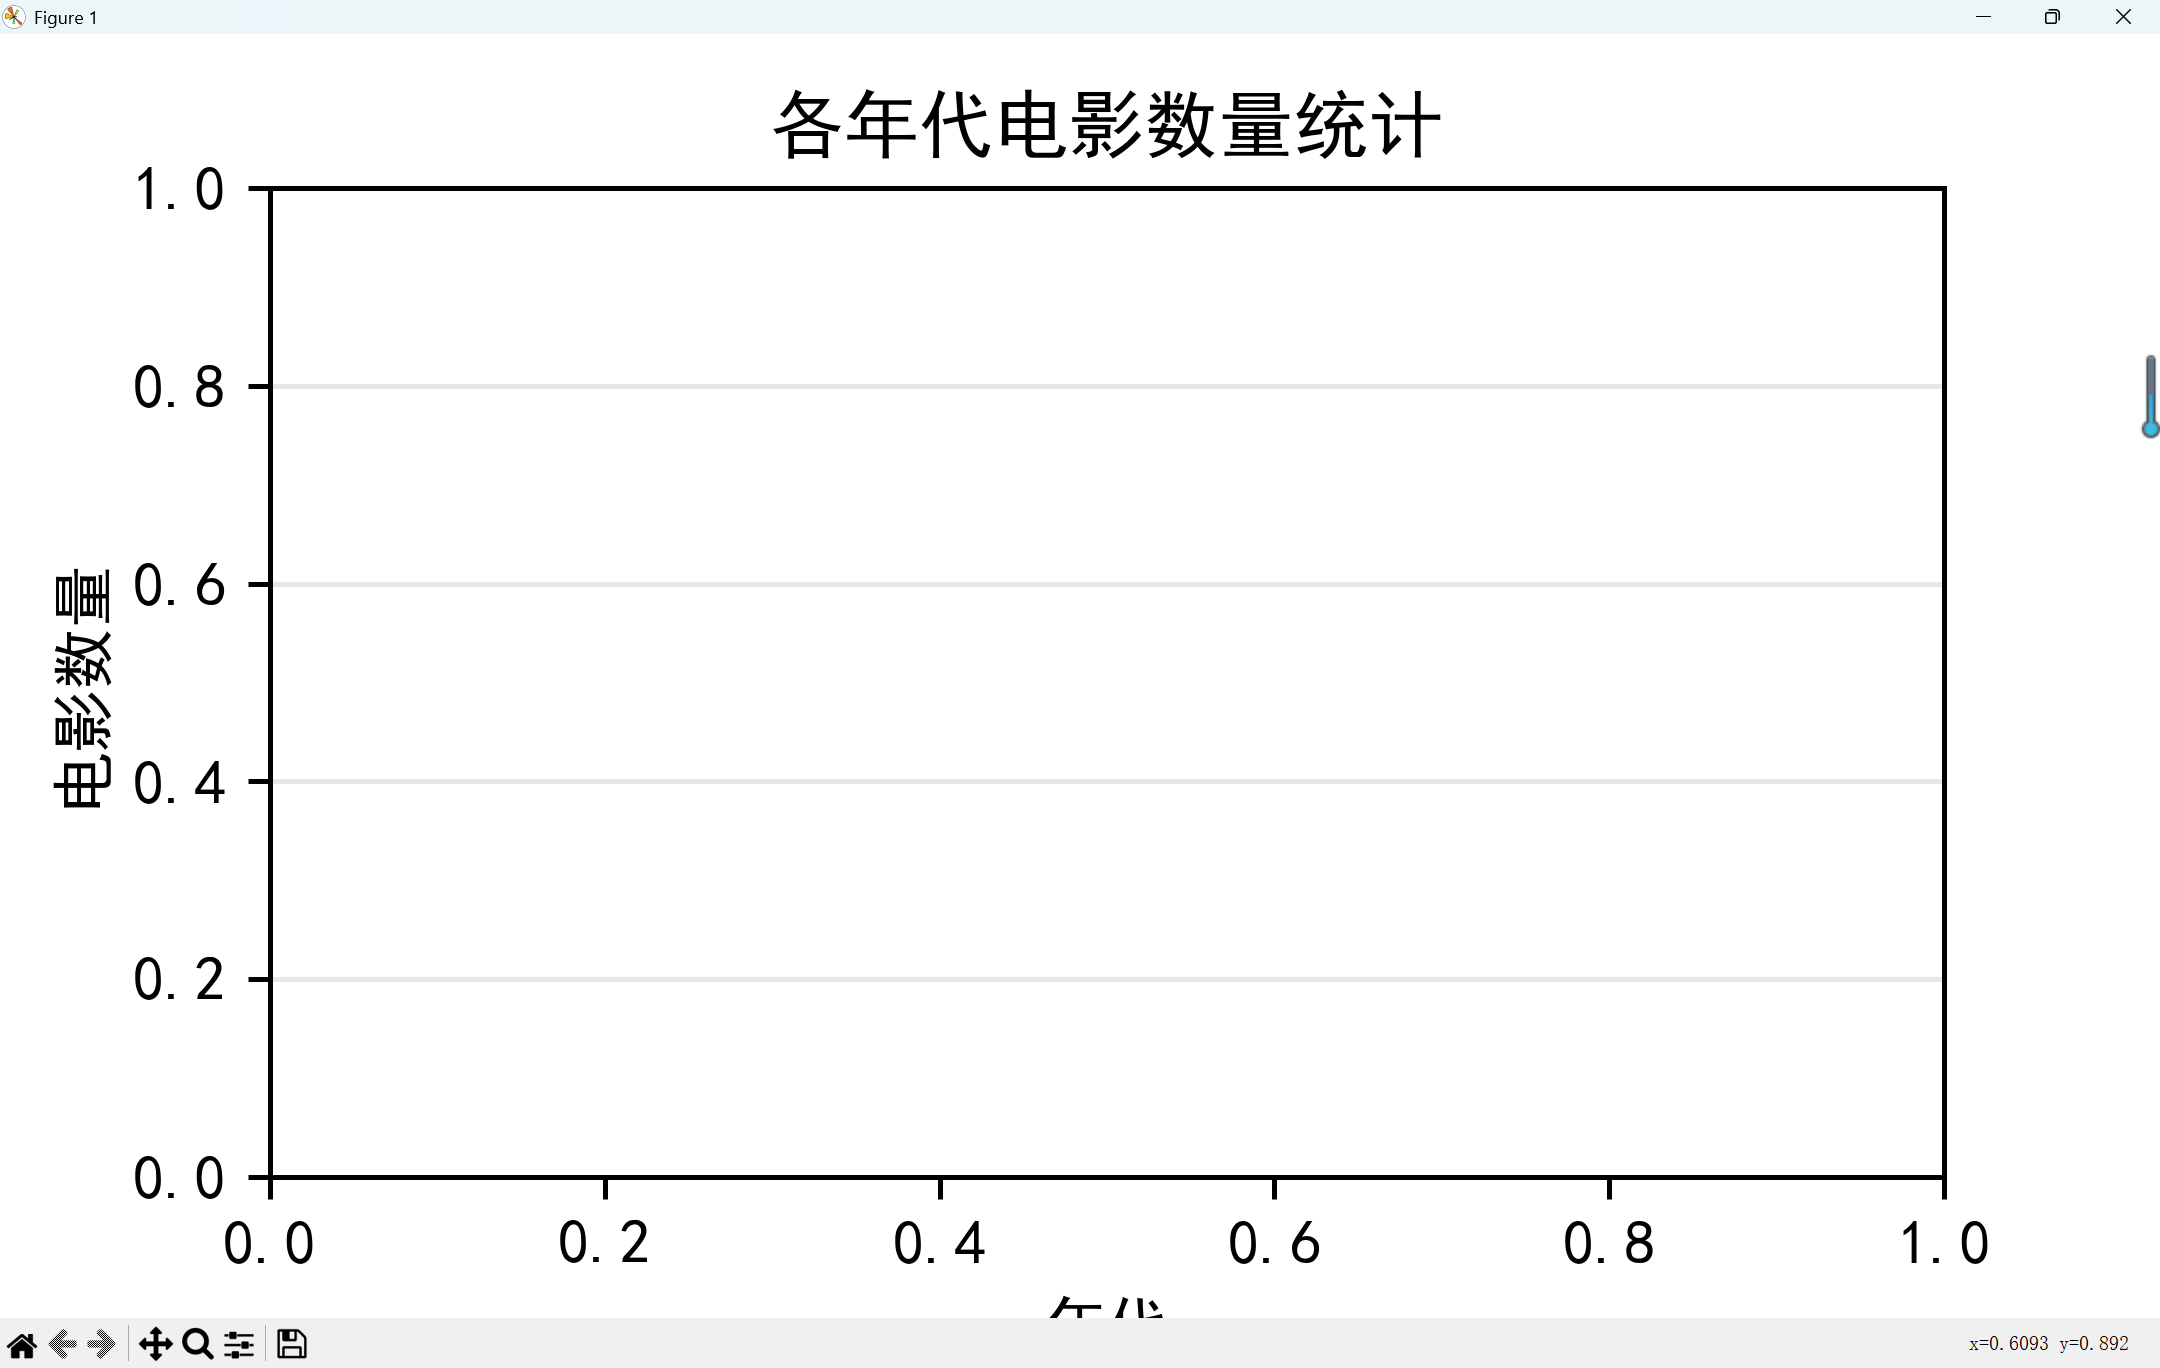
df['decade'] = (df['year'] // 10) * 10
decade_counts = df[df['year'].notna()]['decade'].value_counts().sort_index()
plt.figure(figsize=(12, 6))
sns.barplot(x=decade_counts.index.astype(int), y=decade_counts.values, palette='plasma')
plt.title('各年代电影数量统计')
plt.xlabel('年代')
plt.ylabel('电影数量')
plt.grid(True, axis='y', alpha=0.3)
plt.savefig('decade_movie_counts.png')
plt.show()
from wordcloud import WordCloud
high_rating_intro = ' '.join(df[df['rating'] >= 8.5]['intro'].dropna())
try:
wordcloud = WordCloud(
font_path='simhei.ttf',
width=800,
height=600,
background_color='white',
max_words=100
).generate(high_rating_intro)
plt.figure(figsize=(10, 8))
plt.imshow(wordcloud, interpolation='bilinear')
plt.axis('off')
plt.title('高评分电影简介词云')
plt.savefig('high_rating_wordcloud.png', bbox_inches='tight')
plt.show()
except Exception as e:
print(f"生成词云失败: {e}")
print("提示: 可能需要安装中文字体或指定正确的字体路径")
七、上传代码

八、实验总结
通过这次实验我掌握网络爬虫的核心流程:请求发送→HTML解析→数据提取→反爬应对,还学会使用Pandas进行文本清洗和数据类型转换以及Seaborn实现多维度数据可视化,提升数据解读能力。
九、结课总结
(一)感想与体会
回顾Python课程的学习,这一路充满挑战与收获。初次接触时,面对循环语句、函数定义等概念,常常看得一头雾水,运行代码时频繁报错,那种挫败感至今记忆犹新。
但课堂上老师细致入微的讲解,将复杂的知识拆解成一个个易于理解的小块。尤其是在讲解列表推导式时,通过生活实例类比,让我豁然开朗。学习通里丰富的课后习题和代码示例,成为我课后反复钻研的素材,遇到不懂的地方,就对照着示例一步步调试,慢慢摸索出规律。在实践项目中,我真切体会到 Python 的实用性。从简单的文件读写,到用pandas库处理表格数据,每一次成功实现功能,都让我更有信心。虽然现在还不能说完全掌握 Python,但这门课确实为我打开了编程世界的大门,也让我养成了查阅官方文档、主动搜索解决方案的学习习惯,这些都将成为我继续探索编程之路的宝贵财富。
(二)意见与建议
感觉课时比较少,而且有时候屏幕上的操作太快了跟不上。

 浙公网安备 33010602011771号