
TensorFlow 学习可视化 TensorBoard 简易教程
为了更方便 TensorFlow 程序的理解、调试与优化,我们发布了一套叫做 TensorBoard 的可视化工具。你可以用 TensorBoard 来展现你的 TensorFlow 图像,绘制图像生成的定量指标图以及附加数据。
我们将之前demo2的http://www.cnblogs.com/guolaomao/p/7901020.html
稍作修改:
import tensorflow as tf
import numpy as np

def add_layer(inputs,in_size,out_size,activation_function=None):
    with tf.name_scope("layer"):
        with tf.name_scope("weights"):
            Weights = tf.Variable(tf.random_normal([in_size,out_size]),name="W")
        with tf.name_scope("biases"):
            biases =  tf.Variable(tf.zeros([1,out_size]) + 0.1,name="b")
        with tf.name_scope("Wx_plus_b"):
            Wx_plus_b = tf.add(tf.matmul(inputs,Weights) , biases)
        if activation_function is None :
            outputs= Wx_plus_b
        else:
            outputs = activation_function(Wx_plus_b)
        return outputs

x_data = np.linspace(-1,1,300)[:,np.newaxis]
noise = np.random.normal(0,0.05,x_data.shape)
y_data = np.square(x_data) - 0.5 + noise

#defin placeholder  fort inputs to network
with tf.name_scope('inputs'):
    xs = tf.placeholder(tf.float32,[None,1],name='x_input')
    ys = tf.placeholder(tf.float32,[None,1],name='y_input')

l1 = add_layer(xs,1,10,activation_function=tf.nn.relu)
prediction = add_layer(l1,10,1,activation_function=None)

with tf.name_scope("loss"):
    loss =tf.reduce_mean(tf.reduce_sum( tf.square(ys-prediction),reduction_indices=[1]))
with tf.name_scope("train"):
    train_step = tf.train.GradientDescentOptimizer(0.1).minimize(loss)


sess = tf.Session()
writer = tf.summary.FileWriter("demo2-log/",sess.graph)
init = tf.global_variables_initializer()
sess.run(init)
然后运行这段代码
python demo2.py
就会在demo2-log/文件夹下创建一个文件,并在文件夹内生成相应的TensorBoard文件
然后执行代码
tensorboard --logdir demo3-log
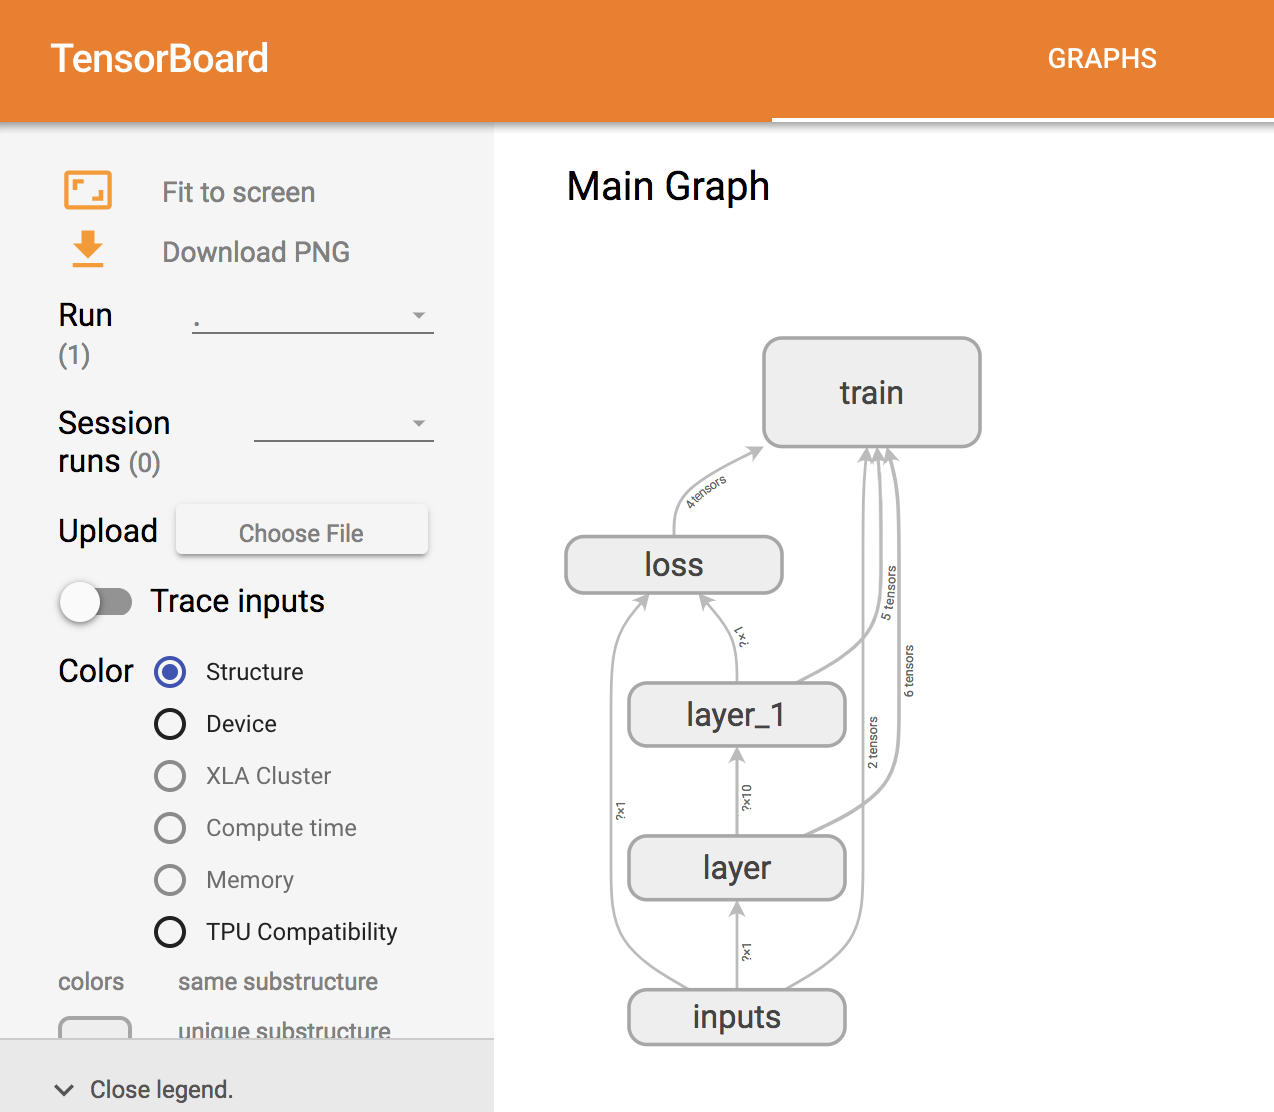
就能开启了服务。在终端里能看到服务的连接。在浏览器里打开相应的连接就能看到一个最简单基础的TensorBoard页面了。

 浙公网安备 33010602011771号