
use matplotlib to drew a table
$sudo apt-get install python3-matplotlib
gyf@gyf-VirtualBox:~$ python3
Python 3.6.9 (default, Nov 7 2019, 10:44:02)
[GCC 8.3.0] on linux
Type "help", "copyright", "credits" or "license" for more information.
>>> import matplotlib
>>> import matplotlib.pyplot as plt
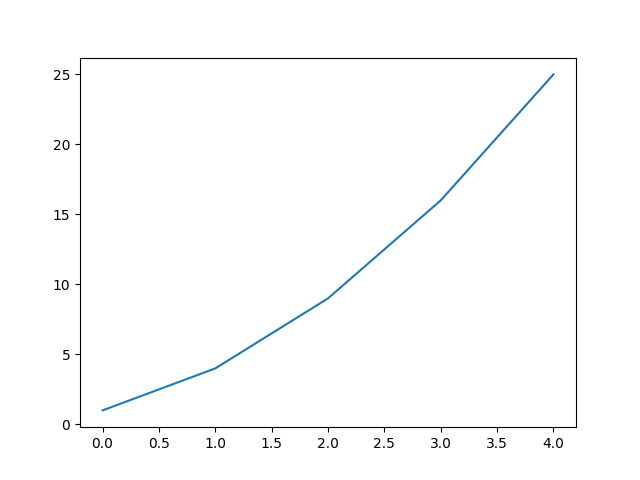
>>> squares=[1,4,9,16,25]
>>> plt.plot(squares)
[<matplotlib.lines.Line2D object at 0x7f43fc0675f8>]
>>> plt.show()
After do that ,you will see a picture on your screen.Just try to do it.
But how to define X-axis?
import matplotlib.pyplot as plt
squares=[1,4,9,16,25]
input_values=[1,2,3,4,5]
plt.plot(input_values,squares,linewidth=5)#the first arg is X-axis,the next one is Y-axis
plt.show()
the result is as below:


