记录一个小错误
先看一个脚本:
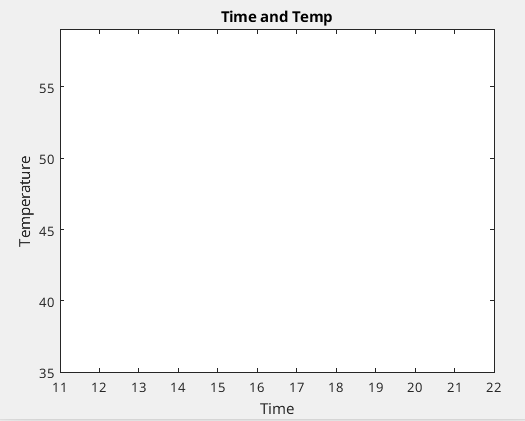
x=1:6;
y=[1 5 3 9 11 8];
plot(x, y, 'r*');

%Change the axes and label them
axis([11 22 35 59])
xlabel('Time')
ylabel('Temperature')

%Put a title on the plot
title('Time and Temp')
修改后的脚本:
 1 x=1:6;
 2 y=[1 5 3 9 11 8];
 3 plot(x, y, 'r*');
 4
 5 %Change the axes and label them
 6 axis([1 22 1 59])
 7 xlabel('Time')
 8 ylabel('Temperature')
 9
10 %Put a title on the plot
11 title('Time and Temp')
看结果:
只是修改了第6行的代码,主要是函数axis中指定了x和y的上下限,选取不合理,自然不会有图出来了。
axis应用须注意:1、本身是函数调用,需要用小括号,调用的参数需要用中括号括住,1234共四个参数,分别表示横轴的最小范围、横轴的最大范围;纵轴的最小范围、纵轴的最大范围
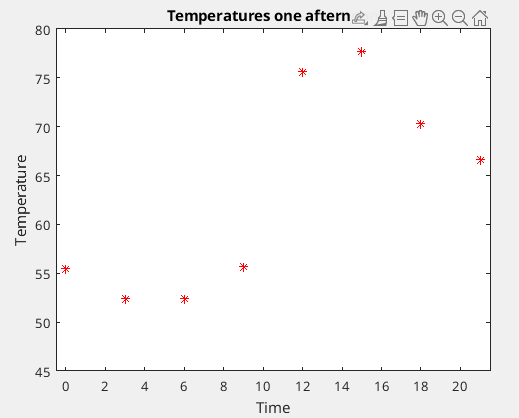
2、函数必须是plot函数之后调用,否则就没有作用了。看加了和没有加的前后效果吧
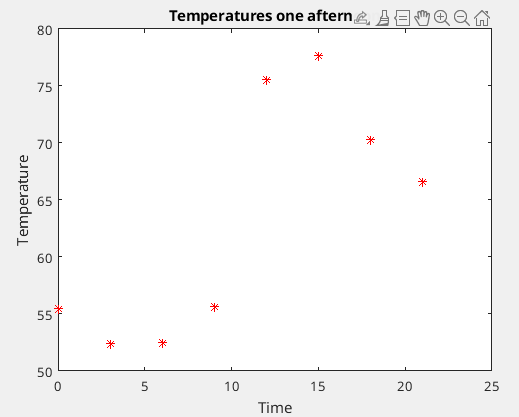
加了一句代码:axis([-0.5 21.5 45 80])

人就像是被蒙着眼推磨的驴子,生活就像一条鞭子;当鞭子抽到你背上时,你就只能一直往前走,虽然连你也不知道要走到什么时候为止,便一直这么坚持着。

 浙公网安备 33010602011771号