
matplotlib quiver 清奇的脑回路
matplotlib quiver:清奇的脑回路
    Call signature::

      quiver([X, Y], U, V, [C], **kw)

angles : {'uv', 'xy'} or array-like, optional, default: 'uv'
        Method for determining the angle of the arrows.

        - 'uv': The arrow axis aspect ratio is 1 so that
          if *U* == *V* the orientation of the arrow on the plot is 45 degrees
          counter-clockwise from the horizontal axis (positive to the right).

          Use this if the arrows symbolize a quantity that is not based on
          *X*, *Y* data coordinates.

        - 'xy': Arrows point from (x, y) to (x+u, y+v).
          Use this for plotting a gradient field, for example.

        - Alternatively, arbitrary angles may be specified explicitly as an array
          of values in degrees, counter-clockwise from the horizontal axis.

          In this case *U*, *V* is only used to determine the length of the
          arrows.

        Note: inverting a data axis will correspondingly invert the
        arrows only with ``angles='xy'``.

    scale : float, optional
        Number of data units per arrow length unit, e.g., m/s per plot width; a
        smaller scale parameter makes the arrow longer. Default is *None*.

        If *None*, a simple autoscaling algorithm is used, based on the average
        vector length and the number of vectors. The arrow length unit is given by
        the *scale_units* parameter.

    scale_units : {'width', 'height', 'dots', 'inches', 'x', 'y', 'xy'}, optional
        If the *scale* kwarg is *None*, the arrow length unit. Default is *None*.

        e.g. *scale_units* is 'inches', *scale* is 2.0, and ``(u, v) = (1, 0)``,
        then the vector will be 0.5 inches long.

        If *scale_units* is 'width' or 'height', then the vector will be half the
        width/height of the axes.

        If *scale_units* is 'x' then the vector will be 0.5 x-axis
        units. To plot vectors in the x-y plane, with u and v having
        the same units as x and y, use
        ``angles='xy', scale_units='xy', scale=1``.
angles
angles这个参数的目的非常简单,因为图的宽和高可能不同,所以x方向的单位长度和y方向的单位长度可能不同,这时我们需要做出选择,一是不管长度对不对,角度一定要对,此时angles='uv',二是不管角度了,只要长度对就可以了,此时angles='xy'
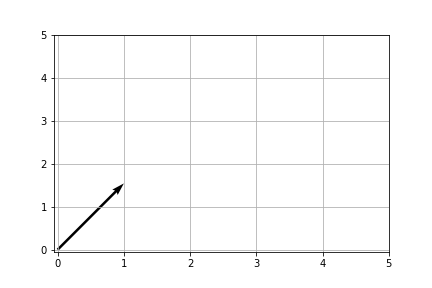
plt.quiver(0, 0, 1, 1, angles='uv', scale_units='x', scale=1)
plt.xticks(np.arange(0, 6))
plt.yticks(np.arange(0, 6))
plt.grid()
plt.savefig('fig01.png')
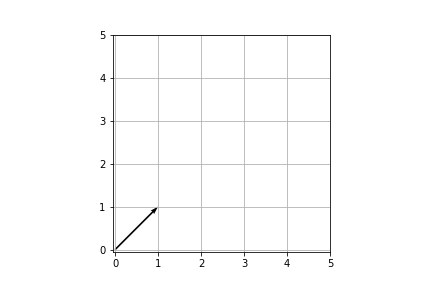
plt.quiver(0, 0, 1, 1, angles='xy', scale_units='xy', scale=1)
plt.xticks(np.arange(0, 6))
plt.yticks(np.arange(0, 6))
plt.grid()
plt.savefig('fig02.png')

如上,angle='uv'保证了角度是45度,因为是(1,1)向量,而angle='xy'保证了在x,y方向长度都为1.
scale_units='x', scale=1是说对于对象(1, 1)向量的单位长度在图中就表示为x方向的单位长度。注意这里有两个单位长度,前一个是数据的单位长度,后一个是在图中用多长的线段表示。
angles='xy', scale_units='xy', scale=1就是表示数学中向量的最好方法,(1, 1)向量表示在图中也是(1, 1)向量。
plt.axis('square')
plt.quiver(0, 0, 1, 1, angles='uv', scale_units='x', scale=1)
plt.xticks(np.arange(0, 6))
plt.yticks(np.arange(0, 6))
plt.grid()
plt.savefig('fig03.png')
plt.axis('square')
plt.quiver(0, 0, 1, 1, angles='xy', scale_units='xy', scale=1)
plt.xticks(np.arange(0, 6))
plt.yticks(np.arange(0, 6))
plt.grid()
plt.savefig('fig04.png')

这两个图说明如果图中x, y方向的单位长度相等,则angles='uv'和angles='xy'没有区别。
scale_units和scale
plt.axis('square')
plt.quiver(0, 0, 0, 1, scale_units='height', scale=1)
plt.xticks(np.arange(0, 6))
plt.yticks(np.arange(0, 6))
plt.grid()
plt.savefig('fig05.png')

plt.axis('square')
plt.quiver(0, 0, 0, 1, scale_units='height', scale=5)
plt.xticks(np.arange(0, 6))
plt.yticks(np.arange(0, 6))
plt.grid()
plt.savefig('fig06.png')
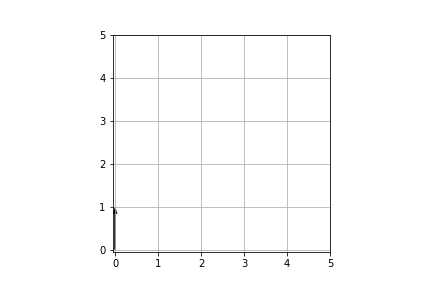
(0, 1)矢量的长度为1(单位长度),在图中用1/scale * scale_units的长度表示。
scale_units='height', scale=1,表示(0, 1)矢量用一整个子图(axes)的高度来表示。
scale_unitsj='height', scale=5, 表示(0, 1)矢量用1/5子图(axes)的高度来表示。
所以可能matplotlib quiver是可以配合quiverkey来绝对的反应速度的大小,但可能quiver更适合来反应样本点之间速度的相对大小,如果一定要反应速度的绝对大小,可以叠加速度的contourf(要注意叠加次序,应当是contourf上叠加quiver)。

 浙公网安备 33010602011771号