
Centos8部署ELK+filebeat日志收集系统
一、简介
ELK是Elasticsearch、Logstash、Kibana三款开源软件的简称,对外可以作为日志管理系统,它可以收集任何来源的日志,并且对日志进行分析与可视化展示
Elasticsearch是一款开源分布式搜索引擎,它的主要功能为提供收集、分析、存储数据
Logstash是一款服务端的数据传输软件,它的主要功能日志的收集、分析、过滤工具,它可以从不同的来源中提取数据,转换并存储到Elasticsearch中供后续处理
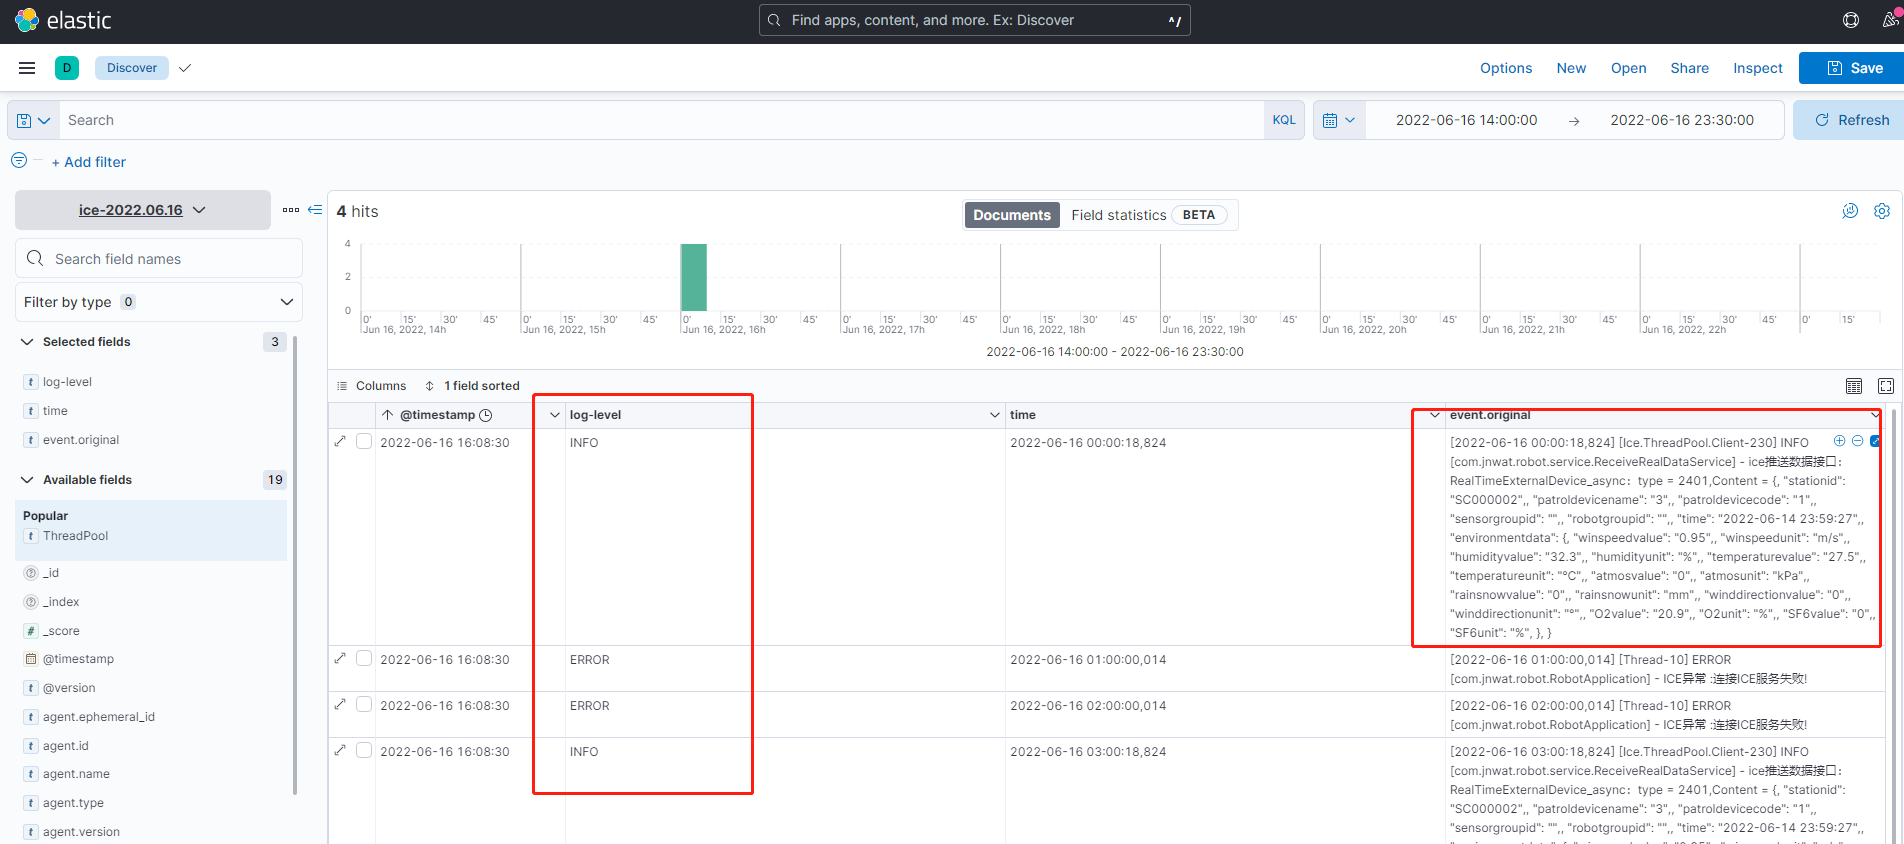
Kibana是一款基于web的图形界面,它的主要功能是搜索、分析和可视化存储在Elasticsearch中的日志数据
Filebeat:是一款轻量级的开源日志文件数据搜集器,通常在需要采集数据的客户端安装Filebeat,并指定目录与日志格式,Filebeat就能快速收集数据后发送给logstash进行解析,或发送给Elasticsearch存
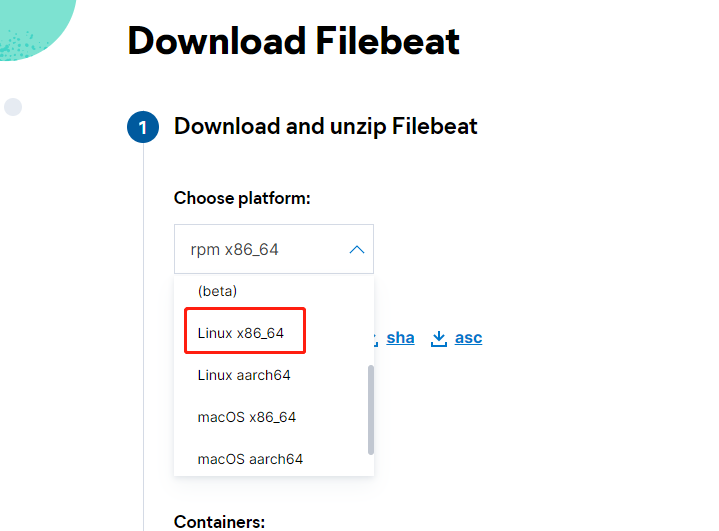
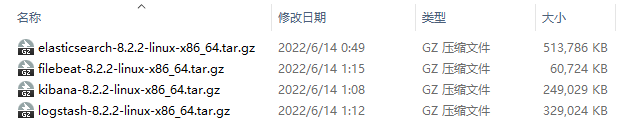
二、下载官方安装包(注意版本要一致)
https://www.elastic.co/cn/downloads/beats/filebeat
https://www.elastic.co/cn/downloads/elasticsearch
https://www.elastic.co/cn/downloads/kibana
https://www.elastic.co/cn/downloads/logstash
三、服务器准备
准备两台centos8服务器,单集群模式,使用两台只是为了让日志采集与日志分析拆分开,也可准备一台机器学习
配置好ip与hostname,截图是我的配置 vim /etc/hosts,注意配置完之后ping一下hostname,看看是否通

关闭防火墙和selinux
systemctl stop firewalld
systemctl disable firewalld
关闭selinux参考:https://www.cnblogs.com/guanym520/articles/16373523.html
四、服务器部署应用分布
slave1 部署 Filebeat 用于日志收集
slave2部署 Elasticsearch、Logstash、Kibana 用于日志分析,搜索,展示
五、slave2部署es
解压安装包并移动到制定位置
[root@slave2 opt]# tar -zxvf elasticsearch-8.2.2-linux-x86_64.tar.gz
[root@slave2 opt]# mv elasticsearch-8.2.2 /usr/local/elasticsearch-8.2.2
新建data和log文件夹用于存放数据
cd /usr/local/elasticsearch-8.2.2/
mkdir data
mkdir log
进入config文件夹,修改elasticsearch.yml
cd config/
vim elasticsearch.yml
# ---------------------------------- Cluster -----------------------------------
#
# Use a descriptive name for your cluster:
#
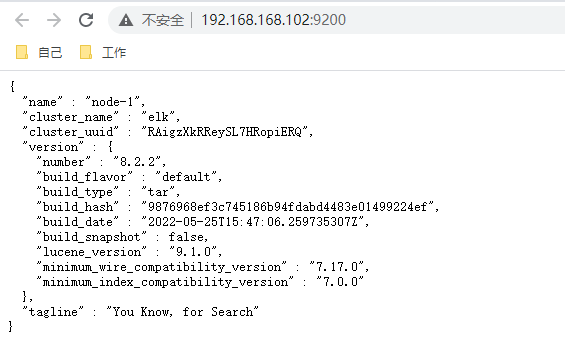
cluster.name: elk
#
# ------------------------------------ Node ------------------------------------
#
# Use a descriptive name for the node:
#
node.name: node-1
#
# Add custom attributes to the node:
#
node.attr.rack: r1
#
# ----------------------------------- Paths ------------------------------------
#
# Path to directory where to store the data (separate multiple locations by comma):
#
path.data: /usr/local/elasticsearch-8.2.2/data
#
# Path to log files:
#
path.logs: /usr/local/elasticsearch-8.2.2/log
#开启xpack
xpack.security.enabled: false
xpack.security.transport.ssl.enabled: false
#
##允许跨域
http.cors.enabled: true
http.cors.allow-origin: "*"
http.cors.allow-headers: Authorization,X-Requested-With,Content-Type,Content-Length
# ---------------------------------- Network -----------------------------------
#
# By default Elasticsearch is only accessible on localhost. Set a different
# address here to expose this node on the network:
#
network.host: 0.0.0.0
#
# By default Elasticsearch listens for HTTP traffic on the first free port it
# finds starting at 9200. Set a specific HTTP port here:
#
http.port: 9200
#
# For more information, consult the network module documentation.
#
# --------------------------------- Discovery ----------------------------------
#
# Pass an initial list of hosts to perform discovery when this node is started:
# The default list of hosts is ["127.0.0.1", "[::1]"]
#
discovery.seed_hosts: ["192.168.168.102"]
#
# Bootstrap the cluster using an initial set of master-eligible nodes:
#
cluster.initial_master_nodes: ["node-1"]
#
因为es默认不能用root用户启动,也不推荐使用root启动es,需要去创建一个新用户
adduser es
passwd es
[root@slave2 config]# chown -R es:es /usr/local/elasticsearch-8.2.2/
[root@slave2 config]# chmod 770 /usr/local/elasticsearch-8.2.2/
es用户拥有的文件和内存权限比较低,需要修改
#切换到root用户修改
vim /etc/security/limits.conf
# 在最后面追加下面内容
es hard nofile 65536
es soft nofile 65536 #es是启动elasticsearch的用户
max_map_count文件包含限制一个进程可以拥有的VMA(虚拟内存区域)的数量
vim /etc/sysctl.conf
# 在最后面追加下面内容
vm.max_map_count=655360
执行 sysctl -p
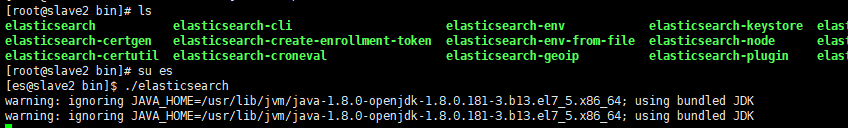
切换es用户,到bin目录,启动es(后台启动命令./elasticsearch -d)
su es
./elasticsearch
六、slave2部署Logstash
[root@slave2 opt]# tar -zxvf logstash-8.2.2-linux-x86_64.tar.gz
[root@slave2 opt]# mv logstash-8.2.2 /usr/local/logstash-8.2.2
[root@slave2 opt]# cd /usr/local/logstash-8.2.2/
编写对接filebeat与es的配置文件
input {
#从filebeat取数据,端口与filebeat配置文件一致
beats {
port => 5044
}
}
filter {
#多行日志合并插件,很多错误日志是多行代表一个日志,但是es中拆分开了,用于日志合并,后边我也会新写一篇文章结合日志进行讲解,包括每个字段的意思
multiline {
pattern => "\[\d{4}\-\d{1,2}\-\d{1,2}"
negate => true
what => "previous"
}
#grok 语法,后边我会结合我的生产日志讲解每个是什么意思
grok {
match => { "message" => "\[%{TIMESTAMP_ISO8601:time}\]\s*%{NOTSPACE:ThreadPool}\s*%{LOGLEVEL:log-level}\s*\[%{DATA:class}\]\s*%{GREEDYDATA:message}"}
remove_field => ["message"]
}
date {
match => ["time", "YYYY-MM-DD HH:mm:ss"]
target => "@timestamp"
}
}
output {
stdout { codec => rubydebug} #控制台打印日志,用于调试
#配合filebate filetype 使用,详情查看filebate配置,可以区别不同服务的日志
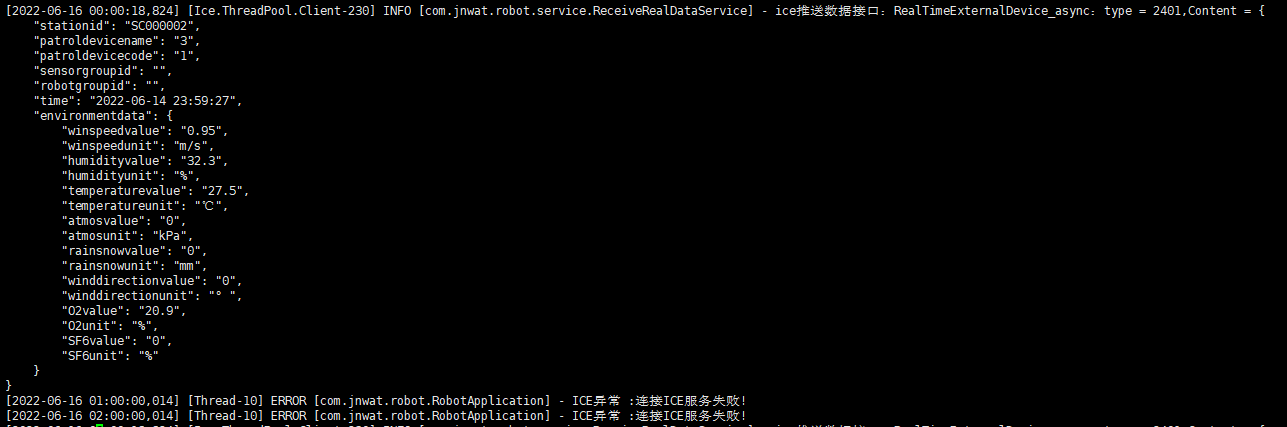
if [filetype] == "log_ice" {
elasticsearch {
hosts => ["192.168.168.102:9200"]
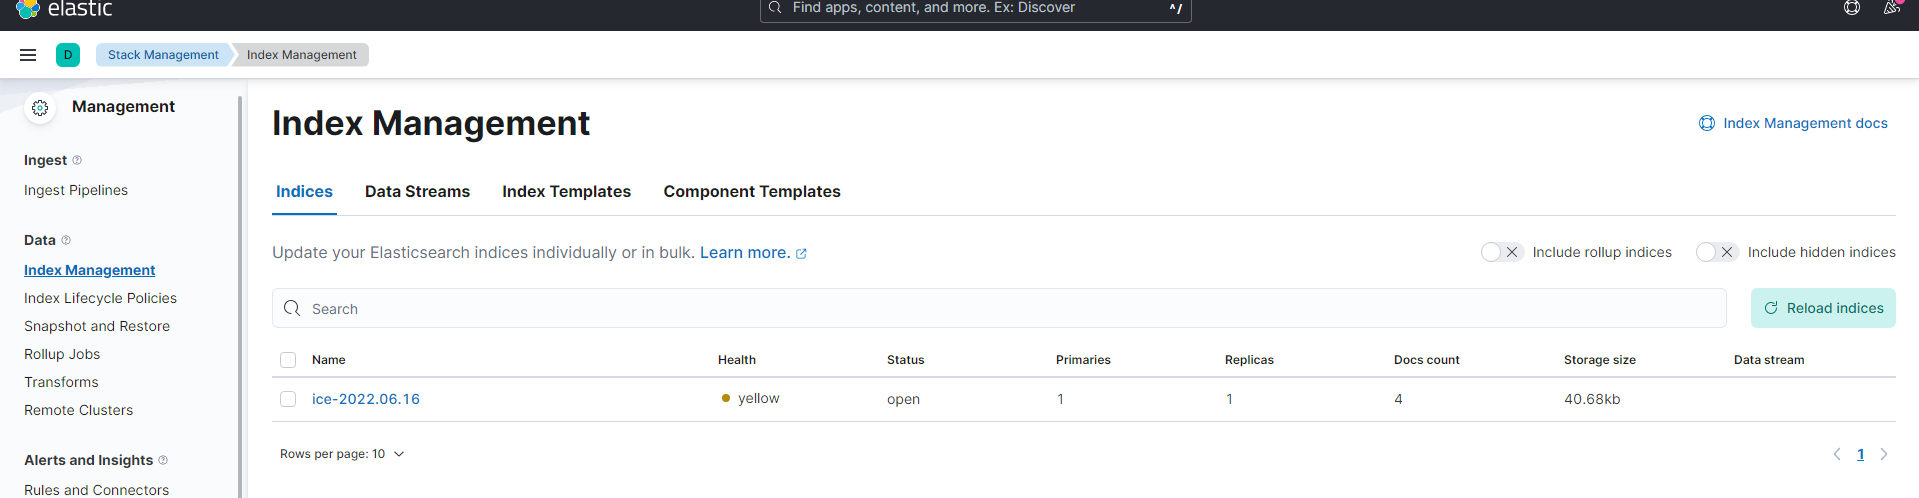
index => "ice-%{+YYYY.MM.dd}"
}
} else if [filetype] == "log_eureka-server" {
elasticsearch {
hosts => ["192.168.168.102:9200"]
index => "eureka-server-%{+YYYY.MM.dd}"
}
}else if [filetype] == "log_es" {
elasticsearch {
hosts => ["192.168.168.102:9200"]
index => "es-%{+YYYY.MM.dd}"
}
}else if [filetype] == "log_logstash" {
elasticsearch {
hosts => ["192.168.168.102:9200"]
index => "logstash-%{+YYYY.MM.dd}"
}
}
}
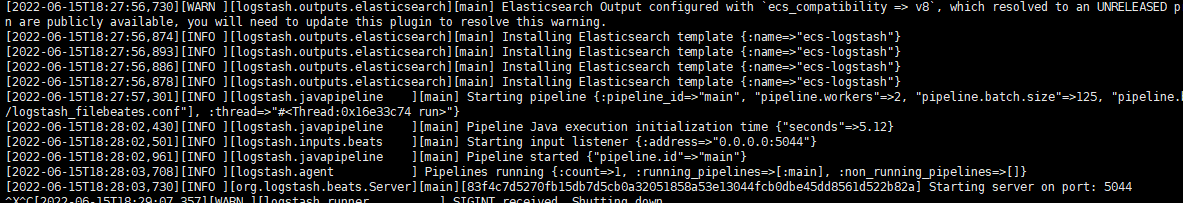
如果是linux进⾏后台启动则需要执⾏ nohup bin/logstash -f config/logstash_filebeates.conf &
关闭Logstash 服务,则需要先去查询 Logstash 的Pid。
命令是: ps -ef |grep logstash 获取到运⾏的logstash 的Pid 。例如Pid为1218。通过使⽤kill -9 1218 进⾏关闭服务。
七、slave2部署kibana
[root@slave2 opt]# tar -zxvf kibana-8.2.2-linux-x86_64.tar.gz

访问http://192.168.168.102:5601/
八、slave1部署filebeat
[root@slave1 opt]# tar -zxvf filebeat-8.2.2-linux-x86_64.tar.gz
[root@slave1 opt]# mv filebeat-8.2.2-linux-x86_64 /usr/local/filebeat-8.2.2
[root@slave1 opt]# cd /usr/local/filebeat-8.2.2/
vim filebeat_slave1.yml
#新增一个字段'filetype'(自定义的)来做区分,输出到5044端口,由logstash消费:
filebeat.inputs:

 浙公网安备 33010602011771号