JVM学习--开启应用的gc日志功能
一、开启方法
For Java 1.4, 5, 6, 7, 8 pass this JVM argument to your application: -XX:+PrintGCDetails -XX:+PrintGCDateStamps -Xloggc:<file-path>
For Java 9, pass the JVM argument: -Xlog:gc*:file=<file-path>
file-path: is the location where GC log file will be written
如果是需要给运行中的JVM打开日志功能,可参考:
http://www.importnew.com/15722.html
二、测试
代码:
public class testAllocation {
    private static final int _1MB=1024*1024;

    public static void main(String[] args) {
        byte[] allocation1;
        byte[] allocation2;
        byte[] allocation3;
        byte[] allocation4;
        allocation1=new byte[2*_1MB];
        allocation2=new byte[2*_1MB];
        allocation3=new byte[2*_1MB];
        allocation4=new byte[4*_1MB]; //出现一次Minor GC
    }
}
1、输出到标准输出
E:\javabase\out\production\javabase>java -XX:+PrintGCDetails -XX:+PrintGCDateSta
mps  -Xms20M -Xmx20M -Xmn10M testAllocation
Heap
 PSYoungGen      total 9216K, used 7644K [0x00000000ff600000, 0x0000000100000000
, 0x0000000100000000)
  eden space 8192K, 93% used [0x00000000ff600000,0x00000000ffd77070,0x00000000ff
e00000)
  from space 1024K, 0% used [0x00000000fff00000,0x00000000fff00000,0x00000001000
00000)
  to   space 1024K, 0% used [0x00000000ffe00000,0x00000000ffe00000,0x00000000fff
00000)
 ParOldGen       total 10240K, used 4096K [0x00000000fec00000, 0x00000000ff60000
0, 0x00000000ff600000)
  object space 10240K, 40% used [0x00000000fec00000,0x00000000ff000010,0x0000000
0ff600000)
 Metaspace       used 2521K, capacity 4486K, committed 4864K, reserved 1056768K
  class space    used 271K, capacity 386K, committed 512K, reserved 1048576K
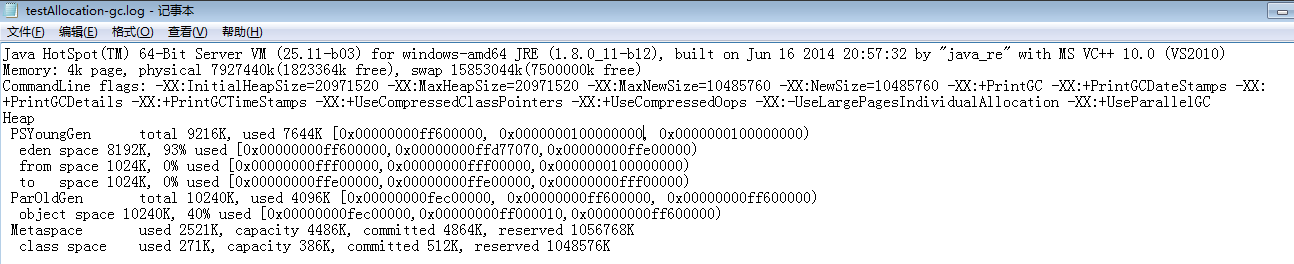
2、输出到文件
E:\javabase\out\production\javabase>java -XX:+PrintGCDetails -XX:+PrintGCDateSta
mps -Xloggc:testAllocation-gc.log -Xms20M -Xmx20M -Xmn10M testAllocation

 浙公网安备 33010602011771号