
springboot和ELK搭建配置详情
环境准备centos7,jdk8
一、ELK 是什么?
ELK 是三个开源框架的简写,分别是:Elasticsearch、Logstash、Kibana 。
Logstash:日志收集工具,可以从本地磁盘,网络服务(自己监听端口,接受用户日志),消息队列中收集各种各样的日志,然后进行过滤分析,并将日志输出到Elasticsearch中。
Elasticsearch:日志分布式存储/搜索工具,原生支持集群功能,可以将指定时间的日志生成一个索引,加快日志查询和访问。
Kibana:可视化日志Web展示工具,对Elasticsearch中存储的日志进行展示,还可以生成炫丽的仪表盘。
二、安装部署 Elasticsearch
1、下载
官网下载地址:https://www.elastic.co/cn/downloads/elasticsearch
国内镜像源(华为):https://mirrors.huaweicloud.com/elasticsearch/
推荐使用国内的下载地址,官网下载太慢了。
选择合适的版本下载(推荐下载自带 JDK 的版本,否者自己配置的 JDK 可能不符合版本要求。注意:Elasticsearch 会优先使用系统配置的 JDK 。可将 Elasticsearch 自带的 JDK 配置到系统的环境变量中,如果不这样做的话,在安装 Logstash 时,启动会报没有配置 JDK 环境变量的错误。)
[root@localhost ~]# wget https://mirrors.huaweicloud.com/elasticsearch/7.8.0/elasticsearch-7.8.0-linux-x86_64.tar.gz
2、解压到指定目录
# 新建文件夹
[root@localhost ~]# mkdir /usr/local/elasticsearch

# 解压到指定文件夹
[root@localhost ~]# tar -zxvf elasticsearch-7.8.0-linux-x86_64.tar.gz -C /usr/local/elasticsearch/
3、修改配置文件
# 进入安装目录
[root@localhost ~]# cd /usr/local/elasticsearch/elasticsearch-7.8.0/

# 修改config/elasticsearch.yml
[root@localhost elasticsearch-7.8.0]# vim ./config/elasticsearch.yml
# 修改以下几项:
node.name: node-1 # 设置节点名
network.host: 0.0.0.0 # 允许外部 ip 访问
cluster.initial_master_nodes: ["node-1"] # 设置集群初始主节点
4、新建用户并赋权
ES为了安全考虑不允许使用root用户启动ElasticSearch,所以需要新建一个普通用户启动程序。
# 添加用户 es
[root@localhost elasticsearch-7.8.0]# adduser es

# 设置用户 es 的密码(需要输入两遍密码)
# (如果设置密码过于简单可能会提示 BAD PASSWORD: XXX ,如果是用 root 用户操作可忽略提示继续输入第二遍密码强制设置密码)
[root@localhost elasticsearch-7.8.0]# passwd es
Changing password for user es.
New password:
BAD PASSWORD: The password is shorter than 8 characters
Retype new password:
passwd: all authentication tokens updated successfully.

# 将对应的文件夹权限赋予用户 es
[root@localhost elasticsearch-7.8.0]# chown -R es /usr/local/elasticsearch
5、切换至新建的用户并启动 Elasticsearch
# 切换至用户 es
[root@localhost elasticsearch-7.8.0]# su es

# 启动 ElasticSearch (-d 表示在后台启动)
[es@localhost elasticsearch-7.8.0]$ ./bin/elasticsearch -d
错误处理
启动之后可能会报以下三个错误:
ERROR: [3] bootstrap checks failed
[1]: max file descriptors [4096] for elasticsearch process is too low, increase to at least [65535]
[2]: max number of threads [3795] for user [es] is too low, increase to at least [4096]
[3]: max virtual memory areas vm.max_map_count [65530] is too low, increase to at least [262144]
解决方式:
需切换到root用户解决错误:
# 切换到 root 用户
[es@localhost elasticsearch-7.8.0]$ su root
[1] 和 [2] 的解决方法:
# 修改 /etc/security/limits.conf 文件
[root@localhost elasticsearch-7.8.0]# vim /etc/security/limits.conf
# 添加以下四行
* soft nofile 65536
* hard nofile 131072
* soft nproc 2048
* hard nproc 4096
[3] 的解决方法:
# 修改 /etc/sysctl.conf 文件
[root@localhost elasticsearch-7.8.0]# vim /etc/sysctl.conf
# 添加下面一行
vm.max_map_count=655360

# 执行命令
[root@localhost elasticsearch-7.8.0]# sysctl -p
切换到用户 es 重新启动程序就可以了。
6、验证
注意: 防火墙需要开放9200端口
[root@localhost elasticsearch-7.8.0]# firewall-cmd --permanent --add-port=9200/tcp
success
[root@localhost elasticsearch-7.8.0]# firewall-cmd --permanent --add-port=9200/udp
success
[root@localhost elasticsearch-7.8.0]# firewall-cmd --reload
success
启动没有报错成功后,在浏览器输入ip:9200端口如:http://192.168.110.200:9200,显示下图所示为启动成功
{
  "name" : "node-1",
  "cluster_name" : "elasticsearch",
  "cluster_uuid" : "ZjEM0gywRRaoko1fJ2bJIA",
  "version" : {
    "number" : "7.8.0",
    "build_flavor" : "default",
    "build_type" : "tar",
    "build_hash" : "757314695644ea9a1dc2fecd26d1a43856725e65",
    "build_date" : "2020-06-14T19:35:50.234439Z",
    "build_snapshot" : false,
    "lucene_version" : "8.5.1",
    "minimum_wire_compatibility_version" : "6.8.0",
    "minimum_index_compatibility_version" : "6.0.0-beta1"
  },
  "tagline" : "You Know, for Search"
}
三、安装部署 Kibana
1、下载
华为镜像源:https://mirrors.huaweicloud.com/kibana
选择合适的版本下载(和Elasticsearch版本保持一致)。
[root@localhost ~]# wget https://mirrors.huaweicloud.com/kibana/7.8.0/kibana-7.8.0-linux-x86_64.tar.gz
2、解压并移动到指定目录
# 解压到当前目录
[root@localhost ~]# tar -zxvf kibana-7.8.0-linux-x86_64.tar.gz

# 重命名并移动到指定目录
[root@localhost ~]# mv ./kibana-7.8.0-linux-x86_64 /usr/local/kibana-7.8.0
3、修改配置文件
[root@localhost kibana-7.8.0]# vim ./config/kibana.yml

# 服务端口
server.port: 5601
# 服务器ip  本机
server.host: "0.0.0.0"
# Elasticsearch 服务地址
elasticsearch.hosts: ["http://localhost:9200"]
# 设置语言为中文
i18n.locale: "zh-CN"
4、授权并切换用户
给 es 用户授予 kibana 目录的权限。
# 授权
[root@localhost ~]# chown -R es /usr/local/kibana-7.8.0
# 切换用户
root@localhost ~]# su es
5、启动 Kibana
注意:启动 Kibana 之前需要先启动 Elasticsearch
需要先配置防火墙打开5601端口:
[root@localhost kibana-7.8.0]# firewall-cmd --permanent --add-port=5601/tcp
success
[root@localhost kibana-7.8.0]# firewall-cmd --permanent --add-port=5601/udp
success
[root@localhost kibana-7.8.0]# firewall-cmd --reload
success

# 前台启动方式
[es@localhost kibana-7.8.0]$ ./bin/kibana

# 后台启动方式
[es@localhost kibana-7.8.0]$ nohup ./bin/kibana &
如果需要用root用户启动,可以使用:nohup ./bin/kibana --allow-root &
6、在浏览器中访问 Kibana
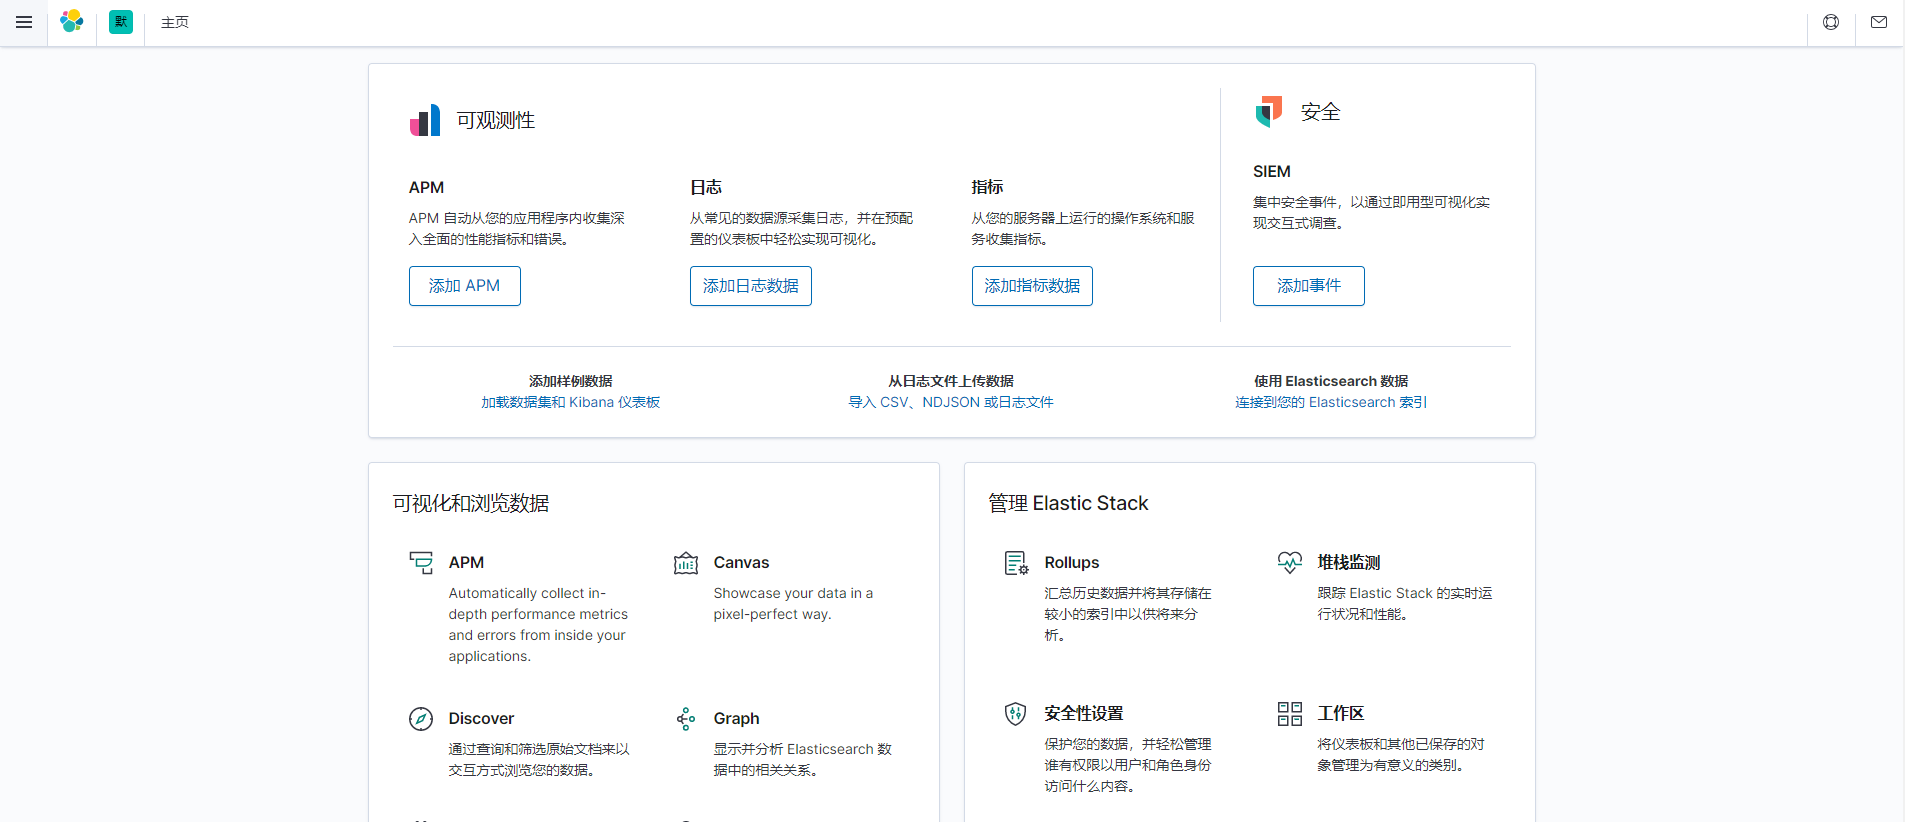
启动完成没有报错后,在浏览器输入IP:Ports如:http://192.168.110.200:5601/,出现如下界面
四、安装部署 Logstash
1、下载安装包
华为镜像源:https://mirrors.huaweicloud.com/logstash
选择合适版本的安装包(和 Elasticsearch 保持一致)。
[root@localhost ~]# wget https://mirrors.huaweicloud.com/logstash/7.8.0/logstash-7.8.0.tar.gz
2、解压并移动到指定目录
# 解压安装包
[root@localhost ~]# tar -zxvf logstash-7.8.0.tar.gz

# 移动到指定目录
[root@localhost ~]# mv ./logstash-7.8.0 /usr/local/logstash-7.8.0
3、新建配置文件
根据原有的 logstash-sample.conf 配置文件复制出一个新的配置文件并修改。
[root@localhost logstash-7.8.0]# cp config/logstash-sample.conf config/logstash-es.conf

# 修改配置文件logstash-es.conf
[root@localhost logstash-7.8.0]# vim config/logstash-es.conf
配置文件详细入门参考传送门:https://www.cnblogs.com/moonlightL/p/7760512.html
input {
 # 我们创建了两个微服务demo 所以建立两个不同的输入,将两个服务的日志分别输入到不同的索引中
  tcp {
    mode => "server"
    host => "0.0.0.0"   # 允许任意主机发送日志
    type => "elk1"      # 设定type以区分每个输入源
    port => 9601        # 监听的端口
    codec => json_lines # 数据格式
  }
  tcp {
    mode => "server"
    host => "0.0.0.0"
    type => "elk2"
    port => 9602
    codec => json_lines
  }

}
filter {
  #Only matched data are send to output.
}
output {
  # For detail config for elasticsearch as output,
  # See: https://www.elastic.co/guide/en/logstash/current/plugins-outputs-elasticsearch.html

  if [type] == "elk1" {
    elasticsearch {
      action => "index"          # 输出时创建映射
      hosts  => "192.168.110.200:9200"   # ElasticSearch 的地址和端口
      index  => "elk1"           # 指定索引名
      codec  => "json"
     }
  }
  if [type] == "elk2" {
    elasticsearch {
      action => "index"        #The operation on ES
      hosts  => "192.168.110.200:9200"   #ElasticSearch host, can be array.
      index  => "elk2"         #The index to write data to.
      codec  => "json"
     }
  }
}
注意要根据配置的端口,打开对应的防火墙:
[root@localhost logstash-7.8.0]# firewall-cmd --permanent --add-port=9601/tcp
success
[root@localhost logstash-7.8.0]# firewall-cmd --permanent --add-port=9601/udp
success
[root@localhost logstash-7.8.0]# firewall-cmd --permanent --add-port=9602/tcp
success
[root@localhost logstash-7.8.0]# firewall-cmd --permanent --add-port=9602/udp
success
[root@localhost logstash-7.8.0]# firewall-cmd --reload
success
4、安装插件
由于国内无法访问默认的gem source,需要将gem source改为国内的源。
# 修改Gemfile
[root@localhost logstash-7.8.0]# vim Gemfile
# 将source这一行改成如下所示:
source "https://gems.ruby-china.com"
然后执行安装:
[root@localhost logstash-7.8.0]# ./bin/logstash-plugin install logstash-codec-json_lines
如果报以下错误,请检查是否已经配置了 JDK 环境变量。
could not find java; set JAVA_HOME or ensure java is in PATH
5、启动 Logstash
# 后台启动Logstash
[root@localhost logstash-7.8.0]# nohup ./bin/logstash -f ./config/logstash-es.conf --config.reload.automatic &
如果不需要自动检查配置修改,可以使用下面命令启动:
[root@localhost logstash-7.8.0]# nohup ./bin/logstash -f ./config/logstash-es.conf &
五、配置项目查看结果
本示例使用的是 Spring Boot 项目。
1、引入依赖
        <dependency>
            <groupId>net.logstash.logback</groupId>
            <artifactId>logstash-logback-encoder</artifactId>
            <version>5.2</version>
        </dependency>
2、在resources里新建 logback.xml 配置文件
<?xml version="1.0" encoding="UTF-8"?>
<!DOCTYPE configuration>
<configuration>
    <appender name="LOGSTASH" class="net.logstash.logback.appender.LogstashTcpSocketAppender">
        <!--指定logstash ip:监听端口-->
        <destination>192.168.40.149:9601</destination>
        <encoder charset="UTF-8" class="net.logstash.logback.encoder.LogstashEncoder" />
    </appender>

    <!--引用springboot默认配置-->
    <include resource="org/springframework/boot/logging/logback/base.xml"/>

    <root level="INFO">
        <!--使用上述订阅logstash数据tcp传输 -->
        <appender-ref ref="LOGSTASH" />
        <!--使用springboot默认配置 调试窗口输出-->
        <appender-ref ref="CONSOLE" />
    </root>

</configuration>
3、启动系统打印日志
启动类:
@SpringBootApplication
@RestController
public class TestspringbootApplication implements CommandLineRunner {

    public static void main(String[] args) {
        SpringApplication.run(TestspringbootApplication.class, args);
    }

    @Override
    public void run(String... args) {
        Logger logger = LoggerFactory.getLogger(TestspringbootApplication.class);
        logger.info("测试log345345345345354");

        for (int i = 0; i < 5; i++) {
            logger.error("something wrong. id={}; name=Ryan-{};", i, i);
        }
    }
}
启动,打印日志:
2021-07-26 10:40:30.066  INFO 7044 --- [           main] c.e.t.TestspringbootApplication          : No active profile set, falling back to default profiles: default
2021-07-26 10:40:32.215  INFO 7044 --- [           main] o.s.b.w.embedded.tomcat.TomcatWebServer  : Tomcat initialized with port(s): 8012 (http)
2021-07-26 10:40:34.352  INFO 7044 --- [           main] o.apache.catalina.core.StandardService   : Starting service [Tomcat]
2021-07-26 10:40:37.315  INFO 7044 --- [           main] org.apache.catalina.core.StandardEngine  : Starting Servlet engine: [Apache Tomcat/9.0.46]
2021-07-26 10:40:38.292  INFO 7044 --- [           main] o.a.c.c.C.[Tomcat].[localhost].[/]       : Initializing Spring embedded WebApplicationContext
2021-07-26 10:40:38.293  INFO 7044 --- [           main] w.s.c.ServletWebServerApplicationContext : Root WebApplicationContext: initialization completed in 6683 ms
2021-07-26 10:40:39.719  INFO 7044 --- [           main] o.s.s.concurrent.ThreadPoolTaskExecutor  : Initializing ExecutorService 'applicationTaskExecutor'
2021-07-26 10:40:40.620  INFO 7044 --- [           main] o.s.b.w.embedded.tomcat.TomcatWebServer  : Tomcat started on port(s): 8012 (http) with context path ''
2021-07-26 10:40:51.601  INFO 7044 --- [           main] c.e.t.TestspringbootApplication          : Started TestspringbootApplication in 37.395 seconds (JVM running for 37.87)
2021-07-26 10:40:53.103  INFO 7044 --- [           main] c.e.t.TestspringbootApplication          : 测试log345345345345354
2021-07-26 10:41:02.712 ERROR 7044 --- [           main] c.e.t.TestspringbootApplication          : something wrong. id=0; name=Ryan-0;
2021-07-26 10:41:03.328 ERROR 7044 --- [           main] c.e.t.TestspringbootApplication          : something wrong. id=1; name=Ryan-1;
2021-07-26 10:41:03.752 ERROR 7044 --- [           main] c.e.t.TestspringbootApplication          : something wrong. id=2; name=Ryan-2;
2021-07-26 10:41:09.616 ERROR 7044 --- [           main] c.e.t.TestspringbootApplication          : something wrong. id=3; name=Ryan-3;
2021-07-26 10:41:10.175 ERROR 7044 --- [           main] c.e.t.TestspringbootApplication          : something wrong. id=4; name=Ryan-4;
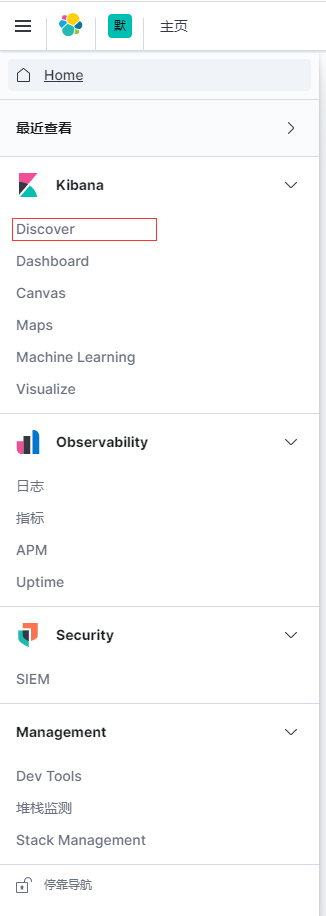
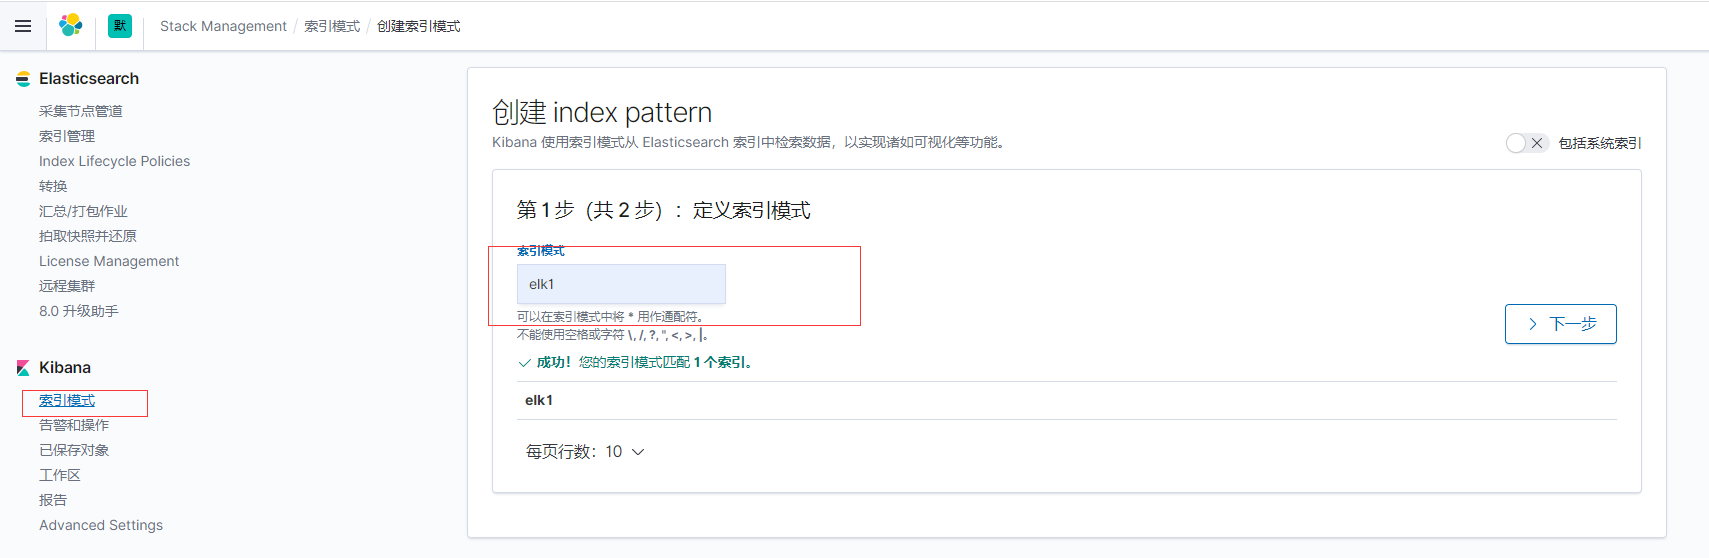
Kibana还需要配置日志读取的索引:
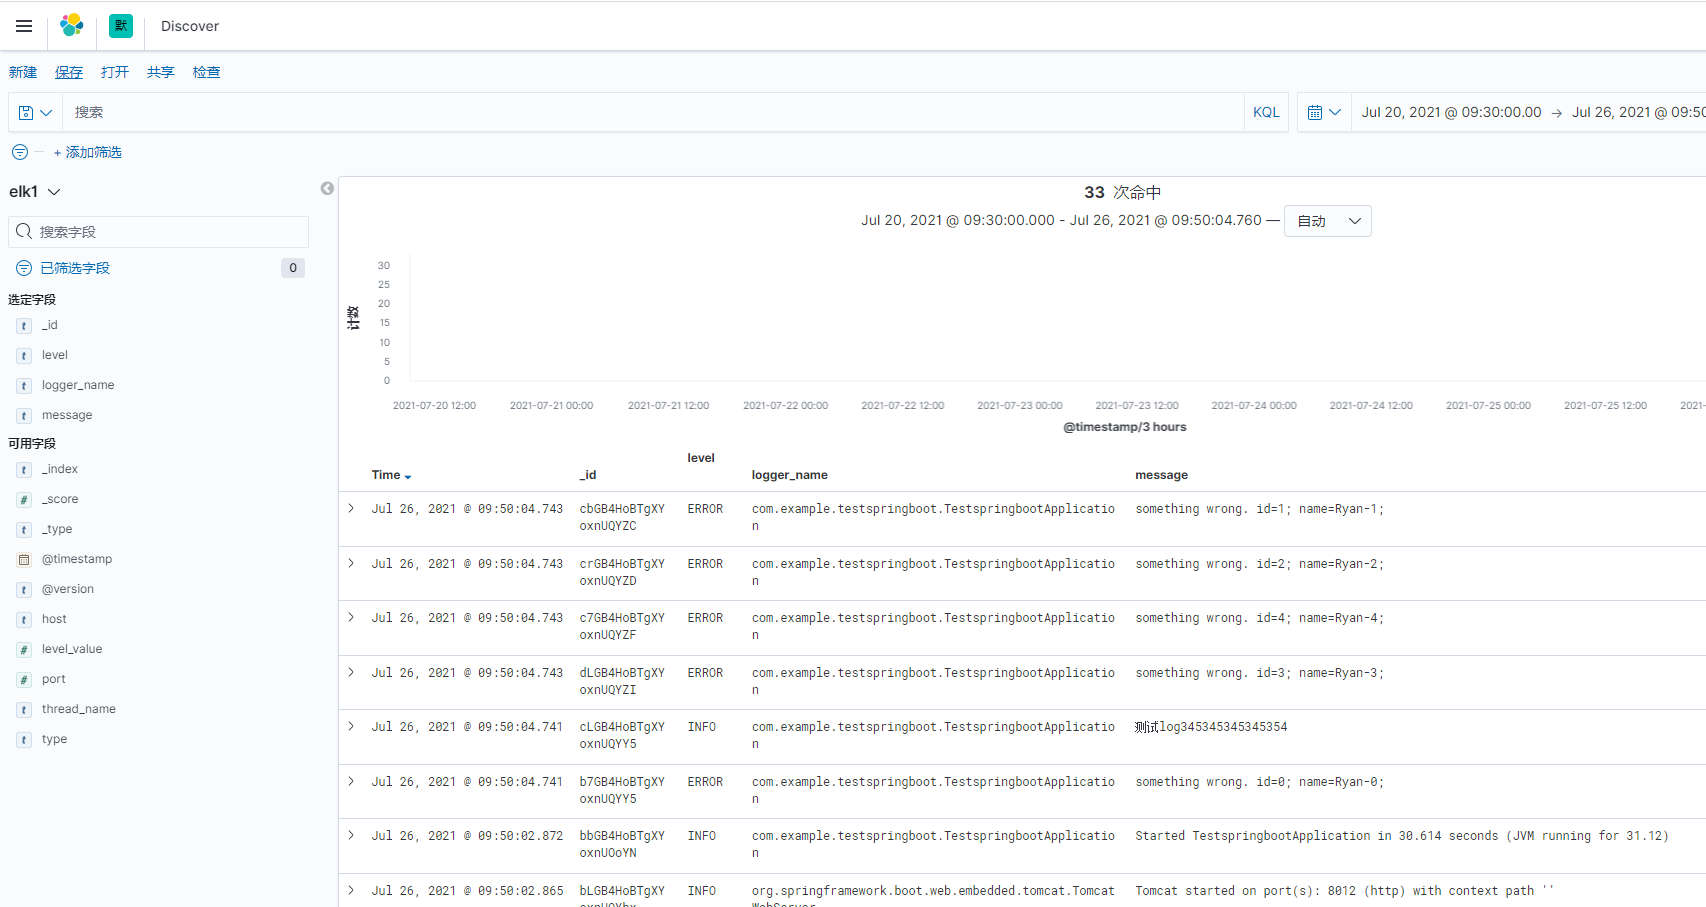
然后再次打开Discover,配置显示列,显示如下
参考:
https://blog.csdn.net/sinat_27245917/article/details/108123826
https://blog.csdn.net/weixin_43184769/article/details/84971532

 浙公网安备 33010602011771号