
Rdlc 动态加载xml 实现图表宽度(高度)自适应
微软提供的Rdlc 报表为我们提供的很大的便利,功能强大,使用简单。但在使用过程中总是有那么点美中不足:图表大小是固定的,不能根据内容自适应大小。这就造成了如下情况,看图说话:

数据少时图表比较稀疏

数据多时图表很挤
这对于我们追求完美的程序员来说是不能接收的,坚决要改造。
思路:
Rdlc 是基于xml的,我们可以通过动态修改rdlc的xml数据,来更改rdlc 定义的图表大小。
宽度的计算:类别总数*序列数*(条形单位宽度+类别间隔)
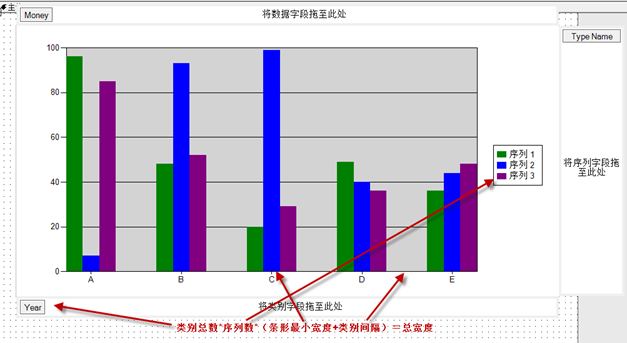
宽度计算根据图表的类型不同计算公式也不同,上述公式只适合 "简单柱形图""简单条形图",其它类型的图表以后解决。
Rdlc报表xml解析:
这里我们只需要动态改变 图表的宽度和高度,需要知道如下几个节点:
<Chart Name="chart1"> 中间数据省略 </Chart> xpath 路径为: Report/Body/ ReportItems/ Chart
Chart的类型Type节点: <Chart> <Type>Column</Type> </Chart> 其中 Type为Column 代表 简单柱形图 ,Type 为 Bar 代表 简单条形图
Chart的宽度 Width 节点: <Chart> <Width>23cm</Width> </Chart>
Chart的 高度Height 节点: <Chart> <Height>11.5cm</Height> </Chart>
部分代码:
public class RdlcReportHelper
{
private XmlDocument _rdlcDoc;
private XmlNode _root;
private string _chartName;
private double _perWidth = 0.15; //厘米
private XPathDocument xpathdoc;
private XPathNavigator xnv;
private XmlNamespaceManager xnm;
private string[] _chartType = new string[] { "Bar", "Column" };
public RdlcReportHelper(string path)
{
//加载xml
_rdlcDoc = new XmlDocument();
_rdlcDoc.Load(path);
_root = _rdlcDoc.LastChild;
xnm = new XmlNamespaceManager(_rdlcDoc.NameTable);
xnm.AddNamespace("rd", "http://schemas.microsoft.com/SQLServer/reporting/reportdesigner");
xnm.AddNamespace("default", "http://schemas.microsoft.com/sqlserver/reporting/2005/01/reportdefinition");
xnm.PushScope();
xpathdoc = new XPathDocument(path);
xnv = xpathdoc.CreateNavigator();
}
/// <summary>
/// 转换xml
/// </summary>
/// <returns></returns>
public MemoryStream AutoSizeReport()
{
…………
XmlNode ChartNode = _root.SelectSingleNode("//default:Body/default:ReportItems/default:Chart[@Name='" + _chartName + "']", xnm); //查找 Chart 节点
XmlNode ChartTypeNode = ChartNode.SelectSingleNode("default:Type", xnm); //查找图表类型节点
if (w != 0)
{
if (ChartTypeNode.InnerText == "Bar")
{
XmlNode heightNode = ChartNode.SelectSingleNode("default:Height", xnm); //设置 高度
heightNode.InnerText = w + "cm";
}
else if (ChartTypeNode.InnerText == "Column")
{
XmlNode widthNode = ChartNode.SelectSingleNode("default:Width", xnm); //设置宽度
widthNode.InnerText = w + "cm";
}
}
}
}
如何使用:
使用设计器设计好报表,设置要自动伸展的图表名称,类别字段、序列字段、值字段和单位宽度。
RdlcReportHelper reporthelper = new RdlcReportHelper(Server.MapPath("ReportTest.rdlc"));
reporthelper.AutoChartName = "chart1"; //设置自动伸展图表名称
reporthelper.DataSource = dt; //设置绑数据源
reporthelper.TypeField = "Year"; //设置类别字段
reporthelper.SeriesField = "TypeName"; //设置序列字段
reporthelper.ValueField = "Money"; //设置值字段
reporthelper.PerWidth = 0.15; //第个条形的最小宽度 默认0.15
this.ReportViewer1.LocalReport.LoadReportDefinition(reporthelper.AutoSizeReport());
//this.ReportViewer1.LocalReport.ReportPath = Server.MapPath("ReportTest.rdlc");
this.ReportViewer1.LocalReport.DataSources.Add(new ReportDataSource("DataSet1_DataTable1", dt));
this.ReportViewer1.LocalReport.Refresh();
最终效果如下:
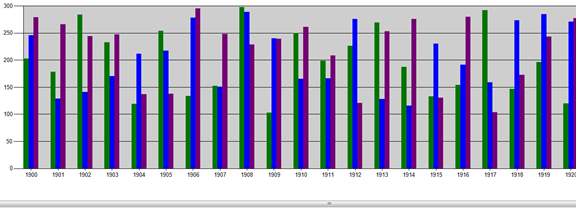
再多的数据也能自动伸展
文笔有限,描述不清,大家下载代码看吧。

