echarts使用记录:Echarts的legend改变图例图标为自定义图片、tooltip如何加百分号
一、Echarts的legend改变图例图标为自定义图片
当折线图时,legend默认时rect形式,如果需要改图例形状,可以自己设置legend的icon属性
legend: {
    icon:'stack'
},
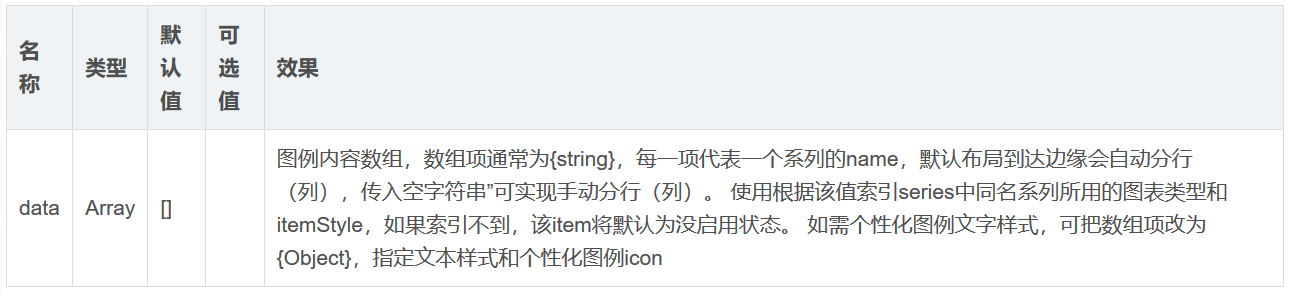
1、自定义每个图例样式:为data的每个对象修改icon属性
legend:{
    show:true,
    orient:'horizontal',
    borderColor:'#df3434',
    borderWidth:2,
    data:[
        {
            name:'蒸发量',
            textStyle:{
                fontSize:12,
                fontWeight:'bolder',
                color:'#cccccc'
            },
            icon:'stack'
        },
        {
            name:'降水量',
            textStyle:{
                fontSize:12,
                fontWeight:'bolder',
                color:'#df3434'
            },
            icon:'pie'
        }
    ]
}
![]()
2、修改图例的图标为自定义图片
首先我找了如下两张图片放在根目录下的images文件夹下

legend:{
    show:true,
    orient:'horizontal',
    borderColor:'#df3434',
    borderWidth:2,
    data:[
        {
            name:'蒸发量',
            textStyle:{
                fontSize:12,
                fontWeight:'bolder',
                color:'#cccccc'
            },
            icon:'image://./images/icon1.png'//格式为'image://+icon文件地址',其中image::后的//不能省略
        },
        {
            name:'降水量',
            textStyle:{
                fontSize:12,
                fontWeight:'bolder',
                icon:'image://./images/icon2.png'//格式为'image://+icon文件地址',其中image::后的//不能省略
            },
            icon:'pie'
        }
    ]
}
![]()
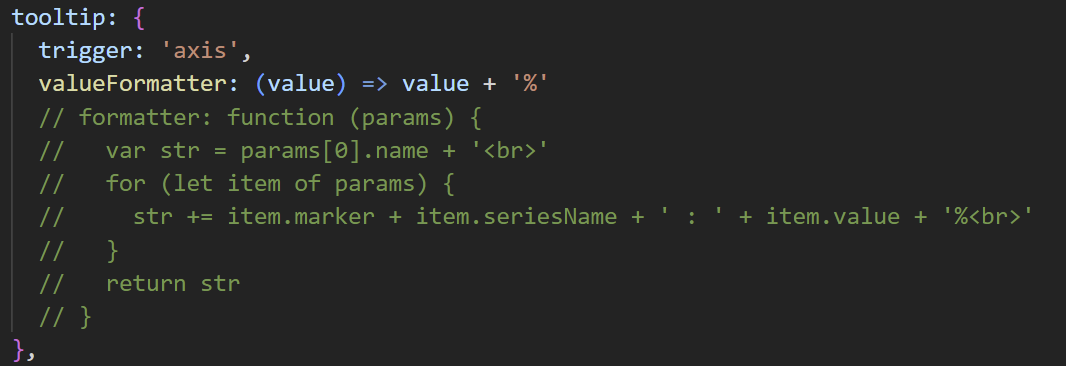
二、tooltip如何加百分号
1、使用 valueFormatter,如图
2、使用 formatter 方法,可见这篇文章:echarts的tooltip显示百分号 加 % 的几种方式 - https://blog.csdn.net/zxh7770/article/details/124971493
tooltip: {
  trigger: 'axis',
  formatter: function (params) {
    var str = params[0].name + '<br>'
    for (let item of params) {
      str += item.marker + item.seriesName + ' : ' + item.value + '%<br>'
    }
    return str
  }
},
params 主要内容为


 浙公网安备 33010602011771号