

vue+leaflet示例:结合Echarts4实现统计图效果(附源码下载)
demo源码运行环境以及配置
- 运行环境:依赖Node安装环境,demo本地Node版本:14.19.1。
- 运行工具:vscode或者其他工具。
- 配置方式:下载demo源码,vscode打开,然后顺序执行以下命令:
(1)下载demo环境依赖包命令:npm i
(2)启动demo命令:npm run dev
(3)打包demo命令: npm run build:release
示例效果
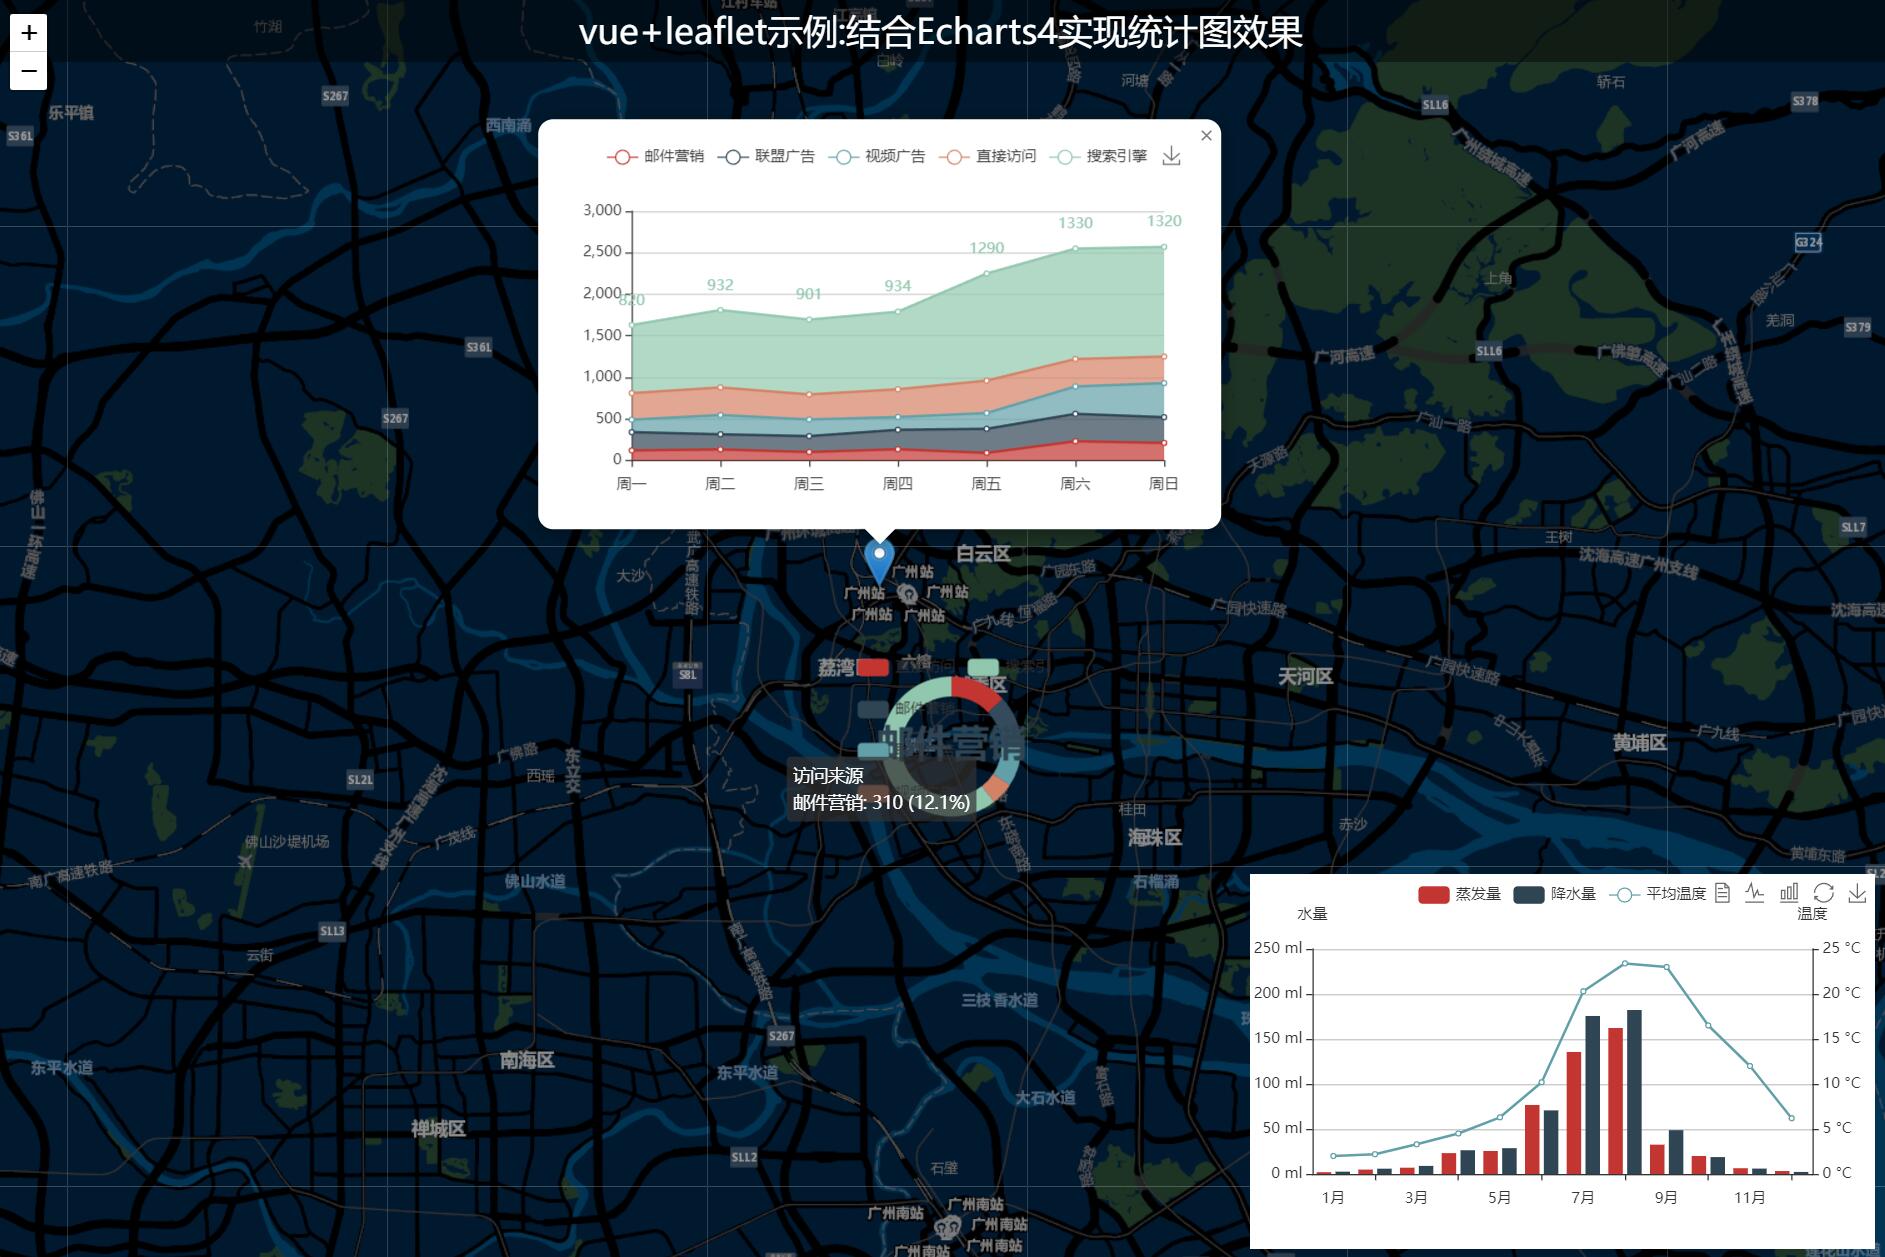
本文 leaflet 结合 Echarts4 实现三种形式统计图:
- Leaflet Popup
- Leaflet Control
- Leaflet Marker
- 核心源码
<template>
  <div id="map"></div>
  <div class="titleContainer center">
    <span>vue+leaflet示例:结合Echarts4实现统计图效果</span>
  </div>
</template>

<script setup>
import { onMounted, reactive, ref } from "vue";
import L from "leaflet";
import { useRouter } from "vue-router";
const router = useRouter();
let map = null;
onMounted(() => {
  initMap();
});
const initMap = () => {
  // 创建地图对象
  map = L.map("map", {
    attributionControl: false,
  }).setView([23.111233437208057, 113.27007293701172], 13);
  //创建底图数据源
  L.tileLayer(
    "http://map.geoq.cn/ArcGIS/rest/services/ChinaOnlineStreetPurplishBlue/MapServer/tile/{z}/{y}/{x}"
  ).addTo(map);
  //添加地图控件control形式加载统计图
  initControl_Chart(map);
  //Marker形式叠加统计图
  initControl_Marker(map);
  //Popup点击弹窗形式加载统计图
  initControl_Popup(map);
};
const initControl_Marker = (map) => {
  L.marker([23.11, 113.27], {
    icon: L.divIcon({
      className: "leaflet-echart-icon",
      iconSize: [160, 160],
      html: '<div id="cMark" style="width:160px;height:160px;position:relative;background-color:transparent;"></div>',
    }),
  }).addTo(map);

  const ChartMarker = echarts.init(document.getElementById("cMark"));
  const option = {
    tooltip: {
      trigger: "item",
      formatter: "{a} <br/>{b}: {c} ({d}%)",
    },
    legend: {
      orient: "vertical",
      x: "left",
      data: ["直接访问", "邮件营销", "联盟广告", "视频广告", "搜索引擎"],
    },
    series: [
      {
        name: "访问来源",
        type: "pie",
        radius: ["50%", "70%"],
        avoidLabelOverlap: false,
        label: {
          normal: {
            show: false,
            position: "center",
          },
          emphasis: {
            show: true,
            textStyle: {
              fontSize: "30",
              fontWeight: "bold",
            },
          },
        },
        labelLine: {
          normal: {
            show: false,
          },
        },
        data: [
          { value: 335, name: "直接访问" },
          { value: 310, name: "邮件营销" },
          { value: 234, name: "联盟广告" },
          { value: 135, name: "视频广告" },
          { value: 1548, name: "搜索引擎" },
        ],
      },
    ],
  };
  ChartMarker.setOption(option);
};
……
</script>

<style scoped>
#map {
  width: 100vw;
  height: 100vh;
}
.titleContainer {
  position: absolute;
  top: 0;
  background: rgba(0, 0, 0, 0.45);
  height: 50px;
  width: 100vw;
  z-index: 999;
  font-size: 14px;
  color: #fff;
  font-size: 28px;
}
.center {
  display: flex;
  flex-direction: column;
  align-items: center;
  justify-content: center;
}
</style>
下载源码:GIS之家的学习交流圈
GIS之家作品店铺:GIS之家作品店铺
GIS之家源码咨询:GIS之家webgis入门开发系列demo源代码咨询
扫码关注GIS之家微信公众号,回复“gis”可免费获取地图数据以及arcgis系列安装包等资源
GIS之家源码咨询:GIS之家webgis入门开发系列demo源代码咨询
扫码关注GIS之家微信公众号,回复“gis”可免费获取地图数据以及arcgis系列安装包等资源

 浙公网安备 33010602011771号