

<template>
<view>
<view>
<view id="main">
<!-- 第一步 设置盒子大小 -->
</view>
</view>
<view>
<view v-for="(item,index) in 10">
<view style="display: flex;justify-content: space-between;">
<text style="font-size: 36rpx;margin-left: 30rpx;" >2020-12-17</text>
<text style="font-size: 36rpx;margin-right: 30rpx;">10064</text>
</view>
</view>
</view>
</view>
</template>
<script>
import echarts from 'echarts'
export default {
data() {
return {
}
},
methods: {},
mounted() {
let myChart = echarts.init(document.getElementById("main"));
let option = {
xAxis: {
type: 'category',
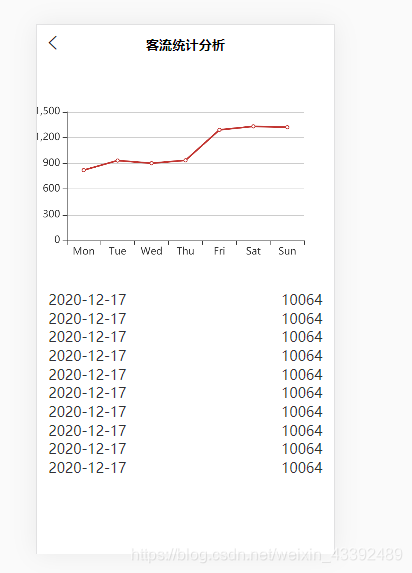
data: ['Mon', 'Tue', 'Wed', 'Thu', 'Fri', 'Sat', 'Sun']
},
yAxis: {
type: 'value'
},
series: [{
data: [820, 932, 901, 934, 1290, 1330, 1320],
type: 'line'
}]
};
myChart.setOption(option);
}
}
</script>
<style>
@import url("../analysis/analysis.css");
.analysis_view_row{
display: flex;
justify-content: space-between;
}
</style>
运行结果

 浙公网安备 33010602011771号