

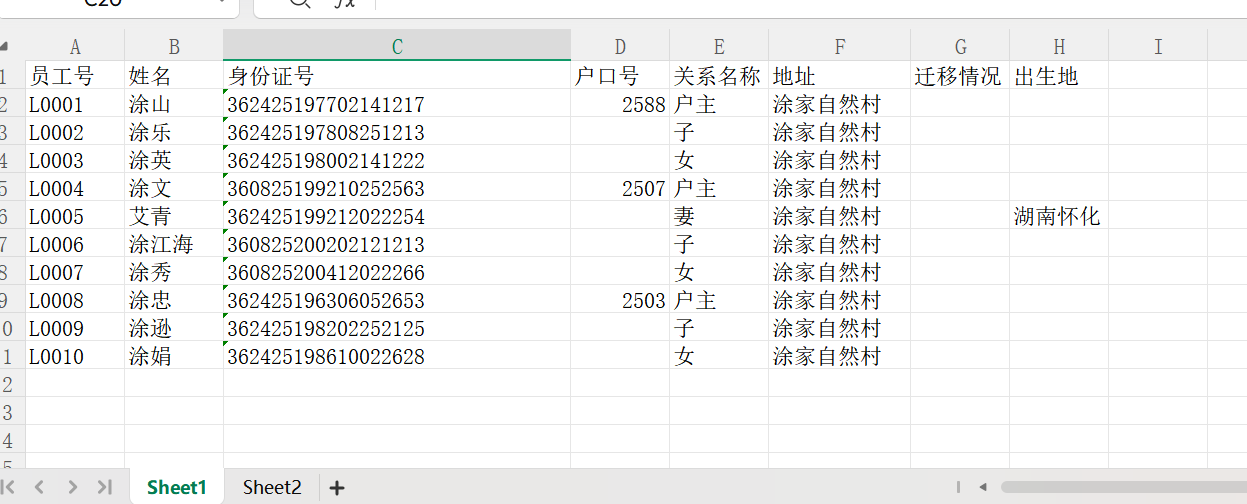
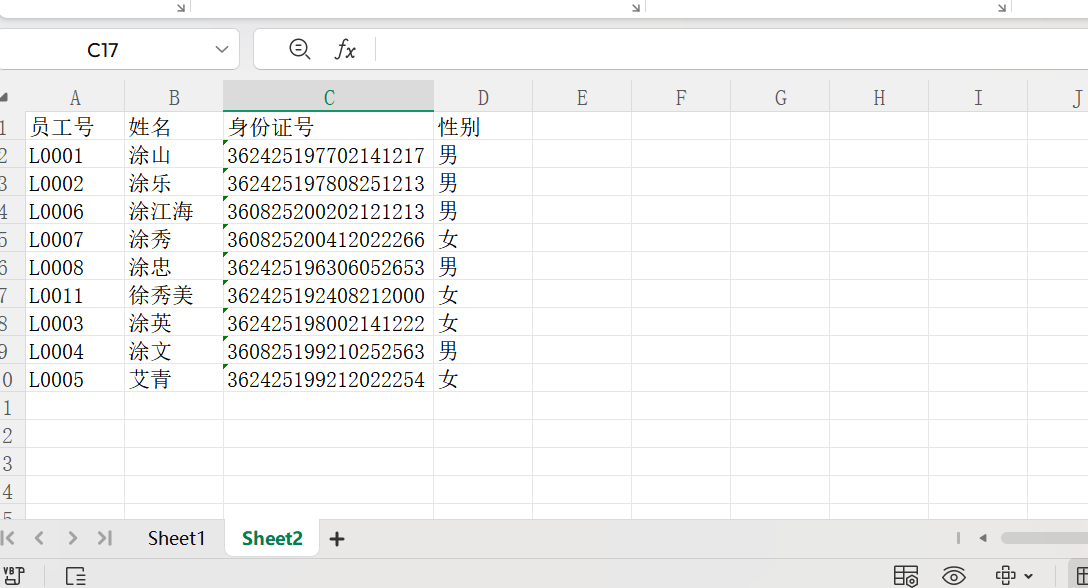
python: excel 两个工作表中的员工比对
工作表:
检测系统中的英文字体:
import matplotlib.font_manager as fm

# 列出系统中所有支持中文的字体
fonts = fm.findSystemFonts(fontpaths=None, fontext='ttf')
chinese_fonts = []
for font in fonts:
    try:
        font_prop = fm.FontProperties(fname=font)
        font_name = font_prop.get_name()
        # 筛选中文字体(包含常见中文字体关键词)
        if any(key in font.lower() for key in ['hei', 'song', 'kai', 'yahei', 'ming', 'li']):
            chinese_fonts.append((font_name, font))
    except:
        continue

# 打印可用中文字体
print("系统可用中文字体列表:")
for name, path in chinese_fonts[:10]:  # 只显示前10个
    print(f"字体名称:{name},路径:{path}")
# encoding: utf-8
# 版权所有 2026 ©涂聚文有限公司™ ®
# 许可信息查看:言語成了邀功盡責的功臣,還需要行爲每日來值班嗎
# 描述:python.exe -m pip install --upgrade pip -i https://pypi.tuna.tsinghua.edu.cn/simple
# Author : geovindu,Geovin Du 涂聚文.
# IDE : PyCharm 2024.3.6 python 3.11
# os : windows 10
# database : mysql 9.0 sql server 2019, postgreSQL 17.0 Oracle 21c Neo4j
# Datetime : 2026/1/21 21:25
# User : geovindu pip install pandas -i https://pypi.tuna.tsinghua.edu.cn/simple pip install matplotlib -i https://pypi.tuna.tsinghua.edu.cn/simple pip3 install numpy -i https://pypi.tuna.tsinghua.edu.cn/simple
# Product : PyCharm
# Project : PyExceport
# File : Main.py
'''
pip install openpyxl -i https://pypi.tuna.tsinghua.edu.cn/simple
pip install xlwt -i https://pypi.tuna.tsinghua.edu.cn/simple
python.exe -m pip install --upgrade pip -i https://pypi.tuna.tsinghua.edu.cn/simple
pip install openpyxl -i https://pypi.tuna.tsinghua.edu.cn/simple
pip install matplotlib -i https://pypi.tuna.tsinghua.edu.cn/simple
pip install pandas -i https://pypi.tuna.tsinghua.edu.cn/simple
pip install xlwt -i https://pypi.tuna.tsinghua.edu.cn/simple
pip install xlsxwriter -i https://pypi.tuna.tsinghua.edu.cn/simple
pip install ttkbootstrap -i https://pypi.tuna.tsinghua.edu.cn/simple
'''
import pandas as pd
import matplotlib.pyplot as plt
import matplotlib.font_manager as fm
import os
from typing import Dict
import warnings
warnings.filterwarnings('ignore')
# 修复中文字体问题(核心修改部分)
def setup_chinese_font():
"""
配置matplotlib中文字体
:return:
"""
try:
# 优先尝试微软雅黑(Windows默认)
plt.rcParams['font.sans-serif'] = ['Microsoft YaHei', 'SimHei', 'DejaVu Sans']
plt.rcParams['axes.unicode_minus'] = False
plt.rcParams['font.family'] = 'sans-serif'
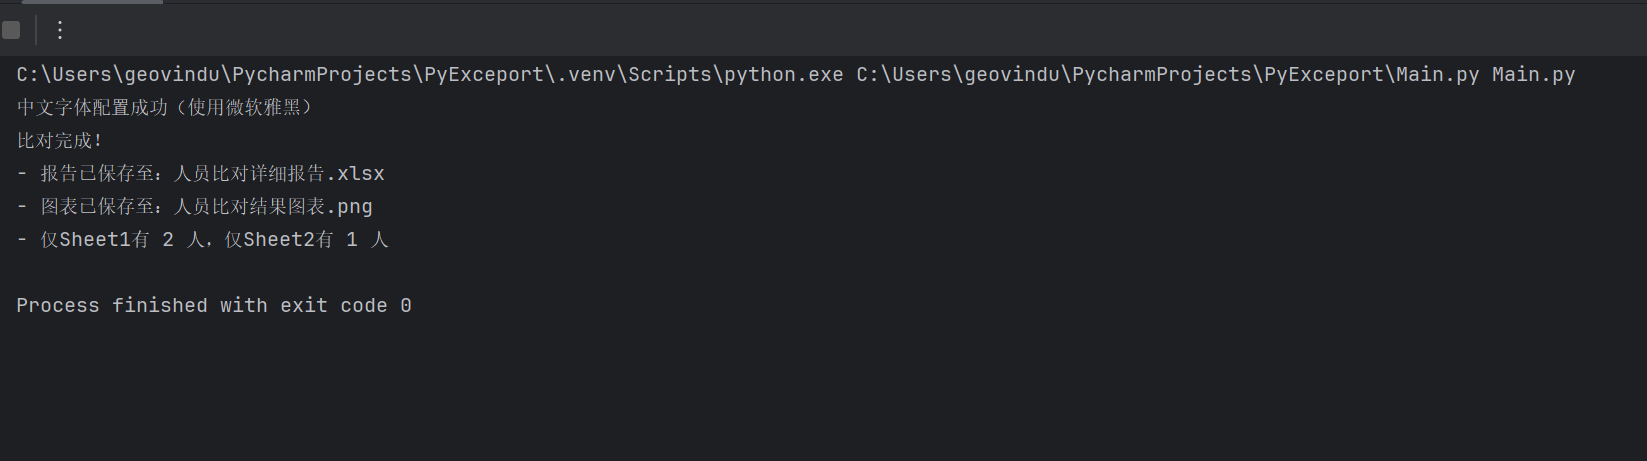
print("中文字体配置成功(使用微软雅黑)")
except:
# 备选方案:自动查找系统中文字体
font_paths = fm.findSystemFonts(fontext='ttf')
chinese_fonts = [f for f in font_paths if any(c in f.lower() for c in ['hei', 'yahei', 'song'])]
if chinese_fonts:
font_prop = fm.FontProperties(fname=chinese_fonts[0])
plt.rcParams['font.sans-serif'] = [font_prop.get_name(), 'DejaVu Sans']
plt.rcParams['axes.unicode_minus'] = False
print(f"中文字体配置成功(使用系统字体:{font_prop.get_name()})")
else:
print("警告:未找到中文字体,图表中文可能显示异常")
# 初始化字体
setup_chinese_font()
def check_dependencies() -> bool:
"""
检查必要的依赖是否安装
:return:
"""
required_packages = ['openpyxl', 'matplotlib']
missing_packages = []
for pkg in required_packages:
try:
__import__(pkg)
except ImportError:
missing_packages.append(pkg)
if missing_packages:
print(f"错误:缺少必要的依赖包:{', '.join(missing_packages)}")
print(f"请执行安装命令:pip install {' '.join(missing_packages)}")
return False
return True
def compare_two_sheets(excel_path: str,sheet1_name: str = 'Sheet1',sheet2_name: str = 'Sheet2', key_column: str = '员工号', output_excel: str = '人员比对详细报告.xlsx', output_image: str = '人员比对结果图表.png') -> Dict:
"""
比对两个Excel工作表中的人员数据
:param excel_path: Excel文件路径
:param sheet1_name: 第一个工作表名称
:param sheet2_name: 第二个工作表名称
:param key_column: 用于比对的关键字段(如员工号、身份证号)
:param output_excel: 输出报告的Excel路径
:param output_image: 输出图表的路径
:return: 比对结果字典
"""
# 先检查依赖
if not check_dependencies():
raise ImportError("依赖检查失败,请先安装缺失的包")
# 检查文件是否存在
if not os.path.exists(excel_path):
raise FileNotFoundError(f"Excel文件不存在:{excel_path}")
try:
# 读取两个工作表
df1 = pd.read_excel(excel_path, sheet_name=sheet1_name)
df2 = pd.read_excel(excel_path, sheet_name=sheet2_name)
# 检查关键字段是否存在
if key_column not in df1.columns:
raise ValueError(f"Sheet1中缺少关键字段:{key_column}")
if key_column not in df2.columns:
raise ValueError(f"Sheet2中缺少关键字段:{key_column}")
# 去除空值和重复值
df1_clean = df1.dropna(subset=[key_column]).drop_duplicates(subset=[key_column])
df2_clean = df2.dropna(subset=[key_column]).drop_duplicates(subset=[key_column])
# 获取两个表的关键字段集合
set1 = set(df1_clean[key_column].astype(str))
set2 = set(df2_clean[key_column].astype(str))
# 计算交集、差集
common = set1 & set2 # 两个表都有的
only_in_sheet1 = set1 - set2 # 仅Sheet1有的
only_in_sheet2 = set2 - set1 # 仅Sheet2有的
# 筛选对应的数据
df_common = df1_clean[df1_clean[key_column].astype(str).isin(common)]
df_only1 = df1_clean[df1_clean[key_column].astype(str).isin(only_in_sheet1)]
df_only2 = df2_clean[df2_clean[key_column].astype(str).isin(only_in_sheet2)]
# 生成统计结果
result = {
'total_sheet1': len(df1_clean),
'total_sheet2': len(df2_clean),
'common_count': len(common),
'only_sheet1_count': len(only_in_sheet1),
'only_sheet2_count': len(only_in_sheet2),
'common_data': df_common,
'only_sheet1_data': df_only1,
'only_sheet2_data': df_only2
}
# 生成Excel报告
with pd.ExcelWriter(output_excel, engine='openpyxl') as writer:
# 汇总表
summary_df = pd.DataFrame({
'项目': ['Sheet1总人数', 'Sheet2总人数', '两个表都有', '仅Sheet1有', '仅Sheet2有'],
'数量': [
result['total_sheet1'],
result['total_sheet2'],
result['common_count'],
result['only_sheet1_count'],
result['only_sheet2_count']
]
})
summary_df.to_excel(writer, sheet_name='比对汇总', index=False)
# 各分类数据
df_only1.to_excel(writer, sheet_name='仅在Sheet1', index=False)
df_only2.to_excel(writer, sheet_name='仅在Sheet2', index=False)
df_common.to_excel(writer, sheet_name='两个表都有', index=False)
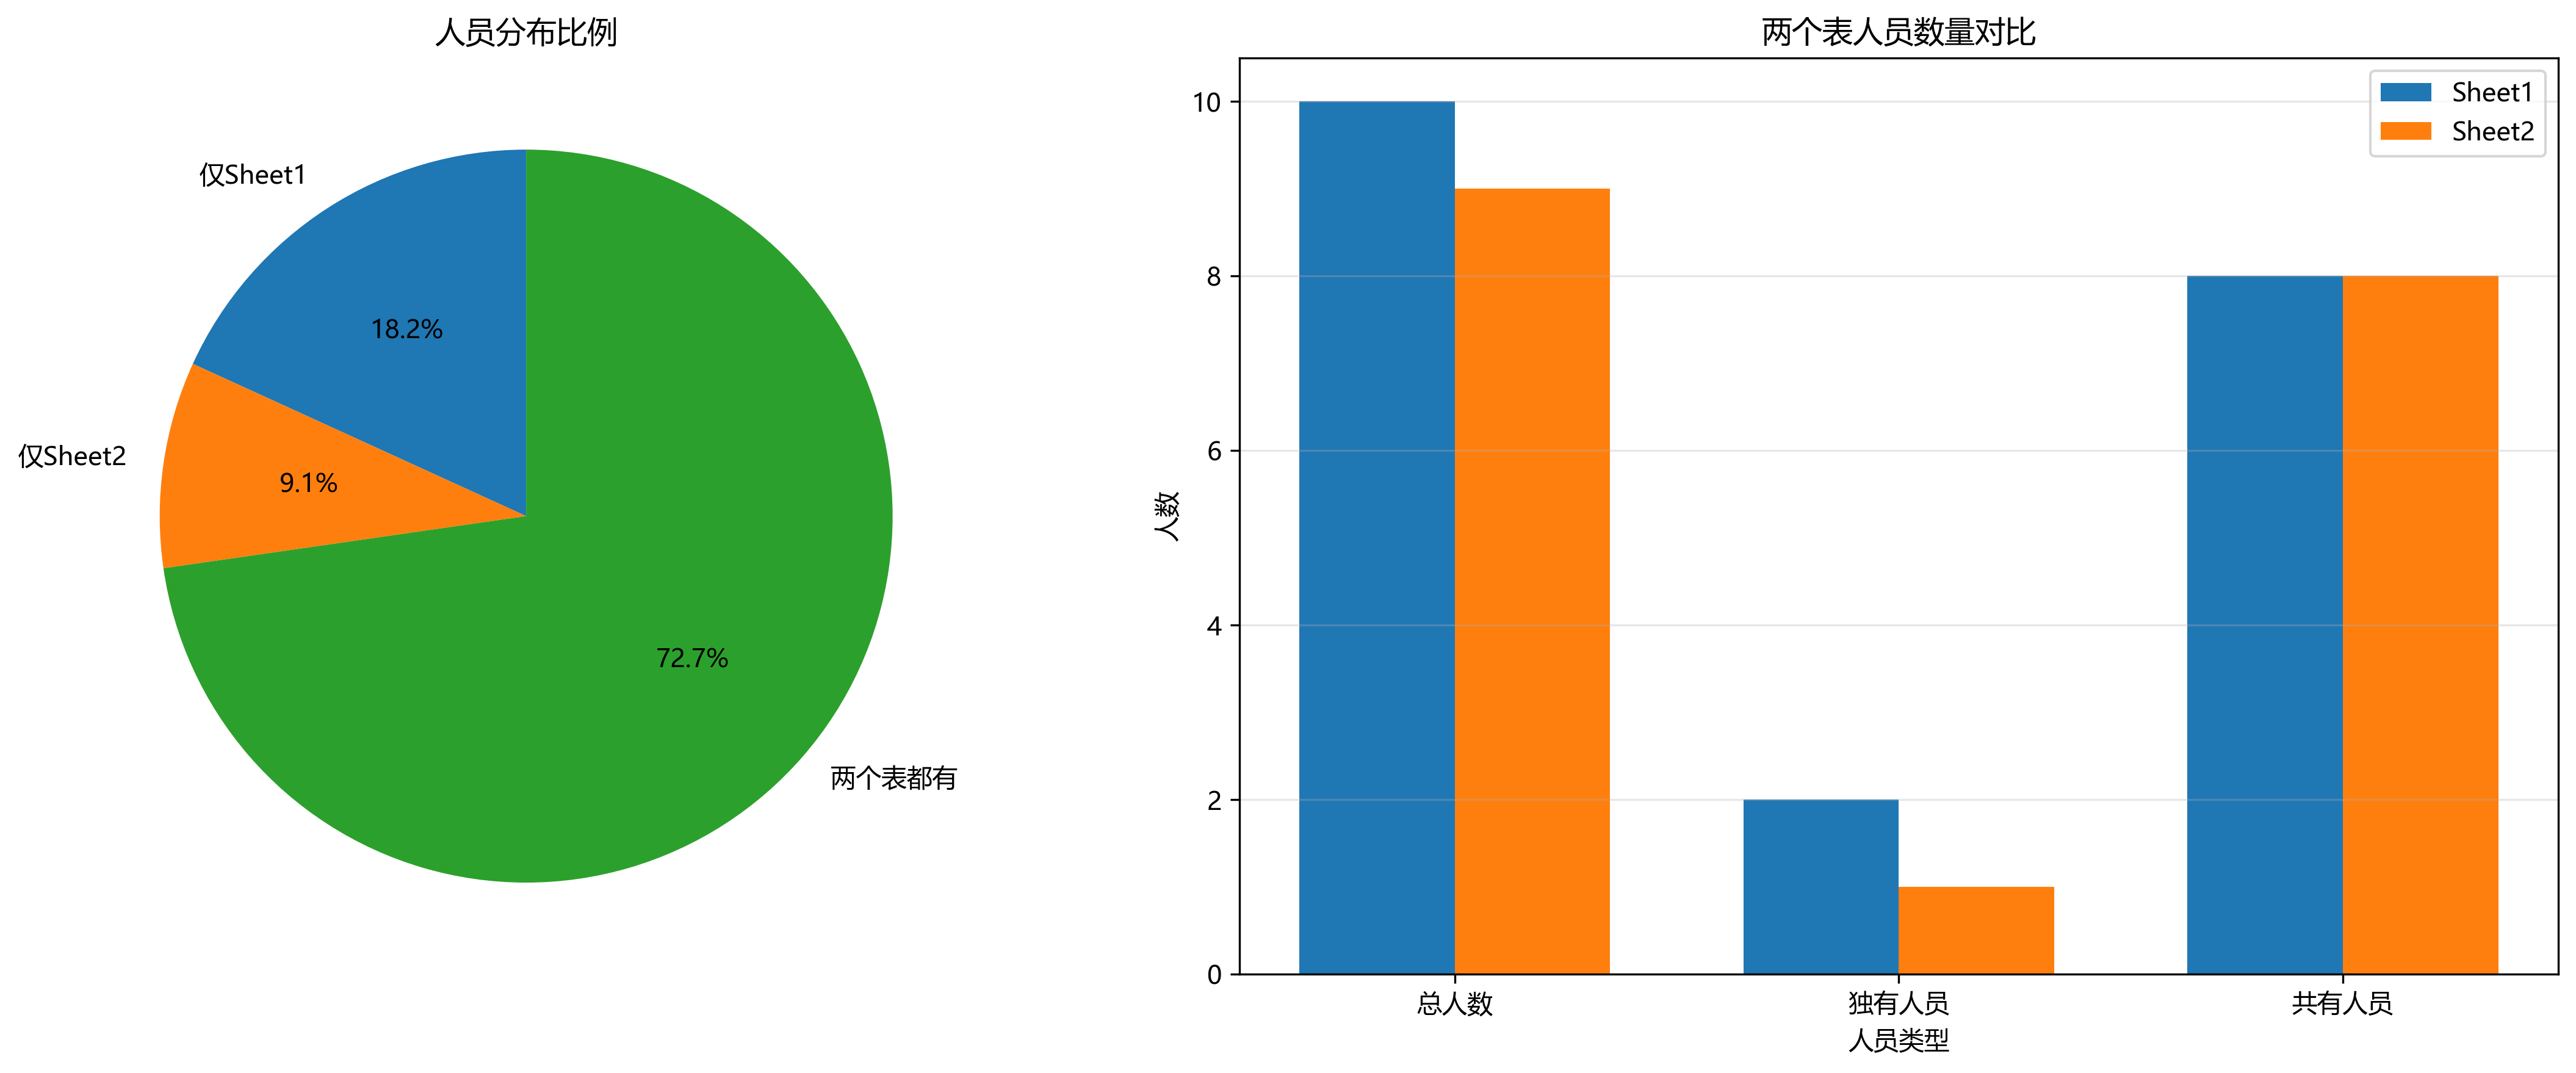
# 生成可视化图表
fig, (ax1, ax2) = plt.subplots(1, 2, figsize=(15, 6))
# 饼图:人员分布比例
pie_labels = ['仅Sheet1', '仅Sheet2', '两个表都有']
pie_sizes = [len(only_in_sheet1), len(only_in_sheet2), len(common)]
ax1.pie(pie_sizes, labels=pie_labels, autopct='%1.1f%%', startangle=90)
ax1.set_title('人员分布比例')
# 柱状图:数量对比
bar_x = ['总人数', '独有人员', '共有人员']
bar_sheet1 = [
result['total_sheet1'],
result['only_sheet1_count'],
result['common_count']
]
bar_sheet2 = [
result['total_sheet2'],
result['only_sheet2_count'],
result['common_count']
]
x = range(len(bar_x))
width = 0.35
ax2.bar([i - width / 2 for i in x], bar_sheet1, width, label='Sheet1')
ax2.bar([i + width / 2 for i in x], bar_sheet2, width, label='Sheet2')
ax2.set_xlabel('人员类型')
ax2.set_ylabel('人数')
ax2.set_title('两个表人员数量对比')
ax2.set_xticks(x)
ax2.set_xticklabels(bar_x)
ax2.legend()
ax2.grid(axis='y', alpha=0.3)
plt.tight_layout()
plt.savefig(output_image, dpi=300, bbox_inches='tight')
plt.close()
print(f"比对完成!")
print(f"- 报告已保存至:{output_excel}")
print(f"- 图表已保存至:{output_image}")
print(f"- 仅Sheet1有 {result['only_sheet1_count']} 人,仅Sheet2有 {result['only_sheet2_count']} 人")
return result
except Exception as e:
print(f"比对过程中出现错误: {str(e)}")
raise
# 调用示例
if __name__ == "__main__":
"""
主输出
"""
try:
result = compare_two_sheets(
excel_path='人员比对.xlsx', # 替换为你的Excel文件路径
sheet1_name='Sheet1',
sheet2_name='Sheet2',
key_column='员工号',
output_excel='人员比对详细报告.xlsx',
output_image='人员比对结果图表.png'
)
except Exception as e:
print(f"执行失败:{e}")
输出:
哲学管理(学)人生, 文学艺术生活, 自动(计算机学)物理(学)工作, 生物(学)化学逆境, 历史(学)测绘(学)时间, 经济(学)数学金钱(理财), 心理(学)医学情绪, 诗词美容情感, 美学建筑(学)家园, 解构建构(分析)整合学习, 智商情商(IQ、EQ)运筹(学)生存.---Geovin Du(涂聚文)

 浙公网安备 33010602011771号