

ArKTS: McPieChart

/**
 # encoding: utf-8
 # 版权所有  2025 ©涂聚文有限公司™ ®
 # 许可信息查看:言語成了邀功盡責的功臣,還需要行爲每日來值班嗎
 # 描述:   ohpm install @mcui/mccharts
 # Author    : geovindu,Geovin Du 涂聚文.
 # IDE       : DevEco Studio 5.1.1  HarmonyOS ArKTS
 # os        : windows 10
 # database  : mysql 9.0 sql server 2019, postgreSQL 17.0  Oracle 21c Neo4j
 # Datetime  : 2025/8/5 20:19
 # User      :  geovindu
 # Product   : DevEco Studio
 # Project   : sqliteAppHelper
 # File      : WeightPage.ets
 **/

import { WeightBody } from '../../Model/WeightBody';
import { router } from '@kit.ArkUI'

@Entry
@Component
struct WeightPage {
  @State message: string = '体重检测';
  @State weightbody:WeightBody=new WeightBody();
  @State bodyweight:number=0;
  @State bodyheight:number=0;


  build() {
    Column() {
      Row()
      {
        Text('身高')
          .fontSize(20)
          .fontColor(Color.Red)
          .fontWeight(FontWeight.Bold)
          .fontFamily('Arial')
        TextInput({ placeholder: '请输入身高M',  text: ''})
          .onChange((value) => {
            if(value!='')
              this.bodyheight = Number(value)
          })
      }
      Row(){
        Text('体重')
          .fontSize(20)
          .fontColor(Color.Red)
          .fontWeight(FontWeight.Bold)
          .fontFamily('Arial')
        TextInput({ placeholder: '请输入体重KG',  text: ''})
          .onChange((value) => {
            if(value!='')
              this.bodyweight = Number(value)
          })
      }
      Row() {
        Button() {
          Text('提交')
            .fontSize(20)
            .fontColor(Color.Red)
            .fontWeight(FontWeight.Bold)
            .fontFamily('Arial')
            .onClick(() => {
              this.weightbody.BodyHeight=this.bodyheight;
              this.weightbody.BodyWeight=this.bodyweight;
              this.weightbody.BMI=this.bodyweight/Math.pow(this.bodyheight,2);
              router.push({
                url: 'pages/mychart/PideChartWeightPage',
                params: {
                  weightInfo: this.weightbody  //传值
                }
              })
            })
        }
        Button('返回')
          .onClick(() => {
            router.push({
              url: 'pages/mychart/ChartsIndexPage'
            })
          })
      }

    }
    .height('100%')
    .width('100%')
  }
}
/*
# encoding: utf-8
# 版权所有 2025 ©涂聚文有限公司™ ®
# 许可信息查看:言語成了邀功盡責的功臣,還需要行爲每日來值班嗎
# 描述:
# Author : geovindu,Geovin Du 涂聚文.
# IDE : DevEco Studio 5.1.1 HarmonyOS ArKTS
# os : windows 10
# database : mysql 9.0 sql server 2019, postgreSQL 17.0 Oracle 21c Neo4j
# Datetime : 2025/8/6 20:55
# User : geovindu
# Product : DevEco Studio
# Project : sqliteHelper
# File : PideChartWeightPage.ets
*/
import promptAction from '@ohos.promptAction'
import { router } from '@kit.ArkUI';
import { Options,McPieChart,chartInterface } from '@mcui/mccharts'
import { WeightBody } from '../../Model/WeightBody'
// 2. 定义传递的参数类型(包含user属性)
interface WeightParams {
weightInfo: WeightBody;
}
@Entry
@Component
struct PideChartHeartPage {
@State message: string = '';
@State conclusion: string = '';
@State bodyweight:number=0;
@State bodyheight:number=0;
@State bodysata:number=0;
@State weights: WeightBody = new WeightBody();
@State seriesOption: Options = new Options(
{
color: ['#ff848684', 18.5>=this.bodysata && this.bodysata<=23.5 ?
'#ff05ef2a' : '#ffff0026'
],
//设置图例的相关样式与功能
legend: {
top: '5%', //图例距离顶部侧位置
itemWidth: 10, //图形的宽度
itemHeight: 10, //图形的高度
textStyle: {
//文本样式配置
color: '#ff00b4ff', //字体颜色
fontSize: 50, //字体大小
fontWeight: '800' //字体粗细
}
},
title: {
show: true,
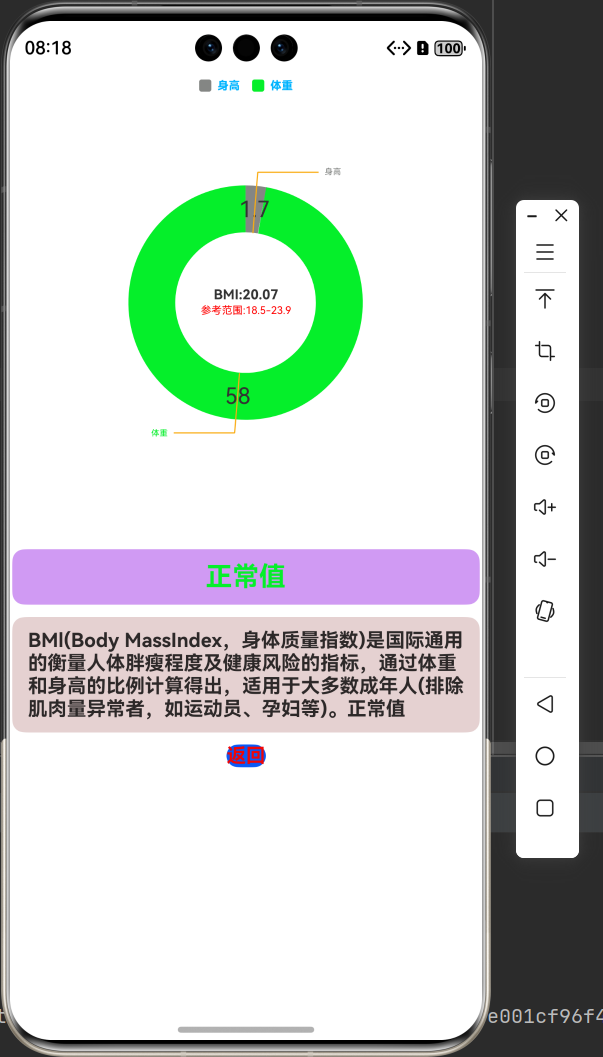
text: `BMI:${this.bodysata}`, // 主标题文本
subtext: '参考范围:18.5-23.9', // 副标题文本
top: '50%',
},
series: [
{
radius: ['50%', '30%'], // 饼图外半径、内半径
//center: ['50%', '30%'], // 饼图中心位置
labelLine: {
//文本连接线样式配置
length: 50, //连接线1的长度
length2: 50, //连接线2的长度
lineStyle: {
//提示线样式
width: 1, //线宽度
color: '#FAAD14' //线颜色
}
},
label: {
//系列文本标签样式配置
show: true, //是否显示文本标签
fontWeight: '800', //字体粗细
fontFamily: 'sans-serif',
color: '#333', //字体颜色
position: 'outside', //文本显示位置
fontSize: 60, //字体大小
distanceToLabelLine: 6 //字体与饼状间距
},
data: [
{
name: '身高',
value: this.bodyheight
},
{
name: '体重',
value: this.bodyweight
}
]
}
],
}
)
/**
* 显示内容
*/
async displayContent() {
//BMI
this.bodysata = Number((this.bodyweight / Math.pow(this.bodyheight, 2)).toFixed(2));
if (this.bodysata < 18.5) {
this.message = 'BMl(Body MassIndex,身体质量指数)是国际通用的衡量人体胖瘦程度及健康风险的指标,通过体重和身高的比例计算得出,适用于大多数成年人(排除肌肉量异常者,如运动员、孕妇等)。消瘦';
this.conclusion = '消瘦';
promptAction.showToast({ message: '消瘦' })
} else this.bodysata <= 24) {
this.message = 'BMl(Body MassIndex,身体质量指数)是国际通用的衡量人体胖瘦程度及健康风险的指标,通过体重和身高的比例计算得出,适用于大多数成年人(排除肌肉量异常者,如运动员、孕妇等)。正常值';
this.conclusion = "正常值";
promptAction.showToast({ message: '正常值' })
} else {
this.message = 'BMl(Body MassIndex,身体质量指数)是国际通用的衡量人体胖瘦程度及健康风险的指标,通过体重和身高的比例计算得出,适用于大多数成年人(排除肌肉量异常者,如运动员、孕妇等)。超重';
this.conclusion = "超重";
promptAction.showToast({ message: '超重' })
}
}
// 关键修复:用@Builder装饰器定义UI构建方法
@Builder
customTooltip(tooltipInfo: chartInterface.InterfaceObj) {
Column() { // 建议包裹一个容器组件,方便布局
if (tooltipInfo.title) {
Text(tooltipInfo.title)
.fontSize(16)
.fontWeight(FontWeight.Bold)
}
ForEach(tooltipInfo.data, (item: chartInterface.InterfaceObj) => {
Text(`${item.name}:${item.num}`)
.fontSize(14)
})
}
.padding(10)
.backgroundColor('#ffffff')
.borderRadius(5)
.shadow({ radius: 3 })
}
aboutToAppear(): void {
const params = router.getParams() as WeightParams | undefined;
if (params?.weightInfo) {
this.weights = params.weightInfo as WeightBody;
this.bodyweight = this.weights.BodyWeight;
this.bodyheight = this.weights.BodyHeight;
this.bodysata = this.weights.BMI;
}
this.displayContent();
setTimeout(() => {
this.seriesOption.setVal({
color: ['#ff848684', 18.5>=this.bodysata && this.bodysata<=23.5 ?
'#ffff0026' : '#ff05ef2a'
],
//设置图例的相关样式与功能
legend: {
top: '5%', //图例距离顶部侧位置
itemWidth: 10, //图形的宽度
itemHeight: 10, //图形的高度
textStyle: {
//文本样式配置
color: '#ff00b4ff', //字体颜色
fontSize: 30, //字体大小
fontWeight: '800' //字体粗细
}
},
title: {
show: true,
text: `BMI:${this.bodysata}`, // 主标题文本
subtext: '参考范围:18.5-23.9', // 副标题文本
top: '50%',
},
series: [
{
radius: ['50%', '30%'],
labelLine: {
//文本连接线样式配置
length: 50, //连接线1的长度
length2: 50, //连接线2的长度
lineStyle: {
//提示线样式
width: 1, //线宽度
color: '#FAAD14' //线颜色
}
},
label: {
//系列文本标签样式配置
show: true, //是否显示文本标签
fontWeight: '800', //字体粗细
fontFamily: 'sans-serif',
color: '#333', //字体颜色
position: 'outside', //文本显示位置
fontSize: 60, //字体大小
distanceToLabelLine: 6 //字体与饼状间距
},
data: [
{
name: '身高',
value: this.bodyheight
},
{
name: '体重',
value: this.bodyweight
}
]
}
]
})
}, 2000)
}
build() {
Column({space: 10}) {
Row() {
// 传入自定义tooltip构建器(根据mccharts的API调整属性名)
McPieChart({ options: this.seriesOption })
.width('100%')
.height('100%')
}
.height('50%')
.width('100%')
Row() {
Text(this.conclusion) //结论
.fontSize(22)
.fontWeight(FontWeight.Bold)
.fontColor(18.5 >= this.bodysata && this.bodysata <= 23.5 ? '#fff10505' : '#ff05ef2a')
.margin(10)
.align(Alignment.Center)
}
.textExtend('#ffd09af3')
Row() {
Text(this.message) //描述
.fontSize(16)
.fontWeight(FontWeight.Bold)
.margin(10)
.align(Alignment.Center)
}
.textExtend('#ffe5d1d1')
Row() {
Button() {
Text('返回')
.fontSize(16)
.fontWeight(FontWeight.Bold)
.fontColor('#fff10505')
.onClick(() => {
router.back()
})
}
}
}
.width('100%')
.height('100%')
}
}
/**
*
* @param color
*/
@Extend(Row)
function textExtend(color:string) {
.width('99%')
.justifyContent(FlexAlign.Center)
.borderRadius(10)
.backgroundColor(color)
}
第二种:
/*
# encoding: utf-8
# 版权所有  2025 ©涂聚文有限公司™ ®
# 许可信息查看:言語成了邀功盡責的功臣,還需要行爲每日來值班嗎
# 描述:  ohpm install @mcui/mccharts
# 收缩压(Systolic pressure) 舒张压(Diastolic pressure)
# https://developer.huawei.com/consumer/cn/forum/topic/0207179071718932445
# Author    : geovindu,Geovin Du 涂聚文.
# IDE       : DevEco Studio 5.1.1 HarmonyOS
# os        : windows 10
# database  : mysql 9.0 sql server 2019, postgreSQL 17.0  Oracle 21c Neo4j
# Datetime  : 2025/8/03 20:20
# User      :  geovindu
# Product   : DevEco Studio
# Project   : SQLiteApp
# File      : PideChartPage.ets
*/

import promptAction from '@ohos.promptAction'
import { router } from '@kit.ArkUI';
import { Options,McPieChart,chartInterface } from '@mcui/mccharts'
import { BloodPressure } from '../../Model/BloodPressure'
import { BoodStat } from "../../Common/BoodStat"

// 2. 定义传递的参数类型(包含user属性)
interface BloodParams {
  booldInfo: BloodPressure;
}

@Entry
@Component
struct PideChartPage {
  @State message: string = '';
  @State conclusion:string='';
  @State Systolic:number=108; //在大于120时,显示红色
  @State Diastolic:number=80;
  @State heartRate:number=80; //小于80时大于60时,显示绿色,80-120时,显示蓝色,大于80时小于60时,显示红色
  @State textColor:string = ''
  @State boolds:BloodPressure=new BloodPressure();
  @State seriesOption: Options = new Options(
    {
      color: ['#ff848684',BoodStat.getFontColor(this.Systolic)
         ],
      //设置图例的相关样式与功能
      legend: {
        top: '5%', //图例距离顶部侧位置
        itemWidth: 10, //图形的宽度
        itemHeight: 10, //图形的高度
        textStyle: {
          //文本样式配置
          color: '#ff00b4ff', //字体颜色
          fontSize: 30, //字体大小
          fontWeight: '800' //字体粗细
        }
      },
      title: {
        show: true,
        text: `${this.Systolic}次/分种`, // 主标题文本
        textStyle: {
          //主标题文本样式配置
          color: '#ff00b4ff', //字体颜色
          fontSize: 55, //字体大小
          fontWeight: '800' //字体粗细
        },
        subtext: '参考范围60-120', // 副标题文本
        subtextStyle: {
          //副标题文本样式配置
          color: '#ff00b4ff', //字体颜色
          fontSize: 35, //字体大小
          fontWeight: '800' //字体粗细
        },
        top: '50%',
      },
      series: [
        {
          radius: ['50%', '30%'],
          labelLine: { //文本连接线样式配置
            length: 10, //连接线1的长度
            length2: 10, //连接线2的长度
            lineStyle: { //提示线样式
              width: 1, //线宽度
              color: '#FAAD14' //线颜色
            }
          },
          label: { //系列文本标签样式配置
            show: true, //是否显示文本标签
            fontWeight: '800', //字体粗细
            fontFamily: 'sans-serif',
            color: '#333', //字体颜色
            position: 'outside', //文本显示位置
            fontSize: 60, //字体大小
            distanceToLabelLine: 6 //字体与饼状间距
          },
          data: [
            {
              name: '舒张压',
              value: this.Diastolic
            },
            {
              name: '收缩压',
              value: this.Systolic
            }

          ]
        }
      ],
    }
  )

/**
 * 显示内容
 */
async displayContent()
{

  this.heartRate=this.Systolic/(this.Systolic+this.Diastolic);

  this.message=BoodStat.getContent(this.Systolic)
  this.textColor=BoodStat.getFontColor(this.Systolic)
  this.conclusion=BoodStat.getTitle(this.Systolic)


}

  // 关键修复:用@Builder装饰器定义UI构建方法
  @Builder
  customTooltip(tooltipInfo: chartInterface.InterfaceObj) {
    Column() { // 建议包裹一个容器组件,方便布局
      if (tooltipInfo.title) {
        Text(tooltipInfo.title)
          .fontSize(16)
          .fontWeight(FontWeight.Bold)
      }
      ForEach(tooltipInfo.data, (item: chartInterface.InterfaceObj) => {
        Text(`${item.name}:${item.num}`)
          .fontSize(14)
      })
    }
    .padding(10)
    .backgroundColor('#ffffff')
    .borderRadius(5)
    .shadow({ radius: 3 })
  }

  aboutToAppear(): void {
    // 也可以 const params = router.getParams() as  BloodPressure | undefined;
    const params = router.getParams() as Record<string, BloodPressure> // BloodPressure | undefined;

    if (params['booldInfo']) { //?.booldInfo  booldInfo 名称和传递过来的参数名称一致

      //this.boolds=new BloodPressure();  params.booldInfo
      //也可以
      //this.boolds=params.booldInfo as BloodPressure;
      this.boolds=params['booldInfo'] //as BloodPressure;
      // this.boolds.Systolic=params.booldInfo.Systolic;
      // this.boolds.Diastolic=params.booldInfo.Diastolic;
      // this.boolds.HeartRate=params.booldInfo.HeartRate;

      this.Systolic=this.boolds.Systolic;  //Systolic
      this.Diastolic=this.boolds.Diastolic;  //Diastolic
      this.heartRate=this.boolds.HeartRate; //HeartRate


    }
    this.displayContent();
    setTimeout(() => {
      this.seriesOption.setVal({
        color: ['#ff848684', BoodStat.getFontColor(this.Systolic)
        ],
        //设置图例的相关样式与功能
        legend: {
          top: '5%', //图例距离顶部侧位置
          itemWidth: 10, //图形的宽度
          itemHeight: 10, //图形的高度
          textStyle: {
            //文本样式配置
            color: '#ff00b4ff', //字体颜色
            fontSize: 30, //字体大小
            fontWeight: '800' //字体粗细
          }
        },
        title: {
          show: true,
          text: `${this.Systolic}次/分种`, // 主标题文本
          textStyle: {
            //主标题文本样式配置
            color: '#fff60b0b', //字体颜色
            fontSize: 55, //字体大小
            fontWeight: '800' //字体粗细
          },
          subtext: '参考范围60-120', // 副标题文本
          subtextStyle: {
            //副标题文本样式配置
            color: '#ee0f1015', //字体颜色
            fontSize: 35, //字体大小
            fontWeight: '800' //字体粗细
          },
          top: '50%',
        },
        series: [
          {
            radius: ['50%', '30%'],
            labelLine: { //文本连接线样式配置
              length: 10, //连接线1的长度
              length2: 10, //连接线2的长度
              lineStyle: { //提示线样式
                width: 1, //线宽度
                color: '#FAAD14' //线颜色
              }
            },
            label: { //系列文本标签样式配置
              show: true, //是否显示文本标签
              fontWeight: '800', //字体粗细
              fontFamily: 'sans-serif',
              color: '#333', //字体颜色
              position: 'outside', //文本显示位置
              fontSize: 60, //字体大小
              distanceToLabelLine: 6 //字体与饼状间距
            },
            data: [
              {
                name: '舒张压',
                value: this.Diastolic
              },
              {
                name: '收缩压',
                value: this.Systolic
              }

            ]
          }
        ]

      })
    }, 2000)
  }

  build() {
    Column({space: 10}) {
      Row(){
        // 传入自定义tooltip构建器(根据mccharts的API调整属性名)
        McPieChart({options:this.seriesOption})
          .width('100%')
          .height('100%')

      }
      .height('50%')
      .width('100%')
      Row() {
        Text(this.conclusion) //结论
          .fontSize(22)
          .fontWeight(FontWeight.Bold)
          .fontColor(BoodStat.getFontColor(this.Systolic))
          .margin(10)
          .align(Alignment.Center)
      }
      .textExtend('#ffe5dada')

      Row() {
        Text(this.message)  //描述
          .fontSize(16)
          .fontWeight(FontWeight.Bold)
          .margin(10)
          .width('100%')
      }
      .textExtend('#ffd68989')
      Row() {
       Button() {
         Text('返回')
           .fontSize(16)
           .fontWeight(FontWeight.Bold)
           .fontColor('#fff10505')
           .onClick(() => {
             router.back()
           })
       }
       }
    }
    .width('100%')
    .height('100%')


  }
}
/**
 *
 * @param color
 */
@Extend(Row)
function textExtend(color:string) {
  .width('99%')
  .justifyContent(FlexAlign.Center)
  .borderRadius(10)
  .backgroundColor(color)
}
/*
# encoding: utf-8
# 版权所有  2025 ©涂聚文有限公司™ ®
# 许可信息查看:言語成了邀功盡責的功臣,還需要行爲每日來值班嗎
# 描述:
# Author    : geovindu,Geovin Du 涂聚文.
# IDE       : DevEco Studio 5.1.1 HarmonyOS  ArKTS
# os        : windows 10
# database  : mysql 9.0 sql server 2019, postgreSQL 17.0  Oracle 21c Neo4j
# Datetime  : 2025/8/6 20:55
# User      :  geovindu
# Product   : DevEco Studio
# Project   : sqliteHelper
# File      : LineChartPage.ets
*/
import { McLineChart, Options } from '@mcui/mccharts'

@Entry
@Component
struct LineChartPage {
  @State message: string = 'Hello World';
  @State defOptions: Options = new Options({
    //设置图例的相关样式与功能
    legend: {
      top: '5%', //图例距离顶部侧位置
      itemWidth: 10, //图形的宽度
      itemHeight: 10, //图形的高度
      textStyle: {
        //文本样式配置
        color: '#ff000000', //字体颜色
        fontSize: 40, //字体大小
        fontWeight: '500' //字体粗细
      }
    },
    //设置X轴的相关样式与功能
    xAxis: {
      axisLabel: {
        color: '#ff838383', //X轴字体颜色
        fontSize: 28, //X轴字体大小
        fontWeight: '600' //X轴字体粗线
      },
      axisTick: {
        //刻度线配置
        show: true, //控制刻度线显示与隐藏
        length: 6, // 刻度线的长度
        interval: 4, //刻度线与文本的间隔
        lineStyle: {
          color: '#ff838383', //X轴刻度线颜色
          width: 1 //X轴线刻度线宽度
        }
      },
      axisLine: {
        //x轴线配置
        show: true, //控制轴线显示与隐藏 可选值-true显示 false-隐藏
        lineStyle: {
          color: '#ff838383', //X轴线条颜色
          width: 1, //X轴线宽度
          type: 'solid' //X轴线类型
        }
      },
      data: ['周一', '周二', '周三', '周四', '周五', '周六', '周日']
    },
    //设置Y轴的相关样式与功能
    yAxis: {
      name: '温度',
      axisTick: {
        //刻度线配置
        length: 6, //刻度的长度
        lineStyle: {
          //刻度线样式
          color: '#ff838383', //线颜色
          width: 1 //线宽度
        }
      },
      axisLine: {
        //y轴线配置
        show: true //隐藏y轴线
      },
      splitLine: {
        // Y轴分割线配置。
        show: true, //显示分割线
        lineStyle: {
          //轴线样式
          color: '#ffe5e5e5', //线颜色
          width: 1 //线宽度
        }
      },
      axisLabel: {
        //y轴文本标签样式配置
        color: '#ff838383', //字体颜色
        fontSize: 35, //字体大小
        fontWeight: '500' //字体粗细
      },
    },
    //设置折线区的相关样式与功能
    series: [
      {
        name: "周最高气温", //图例文字
        color: '#ffff0002', //图例颜色
        lineStyle: {
          //折线样式配置
          width: 2, //折线宽度
          color: '#ffff0002' //折线显色
        },
        itemStyle: {
          //折线拐点配置
          symbol: 'solidCircle', //拐点类型
          symbolSize: 4 //拐点大小
        },
        data: [25,26,28,21,24,23,25] //数据
      },
      {
        name: "周最低气温", //图例文字
        color: '#ff1c4bc3', //图例颜色
        lineStyle: {
          width: 2, //折线宽度
          color: '#ff4068cf' //折线显色
        },
        itemStyle: {
          //折线拐点配置
          symbol: 'solidCircle', //拐点类型
          symbolSize: 4 //拐点大小
        },
        data: [18,19,20,19,17,16,18] //数据
      }
    ],
    tooltip: {
      //设置提示层的相关样式与功能
      axisPointer: {
        //指示器配置项
        type: 'line', //指示器类型
        lineStyle: {
          //提示线样式
          color: '#D9D9D9', //线颜色
          width: 2, //线宽度
          type: 'solid' //线类型
        }
      },
      backgroundColor: '#FFFFFF', //提示框背景颜色
      borderColor: '#C4C4C4', //提示框边框颜色
      borderWidth: 1, //提示框边框宽度
      padding: 6, //提示框内边距
      textStyle: {
        //文本样式配置
        color: '#666666', //字体颜色
        fontSize: 14 //字体大小
      }
    },
  })


  build() {
    Column() {
      //折线图组件
      McLineChart({ options: this.defOptions })
        .height('60%') //设置图表区域的高度
    }
    .height('100%')
    .width('100%')
  }


}


/*
# encoding: utf-8
# 版权所有  2025 ©涂聚文有限公司™ ®
# 许可信息查看:言語成了邀功盡責的功臣,還需要行爲每日來值班嗎
# 描述:
# Author    : geovindu,Geovin Du 涂聚文.
# IDE       : DevEco Studio 5.1.1 HarmonyOS  ArKTS
# os        : windows 10
# database  : mysql 9.0 sql server 2019, postgreSQL 17.0  Oracle 21c Neo4j
# Datetime  : 2025/8/6 20:55
# User      :  geovindu
# Product   : DevEco Studio
# Project   : sqliteHelper
# File      : LineOneChartPage.ets
*/

import { McLineChart, Options } from '@mcui/mccharts'

@Entry
@Component
struct LineOneChartPage {
  @State message: string = 'Hello World';
  @State defOptions: Options = new Options({
    //设置图例的相关样式与功能
    legend: {
      top: '5%', //图例距离顶部侧位置
      itemWidth: 10, //图形的宽度
      itemHeight: 10, //图形的高度
      textStyle: {
        //文本样式配置
        color: '#ff000000', //字体颜色
        fontSize: 40, //字体大小
        fontWeight: '500' //字体粗细
      }
    },
    //设置X轴的相关样式与功能
    xAxis: {
      axisLabel: {
        color: '#ff838383', //X轴字体颜色
        fontSize: 28, //X轴字体大小
        fontWeight: '600' //X轴字体粗线
      },
      axisTick: {
        //刻度线配置
        show: true, //控制刻度线显示与隐藏
        length: 6, // 刻度线的长度
        interval: 4, //刻度线与文本的间隔
        lineStyle: {
          color: '#ff838383', //X轴刻度线颜色
          width: 1 //X轴线刻度线宽度
        }
      },
      axisLine: {
        //x轴线配置
        show: true, //控制轴线显示与隐藏 可选值-true显示 false-隐藏
        lineStyle: {
          color: '#ff838383', //X轴线条颜色
          width: 1, //X轴线宽度
          type: 'solid' //X轴线类型
        }
      },
      data: ['00-02', '03-04', '05-06', '07-08', '09-10', '11-12', '13-14', '15-16', '17-18', '19-20', '21-22', '23-24']
    },
    //设置Y轴的相关样式与功能
    yAxis: {
      name: '温度(度)',
      axisTick: {
        //刻度线配置
        length: 6, //刻度的长度
        lineStyle: {
          //刻度线样式
          color: '#ff838383', //线颜色
          width: 1 //线宽度
        }
      },
      axisLine: {
        //y轴线配置
        show: true //隐藏y轴线
      },
      splitLine: {
        // Y轴分割线配置。
        show: true, //显示分割线
        lineStyle: {
          //轴线样式
          color: '#ffe5e5e5', //线颜色
          width: 1 //线宽度
        }
      },
      axisLabel: {
        //y轴文本标签样式配置
        color: '#ff838383', //字体颜色
        fontSize: 35, //字体大小
        fontWeight: '500' //字体粗细
      },
    },
    //设置折线区的相关样式与功能
    series: [
      {
        name: "1天24小时温度", //图例文字
        color: '#ffff0000', //图例颜色
        lineStyle: {
          width: 2, //折线宽度
          color: '#ff086d1d' //折线显色
        },
        itemStyle: {
          //折线拐点配置
          symbol: 'ffff0000', //拐点类型
          symbolSize: 4 //拐点大小
        },
        // 平滑曲线
        smooth: true,
        // 区域颜色,线性渐变
        areaStyle: {
          show: true,
          gradient: ['#ff4d964e', '#ff93cb9d']
        },
        data: [18,17,16,15,14,18,22,25,26,24,21,19] //数据
      }
    ],
    tooltip: {
      //设置提示层的相关样式与功能
      axisPointer: {
        //指示器配置项
        type: 'line', //指示器类型
        lineStyle: {
          //提示线样式
          color: '#D9D9D9', //线颜色
          width: 2, //线宽度
          type: 'solid' //线类型
        }
      },
      backgroundColor: '#FFFFFF', //提示框背景颜色
      borderColor: '#C4C4C4', //提示框边框颜色
      borderWidth: 1, //提示框边框宽度
      padding: 6, //提示框内边距
      textStyle: {
        //文本样式配置
        color: '#666666', //字体颜色
        fontSize: 14 //字体大小
      }
    },
  })

  build() {
    Column() {
      //折线图组件
      McLineChart({ options: this.defOptions })
        .height('60%') //设置图表区域的高度
    }

    .height('100%')
    .width('100%')
  }
}
哲学管理(学)人生, 文学艺术生活, 自动(计算机学)物理(学)工作, 生物(学)化学逆境, 历史(学)测绘(学)时间, 经济(学)数学金钱(理财), 心理(学)医学情绪, 诗词美容情感, 美学建筑(学)家园, 解构建构(分析)整合学习, 智商情商(IQ、EQ)运筹(学)生存.---Geovin Du(涂聚文)

 浙公网安备 33010602011771号