

d3.js: Relation Graph
geovindu.json
{
"nodes": [
{
"id": 0,
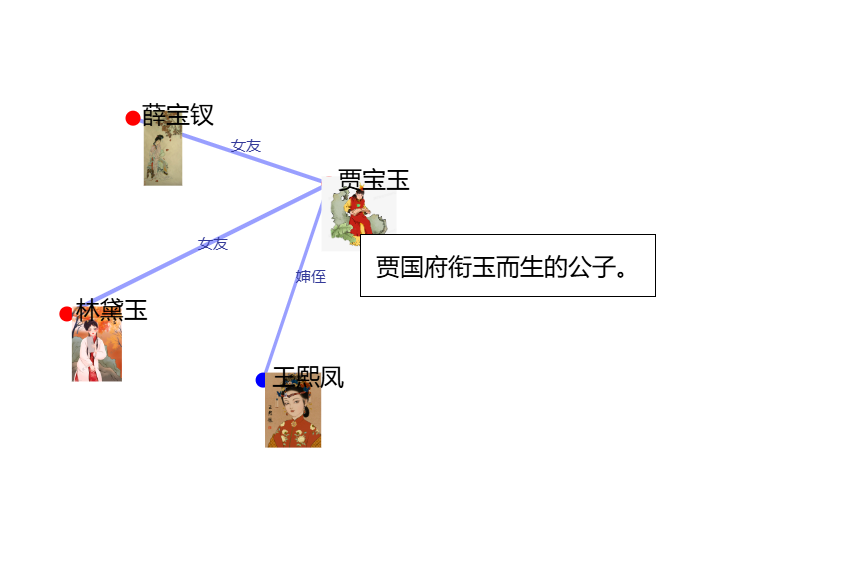
"name": "贾宝玉",
"image": "1.png",
"group": 1,
"description": "贾国府衔玉而生的公子。"
},
{
"id": 1,
"name": "林黛玉",
"image": "lin.jpg",
"group": 1,
"description": "贾亲密女友。"
},
{
"id": 3,
"name": "薛宝钗",
"image": "bao.jpg",
"group": 1,
"description": "贾府中意女子。"
},
{
"id": 4,
"name": "王熙凤",
"image": "wan.jpg",
"group": 2,
"description": "贾琏的妻子"
}
],
"links": [
{ "source": 0, "target": 1, "value": 8, "relation": "女友" },
{ "source": 0, "target": 3, "value": 7, "relation": "女友" },
{ "source": 1, "target": 3, "value": 7, "relation": "情敌" },
{ "source": 4, "target": 3, "value": 5, "relation": "外侄女" },
{ "source": 4, "target": 1, "value": 5, "relation": "表妹" },
{ "source": 4, "target": 0, "value": 5, "relation": "婶侄子" }
]
}
<!-- 引入 D3.js 库 -->
<script src="https://d3js.org/d3.v7.min.js"></script>
geovindu.js
// JavaScript Document geovindu.js
const svg = d3.select("#chart")
           .attr("width", 800)
           .attr("height", 500);

        const width = +svg.attr("width");
        const height = +svg.attr("height");


        const descriptionDiv = d3.select("#description");

        d3.json("geovindu.json").then(data => {
            console.log("Loaded data:", data);
    		console.log("Links:", data.links);

           // 创建连接线
			const link = svg.append("g")
			   .attr("class", "links")
			   .selectAll("line")
			   .data(data.links)
			   .enter().append("line")
			   .attr("stroke-width", d => Math.sqrt(d.value));
				//先隐藏
			link.style("opacity", 0);

            // 创建关系标签文字
            const linkLabels = svg.append("g")
               .attr("class", "link-labels")
               .selectAll("text")
               .data(data.links)
               .enter().append("text")
               .text(d => d.relation)
               .attr("font-size", "10px")
               .attr("fill", "#333999");

            	// 创建节点
			const node = svg.append("g")
			   .attr("class", "nodes")
			   .selectAll("g")
			   .data(data.nodes)
			   .enter().append("g");

            const simulation = d3.forceSimulation()
               .force("link", d3.forceLink().id(d => d.id).distance(150)) // 调整链接距离
               .force("charge", d3.forceManyBody().strength(-300)) // 调整电荷力强度
               .force("center", d3.forceCenter(width / 2, height / 2));

            const circles = node.append("circle")
               .attr("r", 5)
               .attr("fill", d => {
                    if (d.group === 1) return "red";
                    else return "blue";
                });

            const images = node.append("image")
               .attr("href", d => d.image)
               .attr("x", -5)
               .attr("y", -5)
               .attr("width", 50)
               .attr("height", 50)
			   .on("mouseover", (event, d) => {
                    // 显示描述信息
                    descriptionDiv.style("display", "block")
                       .style("left", (event.pageX + 10) + "px")
                       .style("top", (event.pageY + 10) + "px")
                       .html(d.description);

						// 显示与该节点相关的线条和关系名称标签
						link.style("opacity", l => l.source === d || l.target === d ? 1 : 0);
						linkLabels.style("opacity", l => l.source === d || l.target === d ? 1 : 0);

                })
               .on("mouseout", () => {
                    // 隐藏描述信息
                    descriptionDiv.style("display", "none");

                    // 隐藏所有线条和关系名称标签
                    link.style("opacity", 0);
                    linkLabels.style("opacity", 0);
                })


               .on("error", (error, d) => {
                    console.error(`Error loading image for ${d.name}:`, error);
                });

            const labels = node.append("text")
               .text(d => d.name)
               .attr('x', 6)
               .attr('y', 3)
               .on("mouseover", (event, d) => {
                    // 显示描述信息
                    descriptionDiv.style("display", "block")
                       .style("left", (event.pageX + 10) + "px")
                       .style("top", (event.pageY + 10) + "px")
                       .html(d.description);

						// 显示与该节点相关的线条和关系名称标签
						link.style("opacity", l => l.source === d || l.target === d ? 1 : 0);
						linkLabels.style("opacity", l => l.source === d || l.target === d ? 1 : 0);

                })
               .on("mouseout", () => {
                    // 隐藏描述信息
                    descriptionDiv.style("display", "none");

                    // 隐藏所有线条和关系名称标签
                    link.style("opacity", 0);
                    linkLabels.style("opacity", 0);
                });

            const drag = d3.drag()
               .on("start", dragstarted)
               .on("drag", dragged)
               .on("end", dragended);

            node.call(drag);

            simulation
               .nodes(data.nodes)
               .on("tick", ticked);

            simulation.force("link")
               .links(data.links);

            function ticked() {
                link
                   .attr("x1", d => d.source.x)
                   .attr("y1", d => d.source.y)
                   .attr("x2", d => d.target.x)
                   .attr("y2", d => d.target.y);

                // 更新关系标签文字的位置
                linkLabels
                   .attr("x", d => (d.source.x + d.target.x) / 2)
                   .attr("y", d => (d.source.y + d.target.y) / 2);

                node
                   .attr("transform", d => `translate(${d.x},${d.y})`);
            }

            function dragstarted(event, d) {
                if (!event.active) simulation.alphaTarget(0.3).restart();
                d.fx = d.x;
                d.fy = d.y;
            }

            function dragged(event, d) {
                d.fx = event.x;
                d.fy = event.y;
            }

            function dragended(event, d) {
                if (!event.active) simulation.alphaTarget(0);
                d.fx = null;
                d.fy = null;
            }
        }).catch(error => {
            console.error("Error loading data:", error);
        });
geovindu.css
@charset "utf-8";
/* CSS Document geovindu.css geovindu,Geovin Du */

 .node circle {
            fill: #cccccc;
            stroke: steelblue;
            stroke-width: 3px;
        }

        .node text {
            font: 12px sans-serif;
            cursor: pointer;
        }

        .links {
            fill: none;
            stroke: #999fff;
            stroke-width: 2px;
            opacity: 1; /* 初始时连接线隐藏 */
            transition: opacity 0.3s;
        }

        .link-labels text {
            font-size: 10px;
            fill: #333999;
            opacity: 0; /* 初始时关系名称标签隐藏 */
            transition: opacity 0.3s;
        }

        #description {
            position: absolute;
            background-color: white;
            border: 1px solid black;
            padding: 10px;
            display: none;
        }
<!DOCTYPE html>
<html lang="en">

<head>
    <meta charset="UTF-8">
    <meta name="viewport" content="width=device-width, initial-scale=1.0">
       <title>简单人物关系图谱 Relation Graph </title>
	 <link rel="shortcut icon" href="/favicon.ico">
<meta content="Relation Graph  涂聚文,Geovin Du,塗聚文,geovindu,捷为工作室" name="keywords">
<meta content="Relation Graph 涂聚文,Geovin Du,塗聚文,geovindu,捷为工作室" name="description">
	   <script src="./d3/7.9.0/d3.js"></script>
    <link rel="stylesheet" type="text/css" href="./geovindu.css" />
</head>

<body>
    <svg id="chart" width="800" height="600"></svg>
    <div id="description"></div>
    <script type="text/javascript" src="geovindu.js">
    </script>
</body>

</html>
哲学管理(学)人生, 文学艺术生活, 自动(计算机学)物理(学)工作, 生物(学)化学逆境, 历史(学)测绘(学)时间, 经济(学)数学金钱(理财), 心理(学)医学情绪, 诗词美容情感, 美学建筑(学)家园, 解构建构(分析)整合学习, 智商情商(IQ、EQ)运筹(学)生存.---Geovin Du(涂聚文)

 浙公网安备 33010602011771号