Doris Profile 开启与查看
1 打开Profile 设置
需在mysql中
0.15之前
SET is_report_success=true;
0.15 及之后的版本执行下面的设置
SET [GLOBAL] enable_profile=true;
测试1.1.1
MySQL [(none)]> SET GLOBAL enable_profile=true;
Query OK, 0 rows affected (0.02 sec)
2 Profile的查询
2.1 查询语句
可在web上,也可在mysql中
show query profile "/";

2.2 列出指定QueryId的 query Profile
show query profile "/queryId"\G
MySQL [(none)]> show query profile "/b0e1bd1b6c404cc7-991653a84642e769"\G;
*************************** 1. row ***************************
Fragments: ┌──────────────────────┐
│[-1: DataBufferSender]│
│Fragment: 0           │
│MaxActiveTime: 1.496ms│
└──────────────────────┘
            │
            │
......
           │
           │
  ┌─────────────────┐
  │[SegmentIterator]│
  │Fragment: 1      │
  └─────────────────┘
1 row in set (0.01 sec)
ERROR: No query specified
2.3 列出指定 Fragment 的 Instance 概况
show query profile "/queryId/fragment_id/instance_id";
MySQL [(none)]> show query profile "/b0e1bd1b6c404cc7-991653a84642e769/1/b0e1bd1b6c404cc7-991653a84642e76a"\G;
*************************** 1. row ***************************
Instance: ┌───────────────────────────────────────┐
│[1: DataStreamSender]                  │
│(Active: 81.417us, non-child: 0.39)    │
│  - Counters:                          │
│      - BytesSent: 0.00                │
│      - IgnoreRows: 0                  │
│      - LocalBytesSent: 0.00           │
│      - OverallThroughput: 0.0 /sec    │
│      - PeakMemoryUsage: 2.66 KB       │
│      - SerializeBatchTime: 0ns        │
│      - UncompressedRowBatchSize: 0.00 │
└───────────────────────────────────────┘
                    │
                    │
......
1 row in set (0.00 sec)
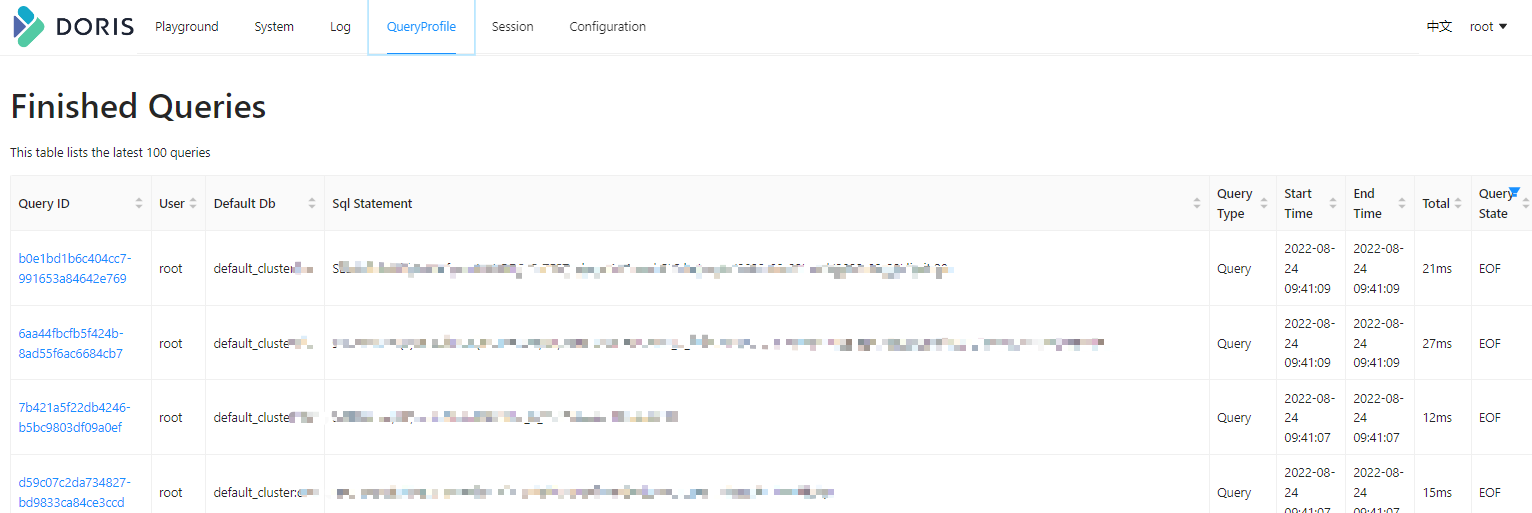
3 web-ui查看
参考:doris 官网 https://doris.incubator.apache.org/zh-CN/docs/sql-manual/sql-reference/Show-Statements/SHOW-QUERY-PROFILE

 浙公网安备 33010602011771号