


《Prometheus 企业级监控框架实战指南:从采集、分析到智能告警》:Prometheus 基础篇
Prometheus 基础篇 —— 部署与核心原理实战,构建监控数据底座
本文是《Prometheus 企业级监控系统实战指南:从采集、分析到智能告警》系列的第一篇!
本系列将带你从零开始,基于 Prometheus + Flink + Grafana + 睿象云(CA) 构建一套真正 “可采集、可分析、可展示、可通知” 的企业级监控与告警系统。
⚠️ 该系列所有涉及的软件包和项目都可以私信博主免费获取
第一篇:Prometheus 基础篇 —— 部署与核心原理实战,构建监控数据底座
核心:完成 Prometheus Server、Node Exporter 等核心组件部署,理解 Pull 模式、数据模型、时间序列、Job / Target 等关键概念,快速实现主机级监控。
第二篇:PromQL 实战篇 —— 掌握监控数据的“灵魂语言”
核心:系统掌握 PromQL 的核心语法与高频函数,学会对 CPU、内存、磁盘、网络等指标进行统计、聚合、对比,实现真正的数据分析能力。
第三篇:流处理联动篇 —— Prometheus 与 Flink 集成(实时计算 + 智能监控)
核心:将 Prometheus 采集的监控数据送入 Flink 进行实时计算,实现自定义规则、趋势预测、异常检测,为智能运维提供数据支撑。
第四篇:可视化篇 —— Prometheus + Grafana 打造企业级可视化大屏
核心:通过 Grafana 对接 Prometheus 数据源,设计高质量、可视化、可复用的运维大屏,适配运维场景与汇报需求。第五篇:智能告警篇 —— Grafana + 睿象云 CA 实现多通道告警
核心:通过 Grafana 的 Alert 机制对接睿象云,实现微信、短信、电话、钉钉/飞书等多通道告警,避免邮件告警遗漏风险,构建完整告警闭环系统。
系列最终成果
当你完整学完并实操本系列,你将拥有:
✅ 一套完整的 Prometheus 企业级监控体系
✅ 可落地的实时分析与异常检测能力
✅ 高颜值可视化监控大屏
✅ 真正“无人值守”的智能告警系统
✅ 企业级项目经验,可写进简历/毕设/项目经验
真正实现:监控采集 → 实时分析 → 可视化展示 → 智能告警 → 自动化运维闭环
一:入门
1)概述
- 起源:受 Google Borgmon 启发,2012 年由前 Google 工程师在 SoundCloud 开发。
- 重要里程碑:
- 2015:首次开源发布
- 2016:加入 CNCF,1.0 发布
- 2017:版本2.0 发布(全新存储层,更适配容器、云平台)
- 社区:650+ 贡献者,120+ 第三方集成。
- 定位:新一代云原生监控系统。
2)特点
- 易于管理
- 单个二进制文件运行,无第三方依赖(数据库、缓存)。
- Pull 模型架构,支持服务发现(动态发现监控目标)。
- 监控服务内部运行状态
- 提供丰富的 Client SDK,可在应用程序中直接埋点采集内部指标。
- 强大的数据模型
- 数据以 指标(Metric)+ 标签(Label) 形式存储在 TSDB。
- 每条时间序列由指标名 + 标签唯一标识。
- 查询语言 PromQL
- 支持复杂查询、聚合、预测、过滤。
- 应用于告警和可视化(Grafana)。
- 高效
- 单实例可处理数百万指标、每秒数十万数据点。
- 可扩展
- 支持联邦集群(Federation)、分片(Sharding)。
- 易于集成
- 多语言 SDK(Java、Go、Python、.NET、Node.js 等)。
- 与 Graphite、StatsD、Nagios 等系统互通。
- 社区提供大量 Exporter(MySQL、Redis、Kafka、Node、SNMP 等)。
- 可视化
- 自带 WebUI。
- Grafana 完整支持。
- 提供 API,可自建 UI。
- 开放性
- Client library 输出不仅支持 Prometheus 格式,也兼容其他监控系统(如 Graphite)。
3)架构图解
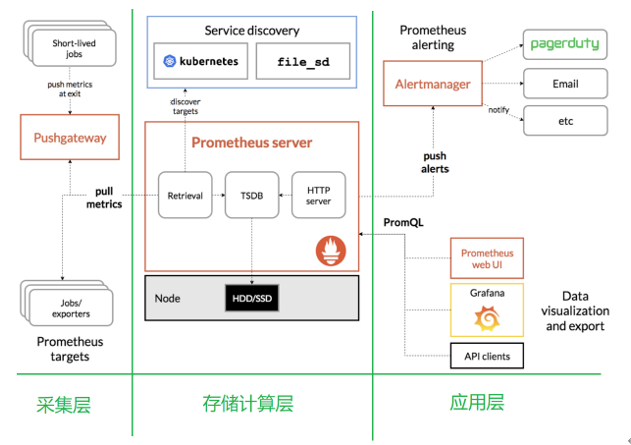
生态组件
- Prometheus Server:核心(存储 + 计算引擎)。
- Client Libraries:代码埋点。
- PushGateway:支持短任务数据推送。
- Exporter:采集现有系统/应用数据。
- Alertmanager:告警管理(邮件、短信、Webhook 等)。
架构理解
存储计算层
- Prometheus Server(包含存储和计算引擎)。
- Retrieval 组件:主动拉取指标(从 Exporter/PushGateway)。
- Service Discovery:动态发现目标。
- TSDB:时间序列存储。
- HTTP Server:对外接口。
采集层
特点 Node Exporter Pushgateway 数据来源 系统/主机资源指标 短生命周期任务、应用程序主动推送 工作方式 被 Prometheus 定期拉取 (pull) 任务主动推送 (push),Prometheus 再拉取 适用场景 服务器硬件资源监控 脚本、批处理任务、临时作业的指标上报 运行模式 常驻进程,持续暴露数据 指标缓存服务,等待 Prometheus 抓取 应用层
- 告警:Alertmanager(支持邮件、短信、电话、Webhook 等)。
- 可视化:自带 WebUI、Grafana、第三方 API 客户端。
二:安装
1. 安装 Prometheus
| 机器 | IP | 角色 |
|---|---|---|
| hadoop102(lb01) | 192.168.2.102 | 172.16.1.102 | Prometheus Server + Node Exporter + Hadoop + Flink + Grafana |
| hadoop103(lb02) | 192.168.2.103 | 172.16.1.103 | Node Exporter + Hadoop |
| hadoop104(web01) | 192.168.2.104 | 172.16.1.104 | Node Exporter + Hadoop |
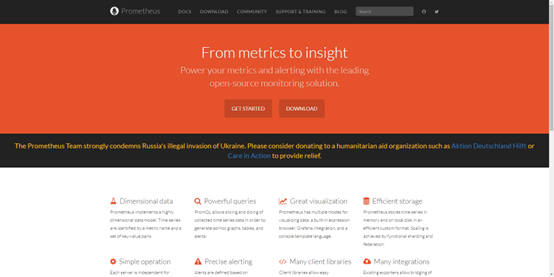
1)官网下载
官网
下载地址
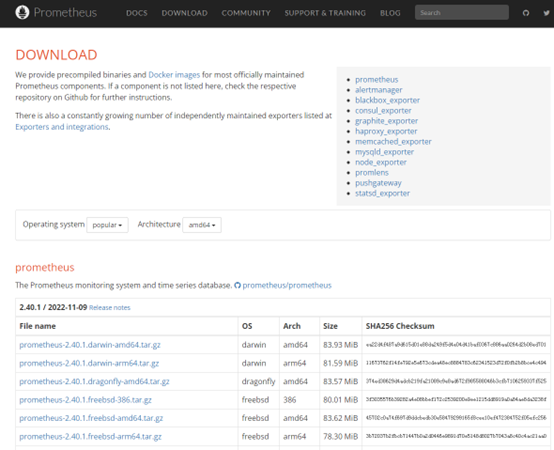
2)上传安装包
上传
prometheus-2.29.1.linux-amd64.tar.gz到Linux的/opt/software目录
[root@hadoop102 software]# rz3)解压安装包
解压到
/opt/module目录下
[root@hadoop102 software]# tar -xzvf prometheus-2.29.1.linux-amd64.tar.gz -C /opt/module/4)修改内容
# 重命名
[root@hadoop102 module]# mv prometheus-2.29.1.linux-amd64/ prometheus-2.29.1
# 创建 bin logs 目录
[root@hadoop102 module]# cd prometheus-2.29.1
[root@hadoop102 prometheus-2.29.1]# mkdir bin logs5)配置 prometheus.yml
配置说明:
global:控制Prometheus服务器的全局配置
scrape_interval:配置拉取数据的时间间隔,默认为1分钟。evaluation_interval:规则验证(生成alert)的时间间隔,默认为1分钟。alerting:告警聚合、抑制、分组、通知(邮件、短信、钉钉、微信等)。rule_files:规则配置文件scrape_configs:配置采集目标相关
job_name:监控作业的名称static_configs:表示静态目标配置,就是固定从某个target拉取数据targets:指定监控的目标,其实就是从哪儿拉取数据
[root@hadoop102 prometheus-2.29.1]# vim prometheus.yml# my global config
global:
scrape_interval: 15s # Set the scrape interval to every 15 seconds. Default is every 1 minute.
evaluation_interval: 15s # Evaluate rules every 15 seconds. The default is every 1 minute.
# scrape_timeout is set to the global default (10s).
# Alertmanager configuration
alerting:
alertmanagers:
- static_configs:
- targets:
# - alertmanager:9093
# Load rules once and periodically evaluate them according to the global 'evaluation_interval'.
rule_files:
# - "first_rules.yml"
# - "second_rules.yml"
# A scrape configuration containing exactly one endpoint to scrape:
# Here it's Prometheus itself.
scrape_configs:
# The job name is added as a label `job=<job_name>` to any timeseries scraped from this config.
- job_name: "prometheus"
# metrics_path defaults to '/metrics'
# scheme defaults to 'http'.
static_configs:
- targets: ["192.168.2.102:9090"]
# 添加 PushGateway 监控配置
- job_name: "pushgateway"
static_configs:
- targets: ["192.168.2.102:9091"]
labels:
instance: pushgateway
# 添加 Node Exporter 监控配置
- job_name: "node exporter"
static_configs:
- targets: ["192.168.2.102:9100", "192.168.2.103:9100", "192.168.2.104:9100"]2. 安装 Pushgateway
1)上传安装包
上传
pushgateway-1.4.1.linux-amd64.tar.gz到Linux的/opt/software目录
[root@hadoop102 software]# rz2)解压安装包
解压到
/opt/module目录下
[root@hadoop102 software]# tar -xzvf pushgateway-1.4.1.linux-amd64.tar.gz -C /opt/module/3)修改内容
# 重命名
[root@hadoop102 module]# mv pushgateway-1.4.1.linux-amd64/ pushgateway-1.4.1
3. 安装 Altermanager (可选)
1)上传安装包
上传
alertmanager-0.23.0.linux-amd64.tar.gz到Linux的/opt/software目录
[root@hadoop102 software]# rz2)解压安装包
解压到
/opt/module目录下
[root@hadoop102 software]# tar -xzvf alertmanager-0.23.0.linux-amd64.tar.gz -C /opt/module/3)修改内容
# 重命名
[root@hadoop102 module]# mv alertmanager-0.23.0.linux-amd64/ alertmanager-0.23.0
3. 安装 Node Exporter (可选)
hadoop102、hadoop103、hadoop104
1)上传安装包
上传
node_exporter-1.2.2.linux-amd64.tar.gz到Linux的/opt/software目录
[root@hadoop102 software]# rz2)解压安装包
解压到
/opt/module目录下
[root@hadoop102 software]# tar -xzvf node_exporter-1.2.2.linux-amd64.tar.gz -C /opt/module/3)修改内容
# 重命名
[root@hadoop102 module]# mv node_exporter-1.2.2.linux-amd64/ node_exporter-1.2.2
4)分发
将脚本放在
/usr/local/bin下,并且添加可执行权限
[root@hadoop102 module]# xsync.sh node_exporter-1.2.2/# xsync.sh
#!/bin/bash
# 脚本作用:将指定文件同步到 hadoop 集群指定节点的相同目录下
# ================= 配置部分 =================
START=102 # 起始节点号
END=104 # 结束节点号
# ============================================
# 1. 参数检查
if [ $# -eq 0 ]; then
echo "用法: $0 <文件路径>"
exit 1
fi
# 2. 获取文件名和上级目录绝对路径
file_path=$1
file_name=$(basename "$file_path")
parent_dir=$(cd -P "$(dirname "$file_path")" && pwd)
# 3. 获取当前用户名
current_user=$(whoami)
# 4. 打印脚本作用
echo "================ 脚本作用 ================="
echo "将文件 '${file_name}' 同步到 hadoop 集群 ${START} - ${END} 节点"
echo "同步目录: ${parent_dir}"
echo "当前用户: ${current_user}"
echo "============================================"
# 5. 循环同步
for ((host=START; host<=END; host++)); do
echo -e "\n--- ${current_user}@hadoop${host} ---"
rsync -rvluzP "${parent_dir}/${file_name}" \
"${current_user}@hadoop${host}:${parent_dir}"
done三:启动
1)启动 Prometheus Server
创建 service 文件
[root@hadoop102module]# vim /usr/lib/systemd/system/prometheus-server.service[Unit] Description=Linux Prometheus Server Documentation=https://prometheus.io/docs/introduction/overview/ After=network.target [Service] Restart=on-failure ExecStart=/opt/module/prometheus-2.29.1/prometheus \ --config.file=/opt/module/prometheus-2.29.1/prometheus.yml \ --web.enable-lifecycle ExecReload=/bin/kill -HUP $MAINPID LimitNOFILE=65535 [Install] WantedBy=multi-user.target启动服务
[root@hadoop102 module]# systemctl start prometheus-server.service
[root@hadoop102 module]# systemctl enable prometheus-server.service
2)启动 Pushgateway
创建 service 文件
[root@hadoop102 module]# vim /usr/lib/systemd/system/pushgateway.service[Unit] Description=Prometheus PushGateway Documentation=https://github.com/prometheus/pushgateway After=network.target [Service] Restart=on-failure ExecStart=/opt/module/pushgateway-1.4.1/pushgateway \ --web.listen-address=:9091 [Install] WantedBy=multi-user.target启动服务
[root@hadoop102 module]# systemctl start pushgateway.service
[root@hadoop102 module]# systemctl enable pushgateway.service
3)启动 Node Exporter
在 hadoop102 ~ hadoop104 上都操作一遍
创建 service 文件
[root@hadoop102 module]# vim /usr/lib/systemd/system/node_exporter.service[Unit] Description=node_export Documentation=https://github.com/prometheus/node_exporter After=network.target [Service] Type=simple User=root ExecStart=/opt/module/node_exporter-1.2.2/node_exporter Restart=on-failure [Install] WantedBy=multi-user.target启动服务
# 3. 启动服务
[root@hadoop102 module]# systemctl start node_exporter.service
[root@hadoop102 module]# systemctl enable node_exporter.service
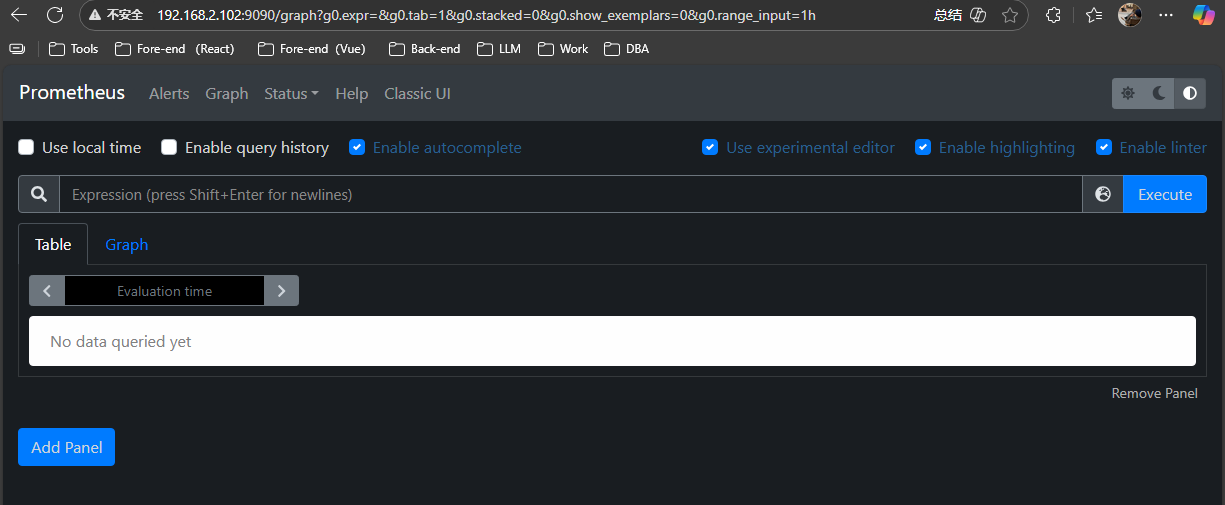
四:测试
总结
✅本篇完成了 Prometheus 监控体系的从零搭建,成功部署 Prometheus Server 与 Node Exporter,并理解了核心工作机制,包括 Pull 拉取模式、时间序列数据模型、Job/Target 架构 等关键概念。
✅目前已经可以实现对服务器 CPU、内存、磁盘、网络 等核心指标的实时监控,并能够通过 Web 界面进行基础查询与排查。
✅这为后续的 PromQL 分析、Flink 实时处理、Grafana 可视化以及智能告警系统 打下了坚实基础。

 浙公网安备 33010602011771号