

商品零售购物篮分析
#8-1
import numpy as np
import pandas as pd

inputfile="D:\数据分析\GoodsOrder.csv"
data=pd.read_csv(inputfile,encoding = 'gbk')
data.info()

data=data['id']
description=[data.count(),data.min(),data.max()]
description=pd.DataFrame(description,index=['Count','Min','Max']).T
print('描述性统计结果:\n',np.round(description))


#8-2
import pandas as pd
inputfile="D:\数据分析\GoodsOrder.csv"
data=pd.read_csv(inputfile,encoding='gbk')
group=data.groupby(['Goods']).count().reset_index()
sorted=group.sort_values('id',ascending=False)
print('销量排行前10商品的销量:\n',sorted[:10])

import matplotlib.pyplot as plt
x=sorted[:10]['Goods']
y=sorted[:10]['id']
plt.figure(figsize=(8,4))
plt.barh(x,y)
plt.rcParams['font.sans-serif']='SimHei'
plt.xlabel('销量')
plt.ylabel('商品类别')
plt.title('学号3108商品的销量TOP10')
plt.savefig("D:/数据分析/top10.png")
plt.show()

data_nums=data.shape[0]
for index,row in sorted[:10].iterrows():
    print(row['Goods'],row['id'],row['id']/data_nums)


#8-3
import pandas as pd
inputfile1="D:\数据分析\GoodsOrder.csv"
inputfile2 ="D:\数据分析\GoodsTypes.csv"
data= pd.read_csv(inputfile1,encoding='gbk')
types = pd.read_csv(inputfile2,encoding='gbk')
group = data.groupby(['Goods']).count().reset_index()
sort = group.sort_values( 'id',ascending=False).reset_index()
datanums=data.shape[0]
del sort['index']
sort_links= pd.merge(sort,types)
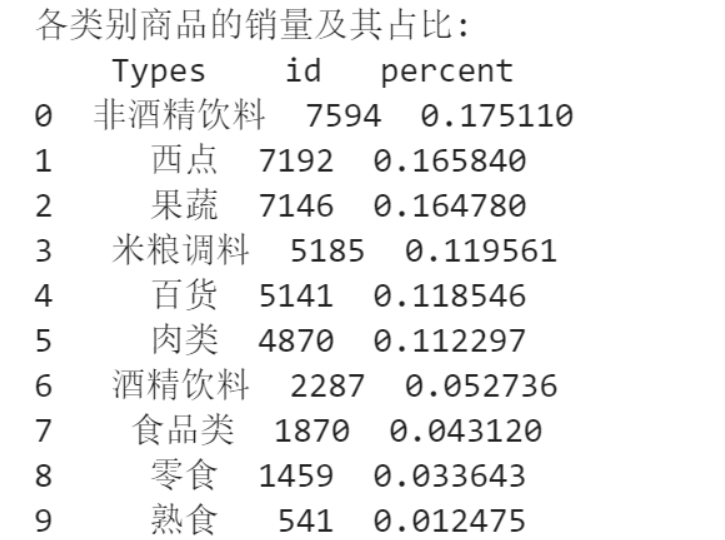
sort_link = sort_links.groupby(['Types']).sum().reset_index()
sort_link = sort_link.sort_values('id',ascending=False).reset_index()
del sort_link['index']
sort_link['count'] = sort_link.apply(lambda line: line['id']/data_nums,axis=1)
sort_link.rename(columns={'count':'percent'},inplace=True)
print('各类别商品的销量及其占比:\n',sort_link)
outfile1='D:/数据分析/percent.csv'
sort_link.to_csv(outfile1,index=False,header=True,encoding='gbk')
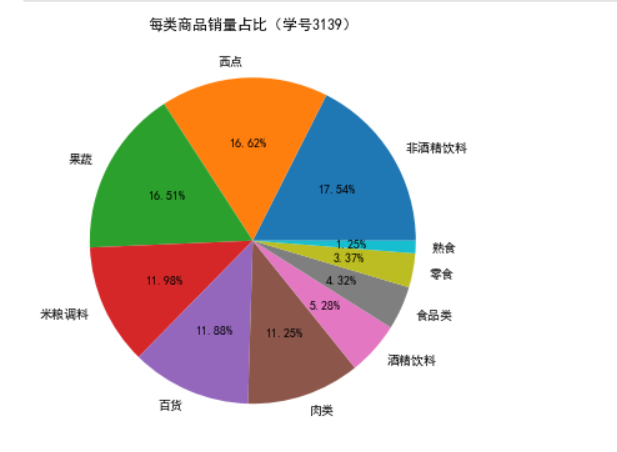
import matplotlib.pyplot as plt
data = sort_link['percent']
labels = sort_link['Types']
plt.figure(figsize=(8,6))
plt.pie(data,labels=labels,autopct='%1.2f%%')
plt.rcParams['font.sans-serif'] = 'SimHei'
plt.title('学号3108每类商品销量占比')
plt.savefig('D:/数据分析/persent.png')
plt.show()

#8-4
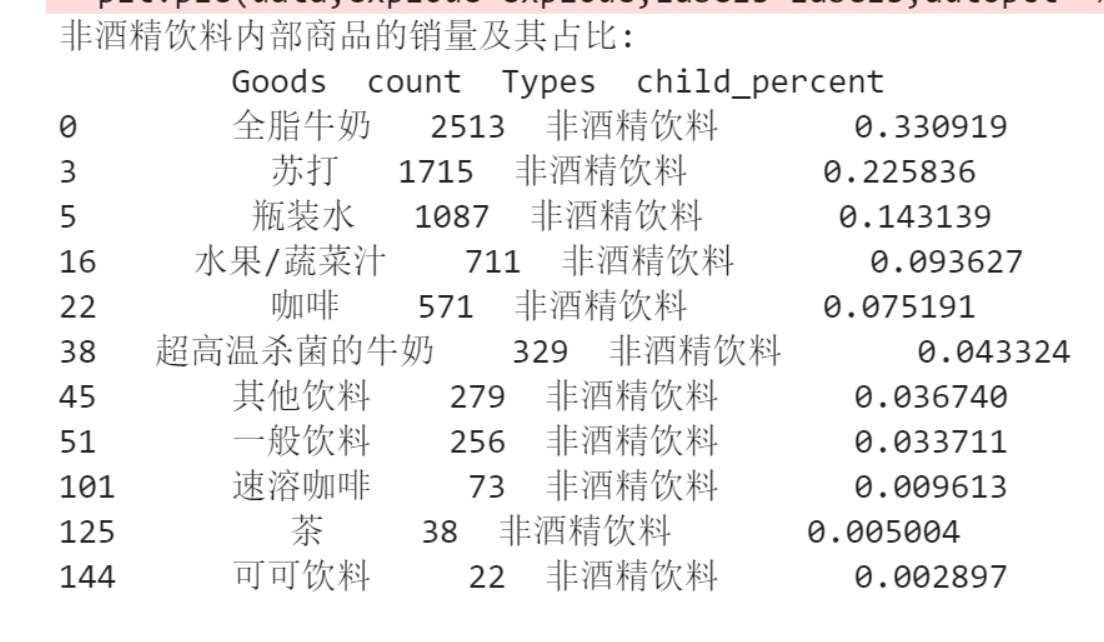
selected= sort_links.loc[sort_links['Types'] =='非酒精饮料']
child_nums= selected['id'].sum()
selected['child_percent'] = selected.apply(lambda line: line['id']/child_nums,axis=1)
selected.rename(columns={'id':'count'},inplace=True)
print('非酒精饮料内部商品的销量及其占比:\n',selected)
outfile2='D:/数据分析/child percent.csv'
sort_link.to_csv(outfile2,index=False,header=True,encoding='gbk')
import matplotlib.pyplot as plt
data = selected['child_percent']
labels = selected['Goods']
plt.figure(figsize=(8,6))
explode = (0.02,0.03,0.04,0.05,0.06,0.07,0.08,0.08,0.3,0.1,0.3)
plt.pie(data,explode=explode,labels=labels,autopct='%1.2f%%',pctdistance=1.1,labeldistance=1.2)
plt.rcParams['font.sans-serif'] ='SimHei'
plt.title('学号3108非酒精饮料内部各商品的销量占比')
plt.axis('equal')
plt.savefig('D:/数据分析/child_persent.png')
plt.show()
#8-5
import pandas as pd
inputfile="D:\数据分析\GoodsOrder.csv"
data = pd.read_csv(inputfile,encoding='gbk')

data['Goods'] = data['Goods'].apply(lambda x:','+x)
data=data.groupby(['id'])['Goods'].sum().reset_index()


#对合并的商品列转换数据格式
data['Goods'] = data['Goods'].apply(lambda x :[x[1:]])
data_list = list(data['Goods'])
data_translation = []
for i in data_list:
    p = i[0].split(',')
    data_translation.append(p)
print('数据转换结果的前5个元素:\n',data_translation[0:5])

from numpy import *
def loadDataSet():
return [['a', 'c', 'e'], ['b', 'd'], ['b', 'c'], ['a', 'b', 'c', 'd'], ['a', 'b'], ['b', 'c'], ['a', 'b'],
['a', 'b', 'c', 'e'], ['a', 'b', 'c'], ['a', 'c', 'e']]
def createC1(dataSet):
C1 = []
for transaction in dataSet:
for item in transaction:
if not [item] in C1:
C1.append([item])
C1.sort()
# 映射为frozenset唯一性的,可使用其构造字典
return list(map(frozenset, C1))
# 从候选K项集到频繁K项集(支持度计算)
def scanD(D, Ck, minSupport):
ssCnt = {}
for tid in D: # 遍历数据集
for can in Ck: # 遍历候选项
if can.issubset(tid): # 判断候选项中是否含数据集的各项
if not can in ssCnt:
ssCnt[can] = 1 # 不含设为1
else:
ssCnt[can] += 1 # 有则计数加1
numItems = float(len(D)) # 数据集大小
retList = [] # L1初始化
supportData = {} # 记录候选项中各个数据的支持度
for key in ssCnt:
support = ssCnt[key] / numItems # 计算支持度
if support >= minSupport:
retList.insert(0, key) # 满足条件加入L1中
supportData[key] = support
return retList, supportData
def calSupport(D, Ck, min_support):
dict_sup = {}
for i in D:
for j in Ck:
if j.issubset(i):
if not j in dict_sup:
dict_sup[j] = 1
else:
dict_sup[j] += 1
sumCount = float(len(D))
supportData = {}
relist = []
for i in dict_sup:
temp_sup = dict_sup[i] / sumCount
if temp_sup >= min_support:
relist.append(i)
# 此处可设置返回全部的支持度数据(或者频繁项集的支持度数据)
supportData[i] = temp_sup
return relist, supportData
# 改进剪枝算法
def aprioriGen(Lk, k):
retList = []
lenLk = len(Lk)
for i in range(lenLk):
for j in range(i + 1, lenLk): # 两两组合遍历
L1 = list(Lk[i])[:k - 2]
L2 = list(Lk[j])[:k - 2]
L1.sort()
L2.sort()
if L1 == L2: # 前k-1项相等,则可相乘,这样可防止重复项出现
# 进行剪枝(a1为k项集中的一个元素,b为它的所有k-1项子集)
a = Lk[i] | Lk[j] # a为frozenset()集合
a1 = list(a)
b = []
# 遍历取出每一个元素,转换为set,依次从a1中剔除该元素,并加入到b中
for q in range(len(a1)):
t = [a1[q]]
tt = frozenset(set(a1) - set(t))
b.append(tt)
t = 0
for w in b:
# 当b(即所有k-1项子集)都是Lk(频繁的)的子集,则保留,否则删除。
if w in Lk:
t += 1
if t == len(b):
retList.append(b[0] | b[1])
return retList
def apriori(dataSet, minSupport=0.2):
# 前3条语句是对计算查找单个元素中的频繁项集
C1 = createC1(dataSet)
D = list(map(set, dataSet)) # 使用list()转换为列表
L1, supportData = calSupport(D, C1, minSupport)
L = [L1] # 加列表框,使得1项集为一个单独元素
k = 2
while (len(L[k - 2]) > 0): # 是否还有候选集
Ck = aprioriGen(L[k - 2], k)
Lk, supK = scanD(D, Ck, minSupport) # scan DB to get Lk
supportData.update(supK) # 把supk的键值对添加到supportData里
L.append(Lk) # L最后一个值为空集
k += 1
del L[-1] # 删除最后一个空集
return L, supportData # L为频繁项集,为一个列表,1,2,3项集分别为一个元素
# 生成集合的所有子集
def getSubset(fromList, toList):
for i in range(len(fromList)):
t = [fromList[i]]
tt = frozenset(set(fromList) - set(t))
if not tt in toList:
toList.append(tt)
tt = list(tt)
if len(tt) > 1:
getSubset(tt, toList)
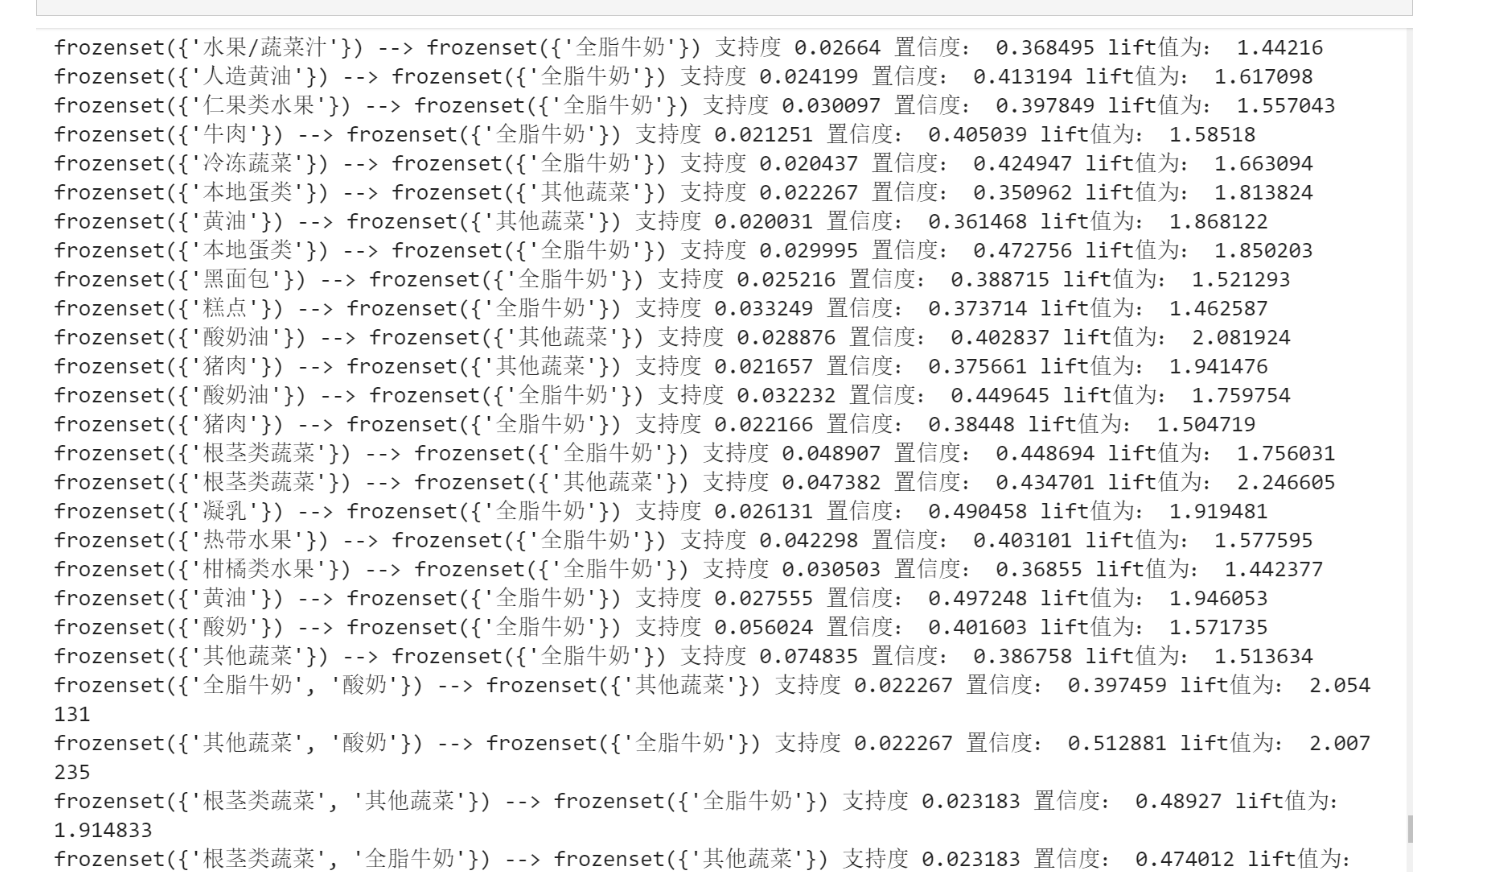
def calcConf(freqSet, H, supportData, ruleList, minConf=0.7):
for conseq in H: #遍历H中的所有项集并计算它们的可信度值
conf = supportData[freqSet] / supportData[freqSet - conseq] # 可信度计算,结合支持度数据
# 提升度lift计算lift = p(a & b) / p(a)*p(b)
lift = supportData[freqSet] / (supportData[conseq] * supportData[freqSet - conseq])
if conf >= minConf and lift > 1:
print(freqSet - conseq, '-->', conseq, '支持度', round(supportData[freqSet], 6), '置信度:', round(conf, 6),
'lift值为:', round(lift, 6))
ruleList.append((freqSet - conseq, conseq, conf))
# 生成规则
def gen_rule(L, supportData, minConf = 0.7):
bigRuleList = []
for i in range(1, len(L)): # 从二项集开始计算
for freqSet in L[i]: # freqSet为所有的k项集
# 求该三项集的所有非空子集,1项集,2项集,直到k-1项集,用H1表示,为list类型,里面为frozenset类型,
H1 = list(freqSet)
all_subset = []
getSubset(H1, all_subset) # 生成所有的子集
calcConf(freqSet, all_subset, supportData, bigRuleList, minConf)
return bigRuleList
if __name__ == '__main__':
dataSet = data_translation
L, supportData = apriori(dataSet, minSupport = 0.02)
rule = gen_rule(L, supportData, minConf = 0.35)
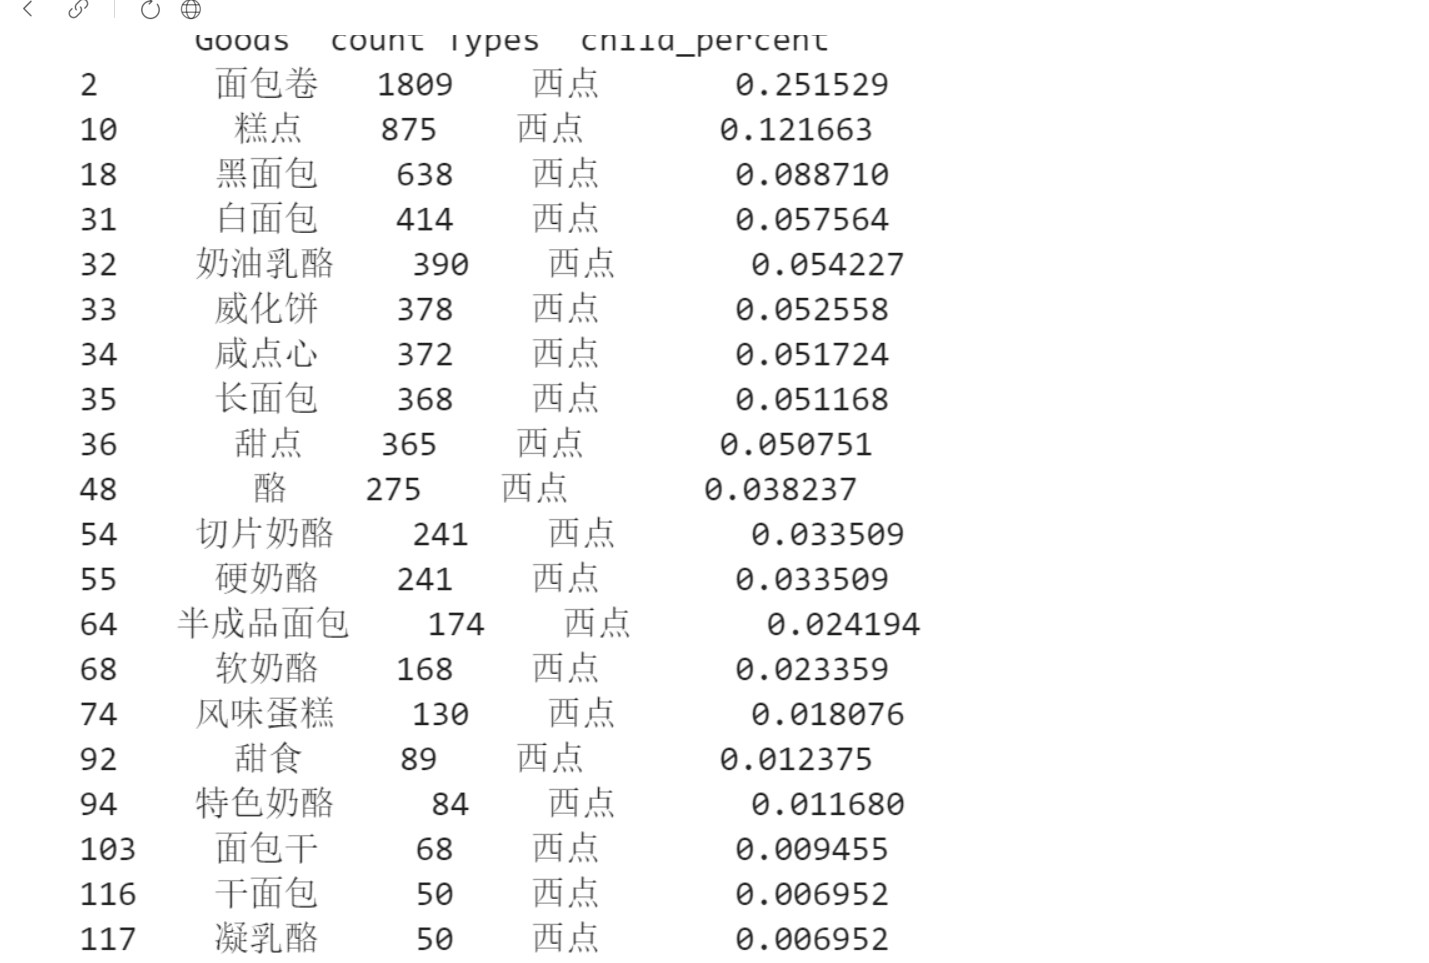
selected= sort_links.loc[sort_links['Types'] =='西点']
child_nums= selected['id'].sum()
selected['child_percent'] = selected.apply(lambda line: line['id']/child_nums,axis=1)
selected.rename(columns={'id':'count'},inplace=True)
print('西点的销量及其占比:\n',selected)
outfile2='D:/数据分析/child percent.csv'
sort_link.to_csv(outfile2,index=False,header=True,encoding='gbk')
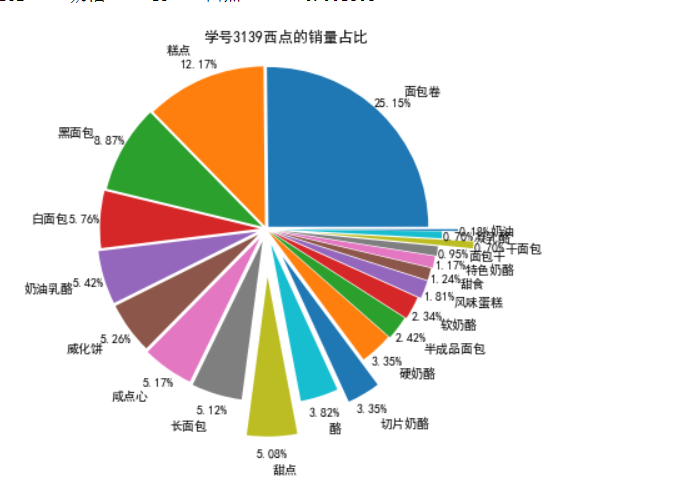
import matplotlib.pyplot as plt
data = selected['child_percent']
labels = selected['Goods']
plt.figure(figsize=(8,6))
explode = (0.02,0.02,0.03,0.04,0.06,0.06,0.07,0.08,0.3,0.1,0.2,0.02,0.03,0.04,0.06,0.06,0.07,0.08,0.3,0.1,0.2)
plt.pie(data,explode=explode,labels=labels,autopct='%1.2f%%',pctdistance=1.1,labeldistance=1.2)
plt.rcParams['font.sans-serif'] ='SimHei'
plt.title('学号3108西点的销量占比')
plt.axis('equal')
plt.savefig('D:/数据分析/child_persent.png')
plt.show()

 浙公网安备 33010602011771号