ELK(Logstash+Elasticsearch+Kibana)的原理和详细搭建
一、 Elastic Stack
Elastic Stack是ELK的官方称呼,网址:https://www.elastic.co/cn/products ,其作用是“构建在开源基础之上, Elastic Stack 让您能够安全可靠地获取任何来源、任何格式的数据,并且能够实时地对数据进行搜索、分析和可视化。”
它主要包括三个元件:
- Beats + Logstash:采集任何格式,任何来源的数据。
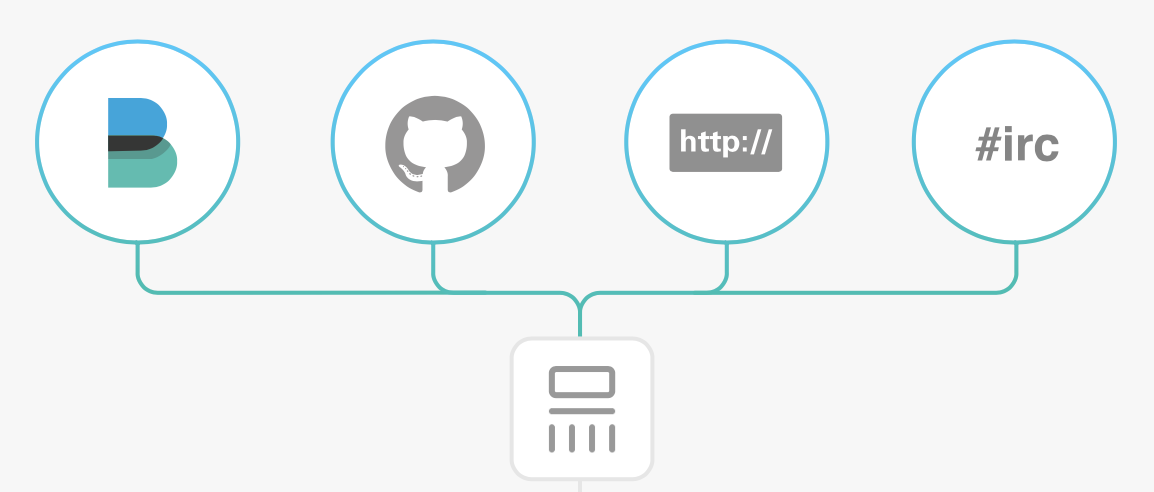
Beats: Beats 是轻量型采集器的平台,从边缘机器向 Logstash 和 Elasticsearch 发送数据。
Beats 是数据采集的得力工具。将这些采集器安装在您的服务器中,它们就会把数据汇总到 Elasticsearch。如果需要更加强大的处理性能,Beats 还能将数据输送到 Logstash进行转换和解析。官方提供了多种现成的beats以针对不同协议的数据:
Filebeat:日志文件
Metricbeat:指标
Packagebeat: 网络数据
Winlogbeat: windows时间日志
Auditbeat: 审计日志
Heartbeat: 心跳日志
beat实现可定制化:每款开源采集器都是以用于转发数据的通用库 libbeat 为基石。需要监控某个专用协议?您可以自己构建采集器。我们将为您提供所需的构建基块。
Logstash: Logstash 是动态数据收集管道,拥有可扩展的插件生态系统,能够与 Elasticsearch 产生强大的协同作用。
Logstash 是开源的服务器端数据处理管道,能够同时 从多个来源采集数据、转换数据,然后将数据发送到您最喜欢的 “存储库” 中。(我们的存储库当然是Elasticsearch。)
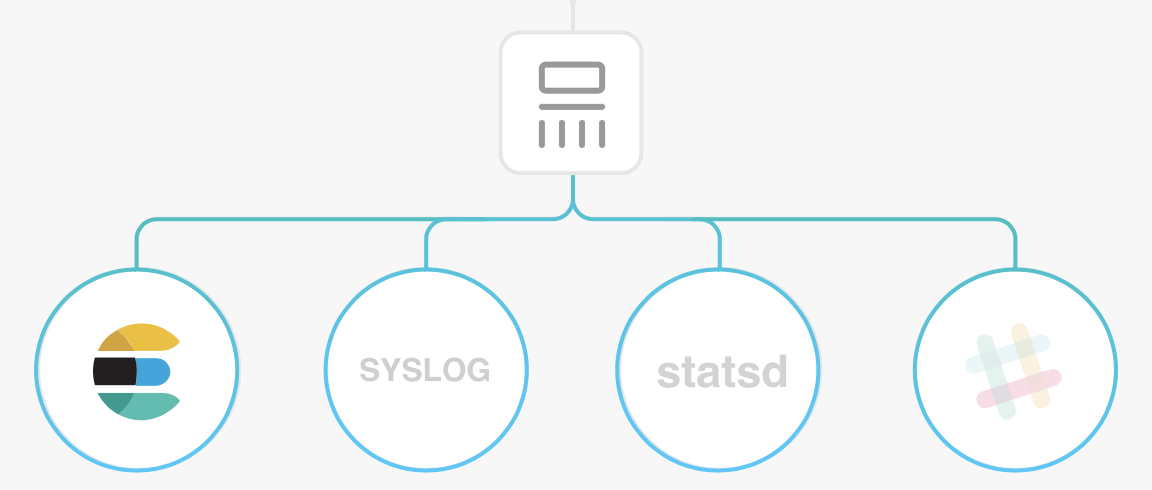
多种输入选择:数据往往以各种各样的形式,或分散或集中地存在于很多系统中。Logstash 支持各种输入选择 ,可以在同一时间从众多常用来源捕捉事件。能够以连续的流式传输方式,轻松地从您的日志、指标、Web 应用、数据存储以及各种 AWS 服务采集数据。
输出:尽管 Elasticsearch 是我们的首选输出方向,能够为我们的搜索和分析带来无限可能,但它并非唯一选择。Logstash 提供众多输出选择,您可以将数据发送到您要指定的地方,并且能够灵活地解锁众多下游用例。
过滤器:数据从源传输到存储库的过程中,Logstash 过滤器能够解析各个事件,识别已命名的字段以构建结构,并将它们转换成通用格式,以便更轻松、更快速地分析和实现商业价值。
可扩展:Logstash 采用可插拔框架,拥有 200 多个插件。您可以将不同的输入选择、过滤器和输出选择混合搭配、精心安排,让它们在管道中和谐地运行。您是从自定义应用程序采集数据?没有看到所需的插件?Logstash 插件很容易构建。我们有一个极好的插件开发 API 和插件生成器,可帮助您开始和分享您的创作。
- Elasticsearch
Elasticsearch 是一个分布式的 RESTful 风格的搜索和数据分析引擎,能够解决不断涌现出的各种用例。作为 Elastic Stack 的核心,它集中存储您的数据,帮助您发现意料之中以及意料之外的情况。
可扩展性:原型环境和生产环境可无缝切换;无论 Elasticsearch 是在一个节点上运行,还是在一个包含 300 节点的集群上运行,您都能够以相同的方式与 Elasticsearch 进行通信。
速度:而且由于每个数据都被编入了索引,因此您再也不用因为某些数据没有索引而烦心。您可以用快到令人发指的速度使用和访问您的所有数据。
- Kibana
Kibana 能够以图表的形式呈现数据,并且具有可扩展的用户界面,供您全方位配置和管理 Elastic Stack。
可视化与探索:Kibana 让您能够自由地选择如何呈现您的数据。或许您一开始并不知道自己想要什么。不过借助 Kibana 的交互式可视化,您可以先从一个问题出发,看看能够从中发现些什么。
多配件:Kibana 核心搭载了一批经典功能:柱状图、线状图、饼图、环形图,等等。它们充分利用了 Elasticsearch 的聚合功能。
二、部署准备
- 部署规划
机器两台:10.1.4.54,10.1.4.55 centos7
部署方案:
10.1.4.54:kibana,elasticsearch,logstash,filebeat
10.1.4.55:elasticsearch,logstash,filebeat
包准备:https://www.elastic.co/cn/products 下载所有相关包
安装环境:jdk1.7+,这里是1.8
三、记录安装步骤
- elasticsearch
在10.1.4.54上安装elasticsearch,新建用户elk,并上传包
sts-MacBook-Pro:Downloads garfield$ scp elasticsearch-6.3.2.tar elk@10.1.4.54:/home/elk
解压
tar -xvf elasticsearch-6.3.2.tar
修改配置文件:
vi config/elasticsearch.yml
配置文件修改:
# ======================== Elasticsearch Configuration =========================
#
# NOTE: Elasticsearch comes with reasonable defaults for most settings.
#       Before you set out to tweak and tune the configuration, make sure you
#       understand what are you trying to accomplish and the consequences.
#
# The primary way of configuring a node is via this file. This template lists
# the most important settings you may want to configure for a production cluster.
#
# Please consult the documentation for further information on configuration options:
# https://www.elastic.co/guide/en/elasticsearch/reference/index.html
#
# ---------------------------------- Cluster -----------------------------------
#
# Use a descriptive name for your cluster:
#
cluster.name: my-application
#
# ------------------------------------ Node ------------------------------------
#
# Use a descriptive name for the node:
#
node.name: node-1
#
# Add custom attributes to the node:
#
#node.attr.rack: r1
#
# ----------------------------------- Paths ------------------------------------
#
# Path to directory where to store the data (separate multiple locations by comma):
#
path.data: /home/elk/elasticsearch-6.3.2/data
#
# Path to log files:
#
path.logs: /home/elk/elasticsearch-6.3.2/logs
#
# ----------------------------------- Memory -----------------------------------
#
# Lock the memory on startup:
#
bootstrap.memory_lock: true
#
# Make sure that the heap size is set to about half the memory available
# on the system and that the owner of the process is allowed to use this
# limit.
#
# Elasticsearch performs poorly when the system is swapping the memory.
#
# ---------------------------------- Network -----------------------------------
#
# Set the bind address to a specific IP (IPv4 or IPv6):
#
network.host: 10.1.4.54
#
# Set a custom port for HTTP:
#
http.port: 9200
#
# For more information, consult the network module documentation.
#
# --------------------------------- Discovery ----------------------------------
#
# Pass an initial list of hosts to perform discovery when new node is started:
# The default list of hosts is ["127.0.0.1", "[::1]"]
# 这个配置为master广播配置,节点默认为master
discovery.zen.ping.unicast.hosts: ["10.1.4.54"]
#
# Prevent the "split brain" by configuring the majority of nodes (total number of master-eligible nodes / 2 + 1):
# 建议配置为 n/2 + 1
discovery.zen.minimum_master_nodes: 1
#
# For more information, consult the zen discovery module documentation.
#
# ---------------------------------- Gateway -----------------------------------
#
# Block initial recovery after a full cluster restart until N nodes are started:
#
#gateway.recover_after_nodes: 3
#
# For more information, consult the gateway module documentation.
#
# ---------------------------------- Various -----------------------------------
#
# Require explicit names when deleting indices:
#
#action.destructive_requires_name: true
bin目录下启动:
./elasticsearch -d
检测9200端口发现未启动成功,查看日志发现:
[2018-08-07T14:38:00,757][ERROR][o.e.b.Bootstrap          ] [node-1] node validation exception
[3] bootstrap checks failed
[1]: max file descriptors [4096] for elasticsearch process is too low, increase to at least [65536]
[2]: memory locking requested for elasticsearch process but memory is not locked
[3]: max virtual memory areas vm.max_map_count [65530] is too low, increase to at least [262144]
[2018-08-07T14:38:00,759][INFO ][o.e.n.Node               ] [node-1] stopping ...
[2018-08-07T14:38:00,795][INFO ][o.e.n.Node               ] [node-1] stopped
[2018-08-07T14:38:00,796][INFO ][o.e.n.Node               ] [node-1] closing ...
[2018-08-07T14:38:00,848][INFO ][o.e.n.Node               ] [node-1] closed
[2018-08-07T14:38:00,850][INFO ][o.e.x.m.j.p.NativeController] Native controller process has stopped - no new native processes can be started
root权限下提升一下这两个配置:
vi /etc/security/limits.conf
修改配置:
# End of file
*           soft   nofile       65536
*           hard   nofile       131072
*           soft    memlock unlimited
*           hard    memlock unlimited
*           hard    nproc   4096
*           soft    nproc   4096
重新登录后生效
再修改另一个配置:
vi /etc/sysctl.conf
修改配置:
vm.max_map_count=262144
vm.swappiness=1
再次启动,访问
http://10.1.4.54:9200
得:
{
  "name" : "node-1",
  "cluster_name" : "my-application",
  "cluster_uuid" : "hIYg-sDBToa0D4C9lzD-cQ",
  "version" : {
    "number" : "6.3.2",
    "build_flavor" : "default",
    "build_type" : "tar",
    "build_hash" : "053779d",
    "build_date" : "2018-07-20T05:20:23.451332Z",
    "build_snapshot" : false,
    "lucene_version" : "7.3.1",
    "minimum_wire_compatibility_version" : "5.6.0",
    "minimum_index_compatibility_version" : "5.0.0"
  },
  "tagline" : "You Know, for Search"
}
接着在10.1.4.55上进行同样的操作(配置文件只需节点名与ip不同即可)
elasticsearch集群搭建完毕,附常用命令地址:
查询所有数据:curl http://10.1.4.54:9200/_search?pretty
集群健康状态:curl -XGET http://10.1.4.54:9200/_cluster/health?pretty
删除所有数据:curl -X DELETE 'http://10.1.4.54:9200/_all'
删除指定索引:curl -X DELETE 'http://10.1.4.54:9200/索引名称'
- logstash
解压包:
tar -xvf logstash-6.3.2.tar
在config目录下新建配置文件stash.conf,这个配置文件用以启动时说明,logstash所收集日志的来源,内容和输出方向,分别对应input,fileter和output,下面是网上找的一个例子配置,我在后面加以理解的注释,后面再贴上我自己的例子
input {
    beats {
       port => 5044  #端口注入,来源于beat
   }
 }

 filter {
 if [type] == "app_test" { #测试日志类型
    grok {
      match => { "message" => "((?<logdate>%{YEAR}-%{MONTHNUM}-%{MONTHDAY} %{HOUR}:?%{MINUTE}(?::?%{SECOND})) %{WORD:level} (?<srcCode>\[(?:[a-zA-Z0-9-])+\]\[(?:[a-zA-Z0-9-\.])+:%{NUMBER}\]) - )?(?<srcLog>.+)"  } #匹配模式
     }
     mutate {remove_field => [ "@timestamp", "@version", "message" ]  } #字段变更
 } else if [type] == "mysql_test" { #mysql日志
   grok {
     match => { "message" => "((?<logdate>%{YEAR}-%{MONTHNUM}-%{MONTHDAY} %{HOUR}:?%{MINUTE}(?::?%{SECOND})) %{WORD:level} (?<srcCode>\[(?:[a-zA-Z0-9-])+\]\[(?:[a-zA-Z0-9-\.])+:%{NUMBER}\]) - )?(?<srcLog>.+)" } #解析规则直接写在配置文件中
    }
    mutate {remove_field => [ "@version", "message" ] }
 } else if [type] == "nginx_access_test" {
    grok {
      match => { "message" => "MAINNGINXLOG %{COMBINEDAPACHELOG} %{QS:x_forwarded_for}" }
    #MAINNGINXLOG规则写在目录$logstash/vendor/bundle/jruby/1.9/gems/logstash-patterns-core-4.0.0/patterns/中
   }
 }
 date {
     match => ["logdate", "yyyy-MM-dd HH:mm:ss.SSS"]
 }
 if "_grokparsefailure" in [tags] {

 } else {
    mutate {remove_field => [ "logdate", "@version", "message" ]  }

 }
 if !([level]) {
  mutate {
     add_field => { "level" => "other" }
   }
 }
 }

 output {
     if "_grokparsefailure" in [tags] { #过滤器解析失败时,日志写入该目录
       file { path => "/var/log/logstash/grokparsefailure-%{type}-%{+YYYY.MM.dd}.log" }
     }
     elasticsearch {  #elasticsearch目标地址
         hosts => ["10.1.4.54:9200"]
         index => "test_%{type}-%{+YYYY.MM.dd}"
         document_type => "%{type}"
         template_overwrite => true
     }
 }
三个模块内容,输入,输出和过滤器,过滤器配置了nginx,mysql,以及测试应用日志,我自己测试的只有nginx的错误日志,配置如下:
input {
    beats {
       port => 5044
   }
 }
filter {
 if [type] == "nginx-error" {
        grok {
        match => [
            "message", "(?<time>\d{4}/\d{2}/\d{2}\s{1,}\d{2}:\d{2}:\d{2})\s{1,}\[%{DATA:err_severity}\]\s{1,}(%{NUMBER:pid:int}#%{NUMBER}:\s{1,}\*%{NUMBER}|\*%{NUMBER}) %{DATA:err_message}(?:,\s{1,}client:\s{1,}(?<client_ip>%{IP}|%{HOSTNAME}))(?:,\s{1,}server:\s{1,}%{IPORHOST:server})(?:, request: %{QS:request})?(?:, host: %{QS:client_ip})?(?:, referrer: \"%{URI:referrer})?",
            "message", "(?<time>\d{4}/\d{2}/\d{2}\s{1,}\d{2}:\d{2}:\d{2})\s{1,}\[%{DATA:err_severity}\]\s{1,}%{GREEDYDATA:err_message}"]
        }
        date{
            match=>["time","yyyy/MM/dd HH:mm:ss"]
            target=>"logdate"
        }
        ruby{
            code => "event.set('logdateunix',event.get('logdate').to_i)"
        }
    }
}
output{
   elasticsearch{
        hosts => ["10.1.4.54:9200"]
        index => "logstash-nginx-%{+YYYY.MM.dd}"
    }
}
启动logstash
nohup ./bin/logstash -f config/stash.conf &
- Kibana
解压包
tar -xvf kibana-6.3.2-linux-x86_64.tar
由于我的kibana和elasticsearch 的master节点在同一台机器上,方便起见,全部保持默认配置,直接启动,包括服务端口,节点,还有elasticsearch.url配置:
# Kibana is served by a back end server. This setting specifies the port to use.
#server.port: 5601

# Specifies the address to which the Kibana server will bind. IP addresses and host names are both valid values.
# The default is 'localhost', which usually means remote machines will not be able to connect.
# To allow connections from remote users, set this parameter to a non-loopback address.
#server.host: "localhost"

# Enables you to specify a path to mount Kibana at if you are running behind a proxy.
# Use the `server.rewriteBasePath` setting to tell Kibana if it should remove the basePath
# from requests it receives, and to prevent a deprecation warning at startup.
# This setting cannot end in a slash.
#server.basePath: ""

# Specifies whether Kibana should rewrite requests that are prefixed with
# `server.basePath` or require that they are rewritten by your reverse proxy.
# This setting was effectively always `false` before Kibana 6.3 and will
# default to `true` starting in Kibana 7.0.
#server.rewriteBasePath: false

# The maximum payload size in bytes for incoming server requests.
#server.maxPayloadBytes: 1048576

# The Kibana server's name.  This is used for display purposes.
#server.name: "your-hostname"

# The URL of the Elasticsearch instance to use for all your queries.
#elasticsearch.url: "http://localhost:9200"

# When this setting's value is true Kibana uses the hostname specified in the server.host
# setting. When the value of this setting is false, Kibana uses the hostname of the host
# that connects to this Kibana instance.
#elasticsearch.preserveHost: true

# Kibana uses an index in Elasticsearch to store saved searches, visualizations and
# dashboards. Kibana creates a new index if the index doesn't already exist.
#kibana.index: ".kibana"

# The default application to load.
#kibana.defaultAppId: "home"

# If your Elasticsearch is protected with basic authentication, these settings provide
# the username and password that the Kibana server uses to perform maintenance on the Kibana
# index at startup. Your Kibana users still need to authenticate with Elasticsearch, which
# is proxied through the Kibana server.
#elasticsearch.username: "user"
#elasticsearch.password: "pass"

# Enables SSL and paths to the PEM-format SSL certificate and SSL key files, respectively.
# These settings enable SSL for outgoing requests from the Kibana server to the browser.
#server.ssl.enabled: false
#server.ssl.certificate: /path/to/your/server.crt
#server.ssl.key: /path/to/your/server.key

# Optional settings that provide the paths to the PEM-format SSL certificate and key files.
# These files validate that your Elasticsearch backend uses the same key files.
#elasticsearch.ssl.certificate: /path/to/your/client.crt
#elasticsearch.ssl.key: /path/to/your/client.key

# Optional setting that enables you to specify a path to the PEM file for the certificate
# authority for your Elasticsearch instance.
#elasticsearch.ssl.certificateAuthorities: [ "/path/to/your/CA.pem" ]

# To disregard the validity of SSL certificates, change this setting's value to 'none'.
#elasticsearch.ssl.verificationMode: full

# Time in milliseconds to wait for Elasticsearch to respond to pings. Defaults to the value of
# the elasticsearch.requestTimeout setting.
#elasticsearch.pingTimeout: 1500

# Time in milliseconds to wait for responses from the back end or Elasticsearch. This value
# must be a positive integer.
#elasticsearch.requestTimeout: 30000

# List of Kibana client-side headers to send to Elasticsearch. To send *no* client-side
# headers, set this value to [] (an empty list).
#elasticsearch.requestHeadersWhitelist: [ authorization ]

# Header names and values that are sent to Elasticsearch. Any custom headers cannot be overwritten
# by client-side headers, regardless of the elasticsearch.requestHeadersWhitelist configuration.
#elasticsearch.customHeaders: {}

# Time in milliseconds for Elasticsearch to wait for responses from shards. Set to 0 to disable.
#elasticsearch.shardTimeout: 30000

# Time in milliseconds to wait for Elasticsearch at Kibana startup before retrying.
#elasticsearch.startupTimeout: 5000

# Logs queries sent to Elasticsearch. Requires logging.verbose set to true.
#elasticsearch.logQueries: false

# Specifies the path where Kibana creates the process ID file.
#pid.file: /var/run/kibana.pid

# Enables you specify a file where Kibana stores log output.
#logging.dest: stdout

# Set the value of this setting to true to suppress all logging output.
#logging.silent: false

# Set the value of this setting to true to suppress all logging output other than error messages.
#logging.quiet: false

# Set the value of this setting to true to log all events, including system usage information
# and all requests.
#logging.verbose: false

# Set the interval in milliseconds to sample system and process performance
# metrics. Minimum is 100ms. Defaults to 5000.
#ops.interval: 5000

# The default locale. This locale can be used in certain circumstances to substitute any missing
# translations.
#i18n.defaultLocale: "en"
启动
nohup ./bin/kibana &
额,启动失败:
{"type":"log","@timestamp":"2018-08-15T08:33:23Z","tags":["warning","elasticsearch","admin"],"pid":28642,"message":"No living connections"}
{"type":"log","@timestamp":"2018-08-15T08:33:25Z","tags":["warning","elasticsearch","admin"],"pid":28642,"message":"Unable to revive connection: http://localhost:9200/"}
{"type":"log","@timestamp":"2018-08-15T08:33:25Z","tags":["warning","elasticsearch","admin"],"pid":28642,"message":"No living connections"}
{"type":"log","@timestamp":"2018-08-15T08:33:27Z","tags":["warning","elasticsearch","data"],"pid":28642,"message":"Unable to revive connection: http://localhost:9200/"}
连不上这个地址,可能localhost识别有问题,我们重新修改一下配置,改一下服务ip和elasticsearch地址:
# Specifies the address to which the Kibana server will bind. IP addresses and host names are both valid values.
# The default is 'localhost', which usually means remote machines will not be able to connect.
# To allow connections from remote users, set this parameter to a non-loopback address.
server.host: "10.1.4.54"

# Enables you to specify a path to mount Kibana at if you are running behind a proxy.
# Use the `server.rewriteBasePath` setting to tell Kibana if it should remove the basePath
# from requests it receives, and to prevent a deprecation warning at startup.
# This setting cannot end in a slash.
#server.basePath: ""

# Specifies whether Kibana should rewrite requests that are prefixed with
# `server.basePath` or require that they are rewritten by your reverse proxy.
# This setting was effectively always `false` before Kibana 6.3 and will
# default to `true` starting in Kibana 7.0.
#server.rewriteBasePath: false

# The maximum payload size in bytes for incoming server requests.
#server.maxPayloadBytes: 1048576

# The Kibana server's name.  This is used for display purposes.
#server.name: "your-hostname"

# The URL of the Elasticsearch instance to use for all your queries.
elasticsearch.url: "http://10.1.4.54:9200"
再次启动并验证:http://10.1.4.54:5601

- filebeat
解压:
[elk@localhost ~]$ tar -xvf filebeat-6.3.2-linux-x86_64.tar
更改配置filebeat.yml,与logstash类似,filebeat也是可以对日志做一些简单配置和过滤的,如下说明:
#filebeat#
filebeat.prospectors:
#nginx
- input_type: log
  enable: yes
  #tags: nginx-error
  paths:
    - /home/elk/filebeat-6.3.2-linux-x86_64/nginx/error/error*.log  #paths指定要监控的日志
  document_type: nginx-error  # i设定Elasticsearch输出时的document的type字段也可以用来给日志进行分类。Default: log
  exclude_lines: ["^$"] # 在输入中排除符合正则表达式列表的那些行
  fields:   # 向输出的每一条日志添加额外的信息比如“level:debug”方便后续对日志进行分组统计。默认情况下会在输出信息的fields子目录下以指定的新增fields建立子目录例如fields.level。
    type: "nginx-error"
  fields_under_root: true   # 如果该选项设置为true则新增fields成为顶级目录而不是将其放在fields目录下。自定义的field会覆盖filebeat默认的field

output.logstash:
  hosts: ["10.1.4.54:5044"]
  #index: filebeat  # 输出数据到指定index default is "filebeat"  可以使用变量[filebeat-]YYYY.MM.DD keys.
启动:
nohup ./filebeat &
操作kibana:打开页面,在页面中Management中添加Index Pattern,
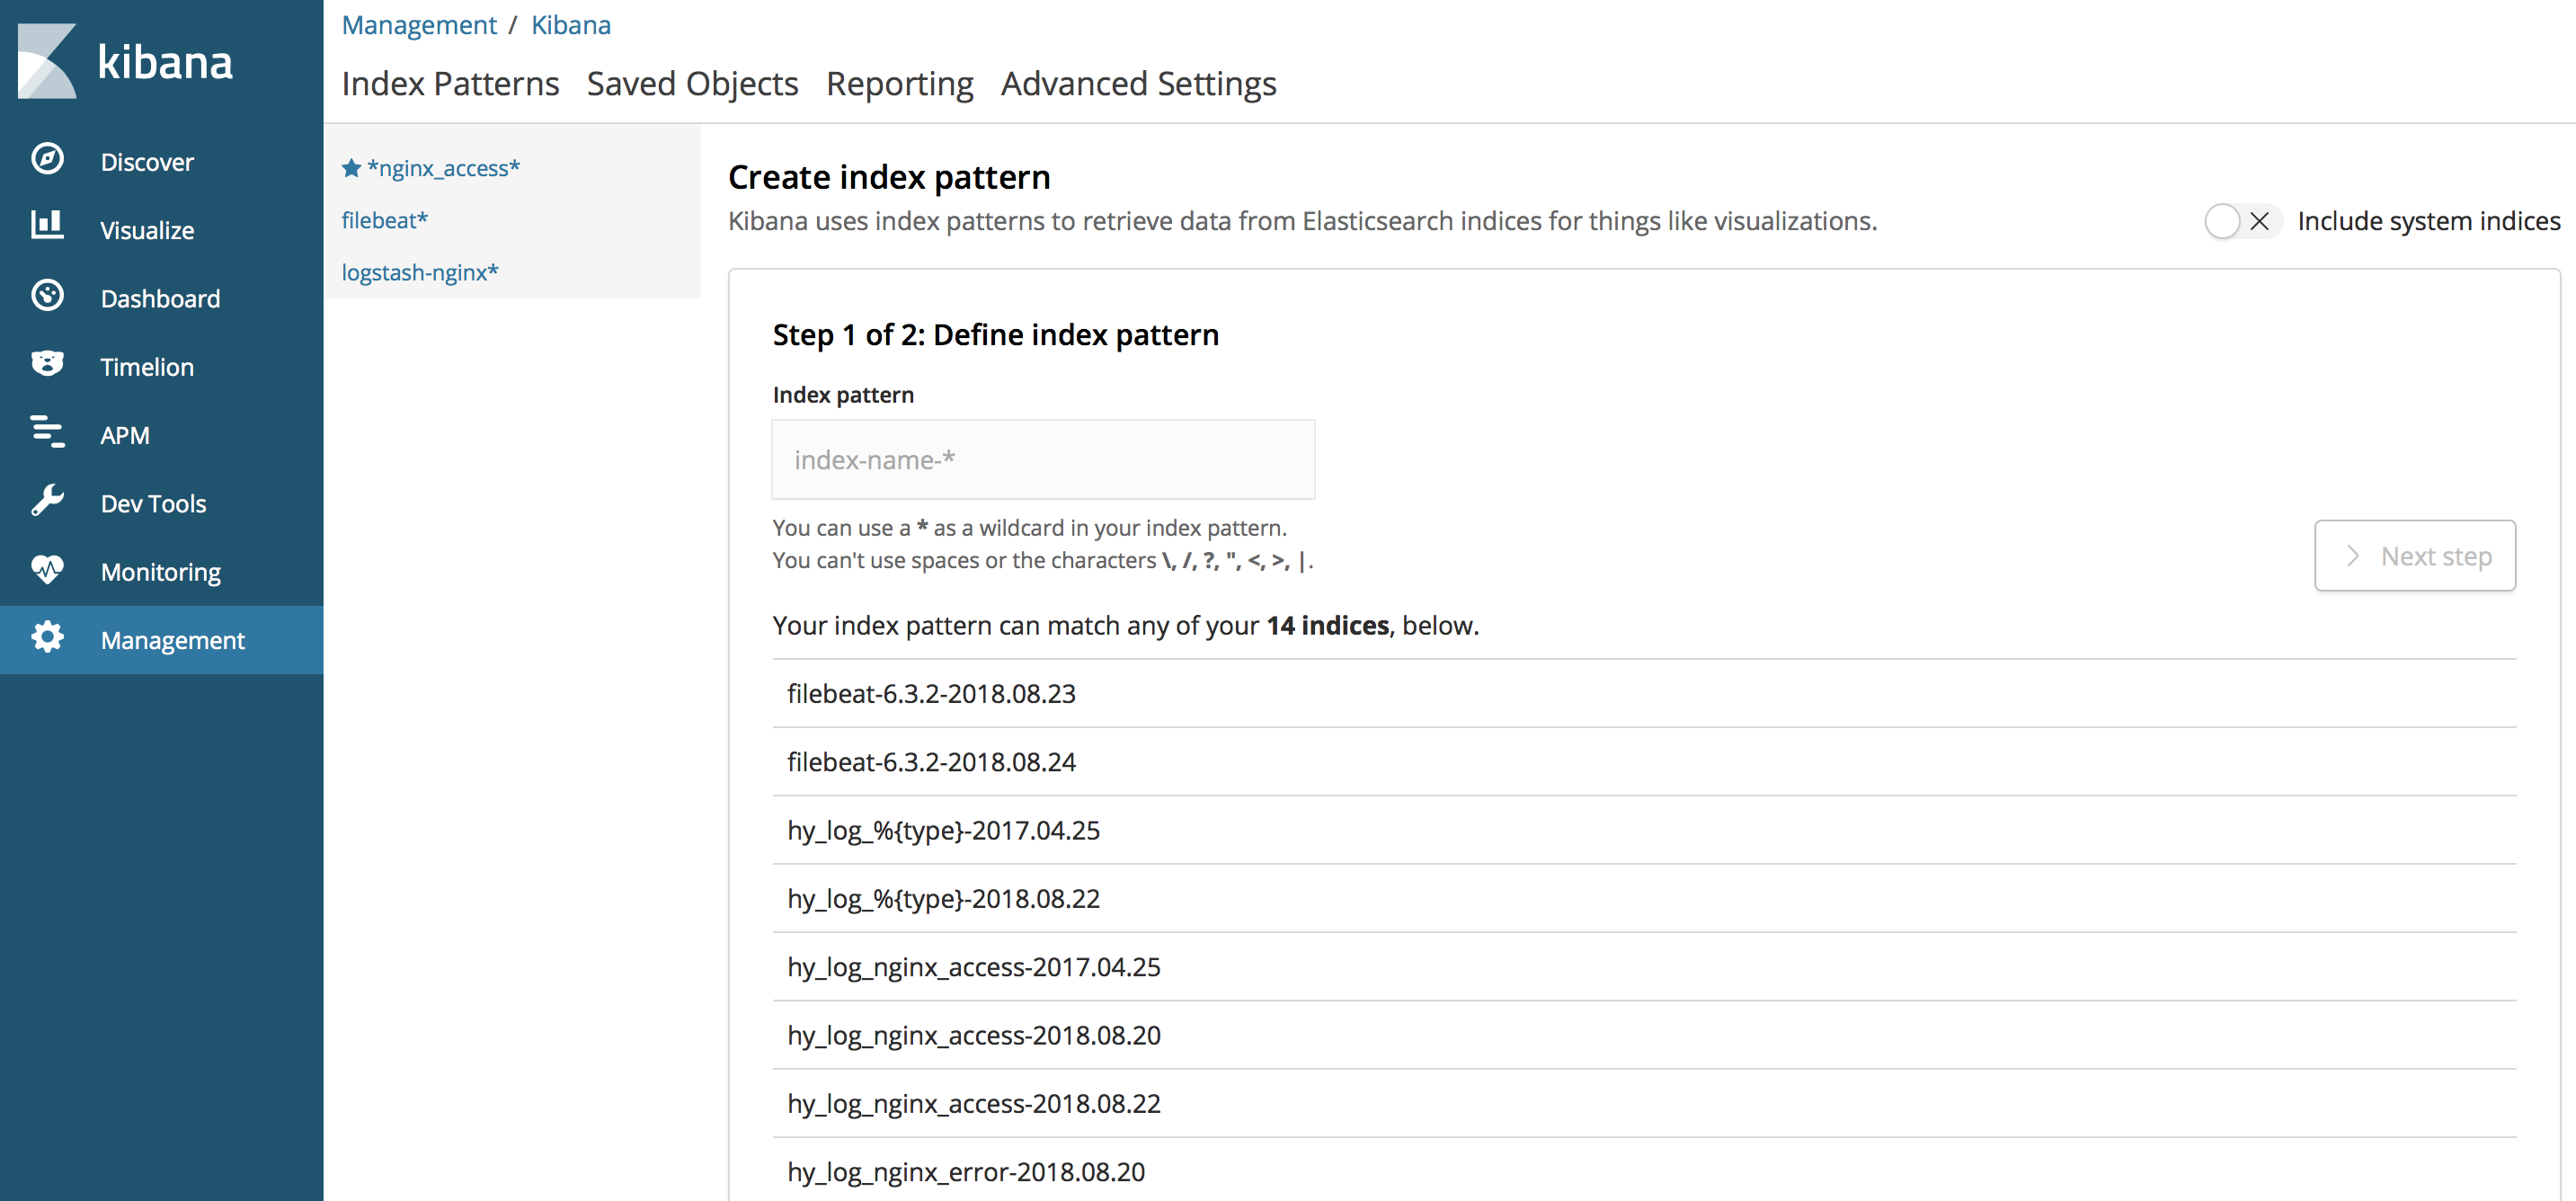
输入index pattern,这个名字与logstash中配置的index相同或包括,这样就得到了一个样例,之后,把准备的nginx错误日志放入相应目录,也就是filebeat配置的目录中:
[elk@test error]$ ls
error11.log  error13.log  error1.log  error2.log  error5.log  error6.log  error7.log  error.log
尴尬的是,我的kibana,discover中并没有显示出日志,还是很空白,查看了logstash和elasticsearch日志后发现,报错了:
[2018-08-24T13:55:34,727][DEBUG][o.e.a.b.TransportShardBulkAction] [logstash-nginx-2018.08.24][4] failed to execute bulk item (index) BulkShardRequest [[logstash-nginx-2018.08.24][4]] containing [17] requests
org.elasticsearch.index.mapper.MapperParsingException: failed to parse [host]
        at org.elasticsearch.index.mapper.FieldMapper.parse(FieldMapper.java:302) ~[elasticsearch-6.3.2.jar:6.3.2]
        at org.elasticsearch.index.mapper.DocumentParser.parseObjectOrField(DocumentParser.java:481) ~[elasticsearch-6.3.2.jar:6.3.2]
        at org.elasticsearch.index.mapper.DocumentParser.parseObject(DocumentParser.java:496) ~[elasticsearch-6.3.2.jar:6.3.2]
        at org.elasticsearch.index.mapper.DocumentParser.innerParseObject(DocumentParser.java:390) ~[elasticsearch-6.3.2.jar:6.3.2]
        at org.elasticsearch.index.mapper.DocumentParser.parseObjectOrNested(DocumentParser.java:380) ~[elasticsearch-6.3.2.jar:6.3.2]
        at org.elasticsearch.index.mapper.DocumentParser.internalParseDocument(DocumentParser.java:95) ~[elasticsearch-6.3.2.jar:6.3.2]
        at org.elasticsearch.index.mapper.DocumentParser.parseDocument(DocumentParser.java:69) ~[elasticsearch-6.3.2.jar:6.3.2]
        at org.elasticsearch.index.mapper.DocumentMapper.parse(DocumentMapper.java:261) ~[elasticsearch-6.3.2.jar:6.3.2]
        at org.elasticsearch.index.shard.IndexShard.prepareIndex(IndexShard.java:708) ~[elasticsearch-6.3.2.jar:6.3.2]
        at org.elasticsearch.index.shard.IndexShard.applyIndexOperation(IndexShard.java:685) ~[elasticsearch-6.3.2.jar:6.3.2]
        at org.elasticsearch.index.shard.IndexShard.applyIndexOperationOnPrimary(IndexShard.java:666) ~[elasticsearch-6.3.2.jar:6.3.2]
        at org.elasticsearch.action.bulk.TransportShardBulkAction.lambda$executeIndexRequestOnPrimary$2(TransportShardBulkAction.java:553) ~[elasticsearch-6.3.2.jar:6.3.2]
        at org.elasticsearch.action.bulk.TransportShardBulkAction.executeOnPrimaryWhileHandlingMappingUpdates(TransportShardBulkAction.java:572) ~[elasticsearch-6.3.2.jar:6.3.2]
        at org.elasticsearch.action.bulk.TransportShardBulkAction.executeIndexRequestOnPrimary(TransportShardBulkAction.java:551) ~[elasticsearch-6.3.2.jar:6.3.2]
        at org.elasticsearch.action.bulk.TransportShardBulkAction.executeIndexRequest(TransportShardBulkAction.java:142) [elasticsearch-6.3.2.jar:6.3.2]
        at org.elasticsearch.action.bulk.TransportShardBulkAction.executeBulkItemRequest(TransportShardBulkAction.java:248) [elasticsearch-6.3.2.jar:6.3.2]
        at org.elasticsearch.action.bulk.TransportShardBulkAction.performOnPrimary(TransportShardBulkAction.java:125) [elasticsearch-6.3.2.jar:6.3.2]
        at org.elasticsearch.action.bulk.TransportShardBulkAction.shardOperationOnPrimary(TransportShardBulkAction.java:112) [elasticsearch-6.3.2.jar:6.3.2]
        at org.elasticsearch.action.bulk.TransportShardBulkAction.shardOperationOnPrimary(TransportShardBulkAction.java:74) [elasticsearch-6.3.2.jar:6.3.2]
        at org.elasticsearch.action.support.replication.TransportReplicationAction$PrimaryShardReference.perform(TransportReplicationAction.java:1018) [elasticsearch-6.3.2.jar:6.3.2]
        at org.elasticsearch.action.support.replication.TransportReplicationAction$PrimaryShardReference.perform(TransportReplicationAction.java:996) [elasticsearch-6.3.2.jar:6.3.2]
        at org.elasticsearch.action.support.replication.ReplicationOperation.execute(ReplicationOperation.java:103) [elasticsearch-6.3.2.jar:6.3.2]
        at org.elasticsearch.action.support.replication.TransportReplicationAction$AsyncPrimaryAction.onResponse(TransportReplicationAction.java:357) [elasticsearch-6.3.2.jar:6.3.2]
        at org.elasticsearch.action.support.replication.TransportReplicationAction$AsyncPrimaryAction.onResponse(TransportReplicationAction.java:297) [elasticsearch-6.3.2.jar:6.3.2]
        at org.elasticsearch.action.support.replication.TransportReplicationAction$1.onResponse(TransportReplicationAction.java:959) [elasticsearch-6.3.2.jar:6.3.2]
        at org.elasticsearch.action.support.replication.TransportReplicationAction$1.onResponse(TransportReplicationAction.java:956) [elasticsearch-6.3.2.jar:6.3.2]
        at org.elasticsearch.index.shard.IndexShardOperationPermits.acquire(IndexShardOperationPermits.java:270) [elasticsearch-6.3.2.jar:6.3.2]
        at org.elasticsearch.index.shard.IndexShardOperationPermits.acquire(IndexShardOperationPermits.java:237) [elasticsearch-6.3.2.jar:6.3.2]
        at org.elasticsearch.index.shard.IndexShard.acquirePrimaryOperationPermit(IndexShard.java:2221) [elasticsearch-6.3.2.jar:6.3.2]
        at org.elasticsearch.action.support.replication.TransportReplicationAction.acquirePrimaryShardReference(TransportReplicationAction.java:968) [elasticsearch-6.3.2.jar:6.3.2]
        at org.elasticsearch.action.support.replication.TransportReplicationAction.access$500(TransportReplicationAction.java:98) [elasticsearch-6.3.2.jar:6.3.2]
        at org.elasticsearch.action.support.replication.TransportReplicationAction$AsyncPrimaryAction.doRun(TransportReplicationAction.java:318) [elasticsearch-6.3.2.jar:6.3.2]
        at org.elasticsearch.common.util.concurrent.AbstractRunnable.run(AbstractRunnable.java:37) [elasticsearch-6.3.2.jar:6.3.2]
        at org.elasticsearch.action.support.replication.TransportReplicationAction$PrimaryOperationTransportHandler.messageReceived(TransportReplicationAction.java:293) [elasticsearch-6.3.2.jar:6.3.2]
        at org.elasticsearch.action.support.replication.TransportReplicationAction$PrimaryOperationTransportHandler.messageReceived(TransportReplicationAction.java:280) [elasticsearch-6.3.2.jar:6.3.2]
        at org.elasticsearch.xpack.security.transport.SecurityServerTransportInterceptor$ProfileSecuredRequestHandler$1.doRun(SecurityServerTransportInterceptor.java:259) [x-pack-security-6.3.2.jar:6.3.2]
        at org.elasticsearch.common.util.concurrent.AbstractRunnable.run(AbstractRunnable.java:37) [elasticsearch-6.3.2.jar:6.3.2]
        at org.elasticsearch.xpack.security.transport.SecurityServerTransportInterceptor$ProfileSecuredRequestHandler.messageReceived(SecurityServerTransportInterceptor.java:317) [x-pack-security-6.3.2.jar:6.3.2]
        at org.elasticsearch.transport.RequestHandlerRegistry.processMessageReceived(RequestHandlerRegistry.java:66) [elasticsearch-6.3.2.jar:6.3.2]
        at org.elasticsearch.transport.TransportService$7.doRun(TransportService.java:664) [elasticsearch-6.3.2.jar:6.3.2]
        at org.elasticsearch.common.util.concurrent.ThreadContext$ContextPreservingAbstractRunnable.doRun(ThreadContext.java:725) [elasticsearch-6.3.2.jar:6.3.2]
        at org.elasticsearch.common.util.concurrent.AbstractRunnable.run(AbstractRunnable.java:37) [elasticsearch-6.3.2.jar:6.3.2]
        at java.util.concurrent.ThreadPoolExecutor.runWorker(ThreadPoolExecutor.java:1142) [?:1.8.0_102]
        at java.util.concurrent.ThreadPoolExecutor$Worker.run(ThreadPoolExecutor.java:617) [?:1.8.0_102]
        at java.lang.Thread.run(Thread.java:745) [?:1.8.0_102]
Caused by: java.lang.IllegalStateException: Can't get text on a START_OBJECT at 1:205
        at org.elasticsearch.common.xcontent.json.JsonXContentParser.text(JsonXContentParser.java:86) ~[elasticsearch-x-content-6.3.2.jar:6.3.2]
        at org.elasticsearch.common.xcontent.support.AbstractXContentParser.textOrNull(AbstractXContentParser.java:269) ~[elasticsearch-x-content-6.3.2.jar:6.3.2]
        at org.elasticsearch.index.mapper.TextFieldMapper.parseCreateField(TextFieldMapper.java:564) ~[elasticsearch-6.3.2.jar:6.3.2]
        at org.elasticsearch.index.mapper.FieldMapper.parse(FieldMapper.java:297) ~[elasticsearch-6.3.2.jar:6.3.2]
        ... 44 more
[2018-08-24T13:55:34,718][DEBUG][o.e.a.b.TransportShardBulkAction] [logstash-nginx-2018.08.24][4] failed to execute bulk item (index) BulkShardRequest [[logstash-nginx-2018.08.24][4]] containing [34] requests
org.elasticsearch.index.mapper.MapperParsingException: failed to parse [host]
可以看出,是有一个host字段解析不明白,这个问题死活搞不定,经过更改解析正则,更改日志一顿折腾之后,日志中终于打印出了应有的东西:
[2018-08-24T14:42:54,642][DEBUG][o.e.a.b.TransportShardBulkAction] [logstash-nginx-2018.08.24][3] failed to execute bulk item (index) BulkShardRequest [[logstash-nginx-2018.08.24][3]] containing [index {[logstash-nginx-2018.08.24][doc][2XeramUBZh4nWTGM5PIx], source[{"@version":"1","message":"2018/08/20 12:05:35 [error] 14965#0: *8117 connect() failed (111: Connection refused) while connecting to upstream, client: 111.207.251.32, server: localhost, request: \"POST /dc/v1/token/updateToken HTTP/1.1\", upstream: \"http://10.1.0.170:7077/dc/v1/token/updateToken\"","err_message":"14965#0: *8117 connect() failed (111: Connection refused) while connecting to upstream, client: 111.207.251.32, server: localhost, request: \"POST /dc/v1/token/updateToken HTTP/1.1\", upstream: \"http://10.1.0.170:7077/dc/v1/token/updateToken\"","@timestamp":"2018-08-24T06:42:52.521Z","offset":0,"logdate":"2018-08-20T04:05:35.000Z","logdateunix":1534737935,"type":"nginx-error","err_severity":"error","beat":{"hostname":"test","version":"6.3.2","name":"test"},"source":"/home/elk/filebeat-6.3.2-linux-x86_64/nginx/error/error119.log","tags":["beats_input_codec_plain_applied"],"time":"2018/08/20 12:05:35","host":{"name":"test"}}]}]
org.elasticsearch.index.mapper.MapperParsingException: failed to parse [host]
        at org.elasticsearch.index.mapper.FieldMapper.parse(FieldMapper.java:302) ~[elasticsearch-6.3.2.jar:6.3.2]
东西内容都没有问题,但是最后有一个字段叫host,name为test,查询了一下,主机名刚好为test,说明原有的解析并不适用,后来在elasticsearch社区中也找到了问题根源:https://elasticsearch.cn/question/4671 ,原来这是6.30以上版本的特有操作,修改logstash配置文件后重启:
input {
    beats {
       port => 5044
   }
 }
filter {
 if [type] == "nginx-error" {
        grok {
        match => [
             "message", "(?<time>\d{4}/\d{2}/\d{2}\s{1,}\d{2}:\d{2}:\d{2})\s{1,}\[%{DATA:err_severity}\]\s{1,}(%{NUMBER:pid:int}#%{NUMBER}:\s{1,}\*%{NUMBER}|\*%{NUMBER}) %{DATA:err_message}(?:,\s{1,}client:\s{1,}(?<client_ip>%{IP}|%{HOSTNAME}))(?:,\s{1,}server:\s{1,}%{IPORHOST:server})(?:, request: %{QS:request})?(?:, host: %{QS:client_ip})?(?:, referrer: \"%{URI:referrer})?",
            "message", "(?<time>\d{4}/\d{2}/\d{2}\s{1,}\d{2}:\d{2}:\d{2})\s{1,}\[%{DATA:err_severity}\]\s{1,}%{GREEDYDATA:err_message}"]
        }
        mutate {
             rename => { "[host][name]" => "host" }
        }
        date{
            match=>["time","yyyy/MM/dd HH:mm:ss"]
            target=>"logdate"
        }
        ruby{
            code => "event.set('logdateunix',event.get('logdate').to_i)"
        }
    }
}
output{
   elasticsearch{
        hosts => ["10.1.4.54:9200"]
        index => "logstash-nginx-%{+YYYY.MM.dd}"
    }
}
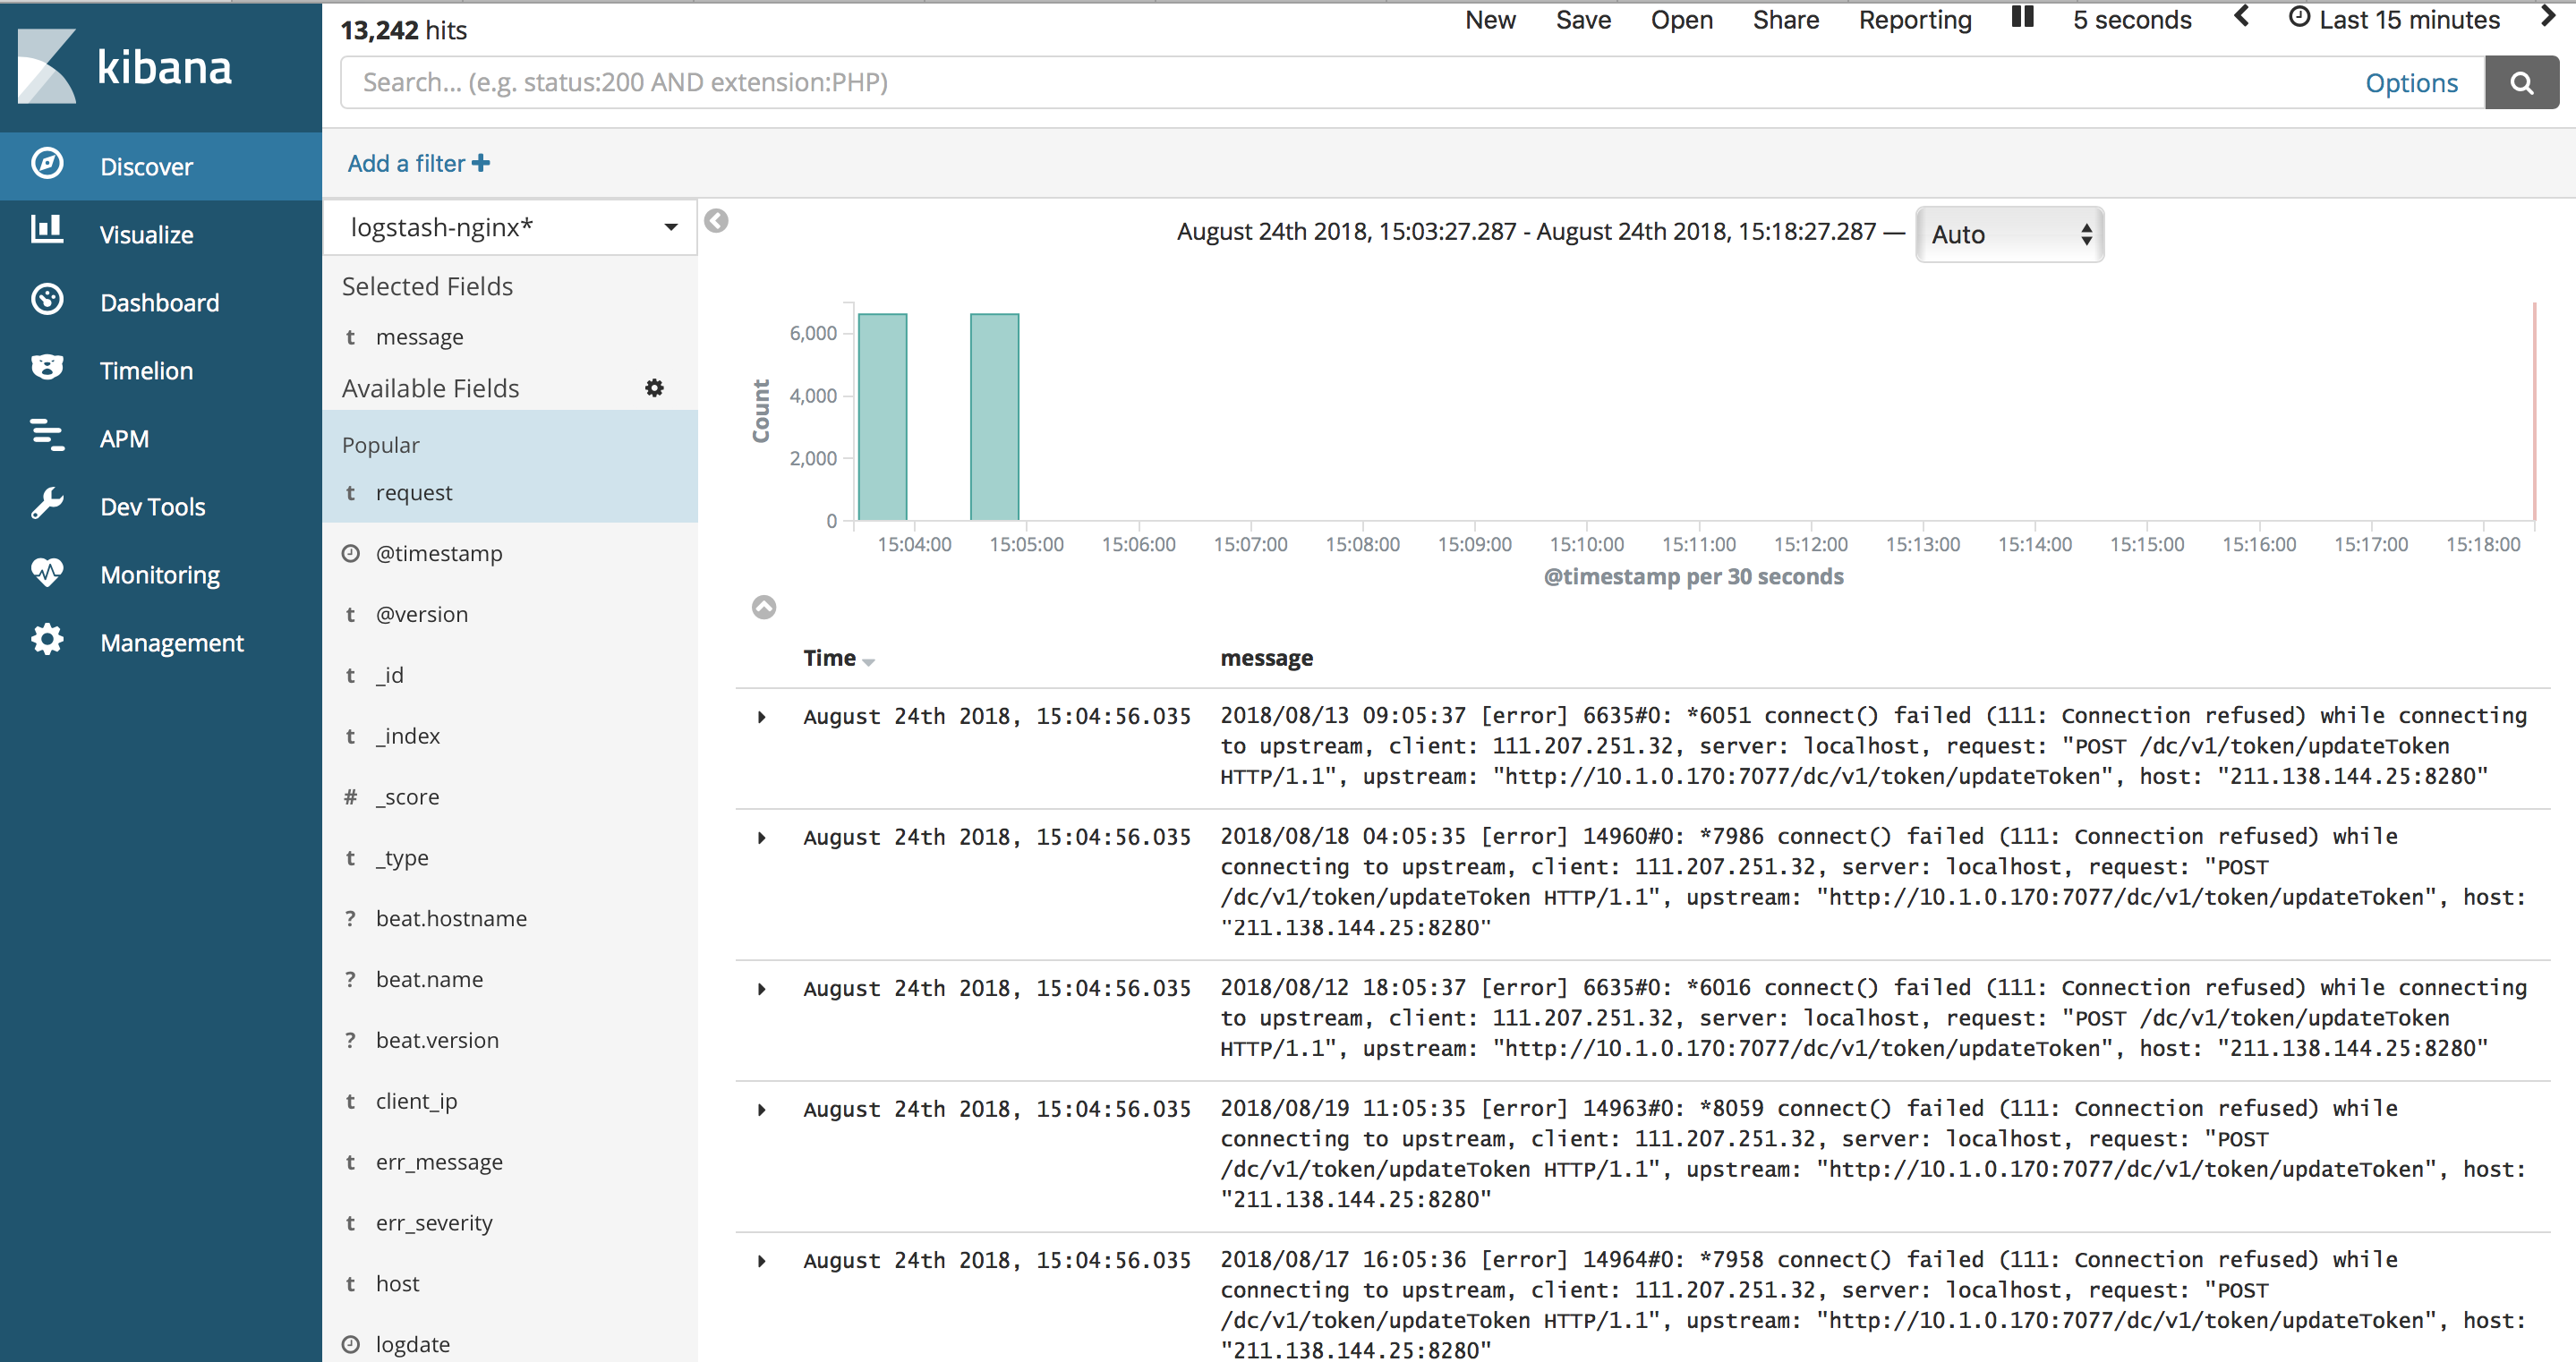
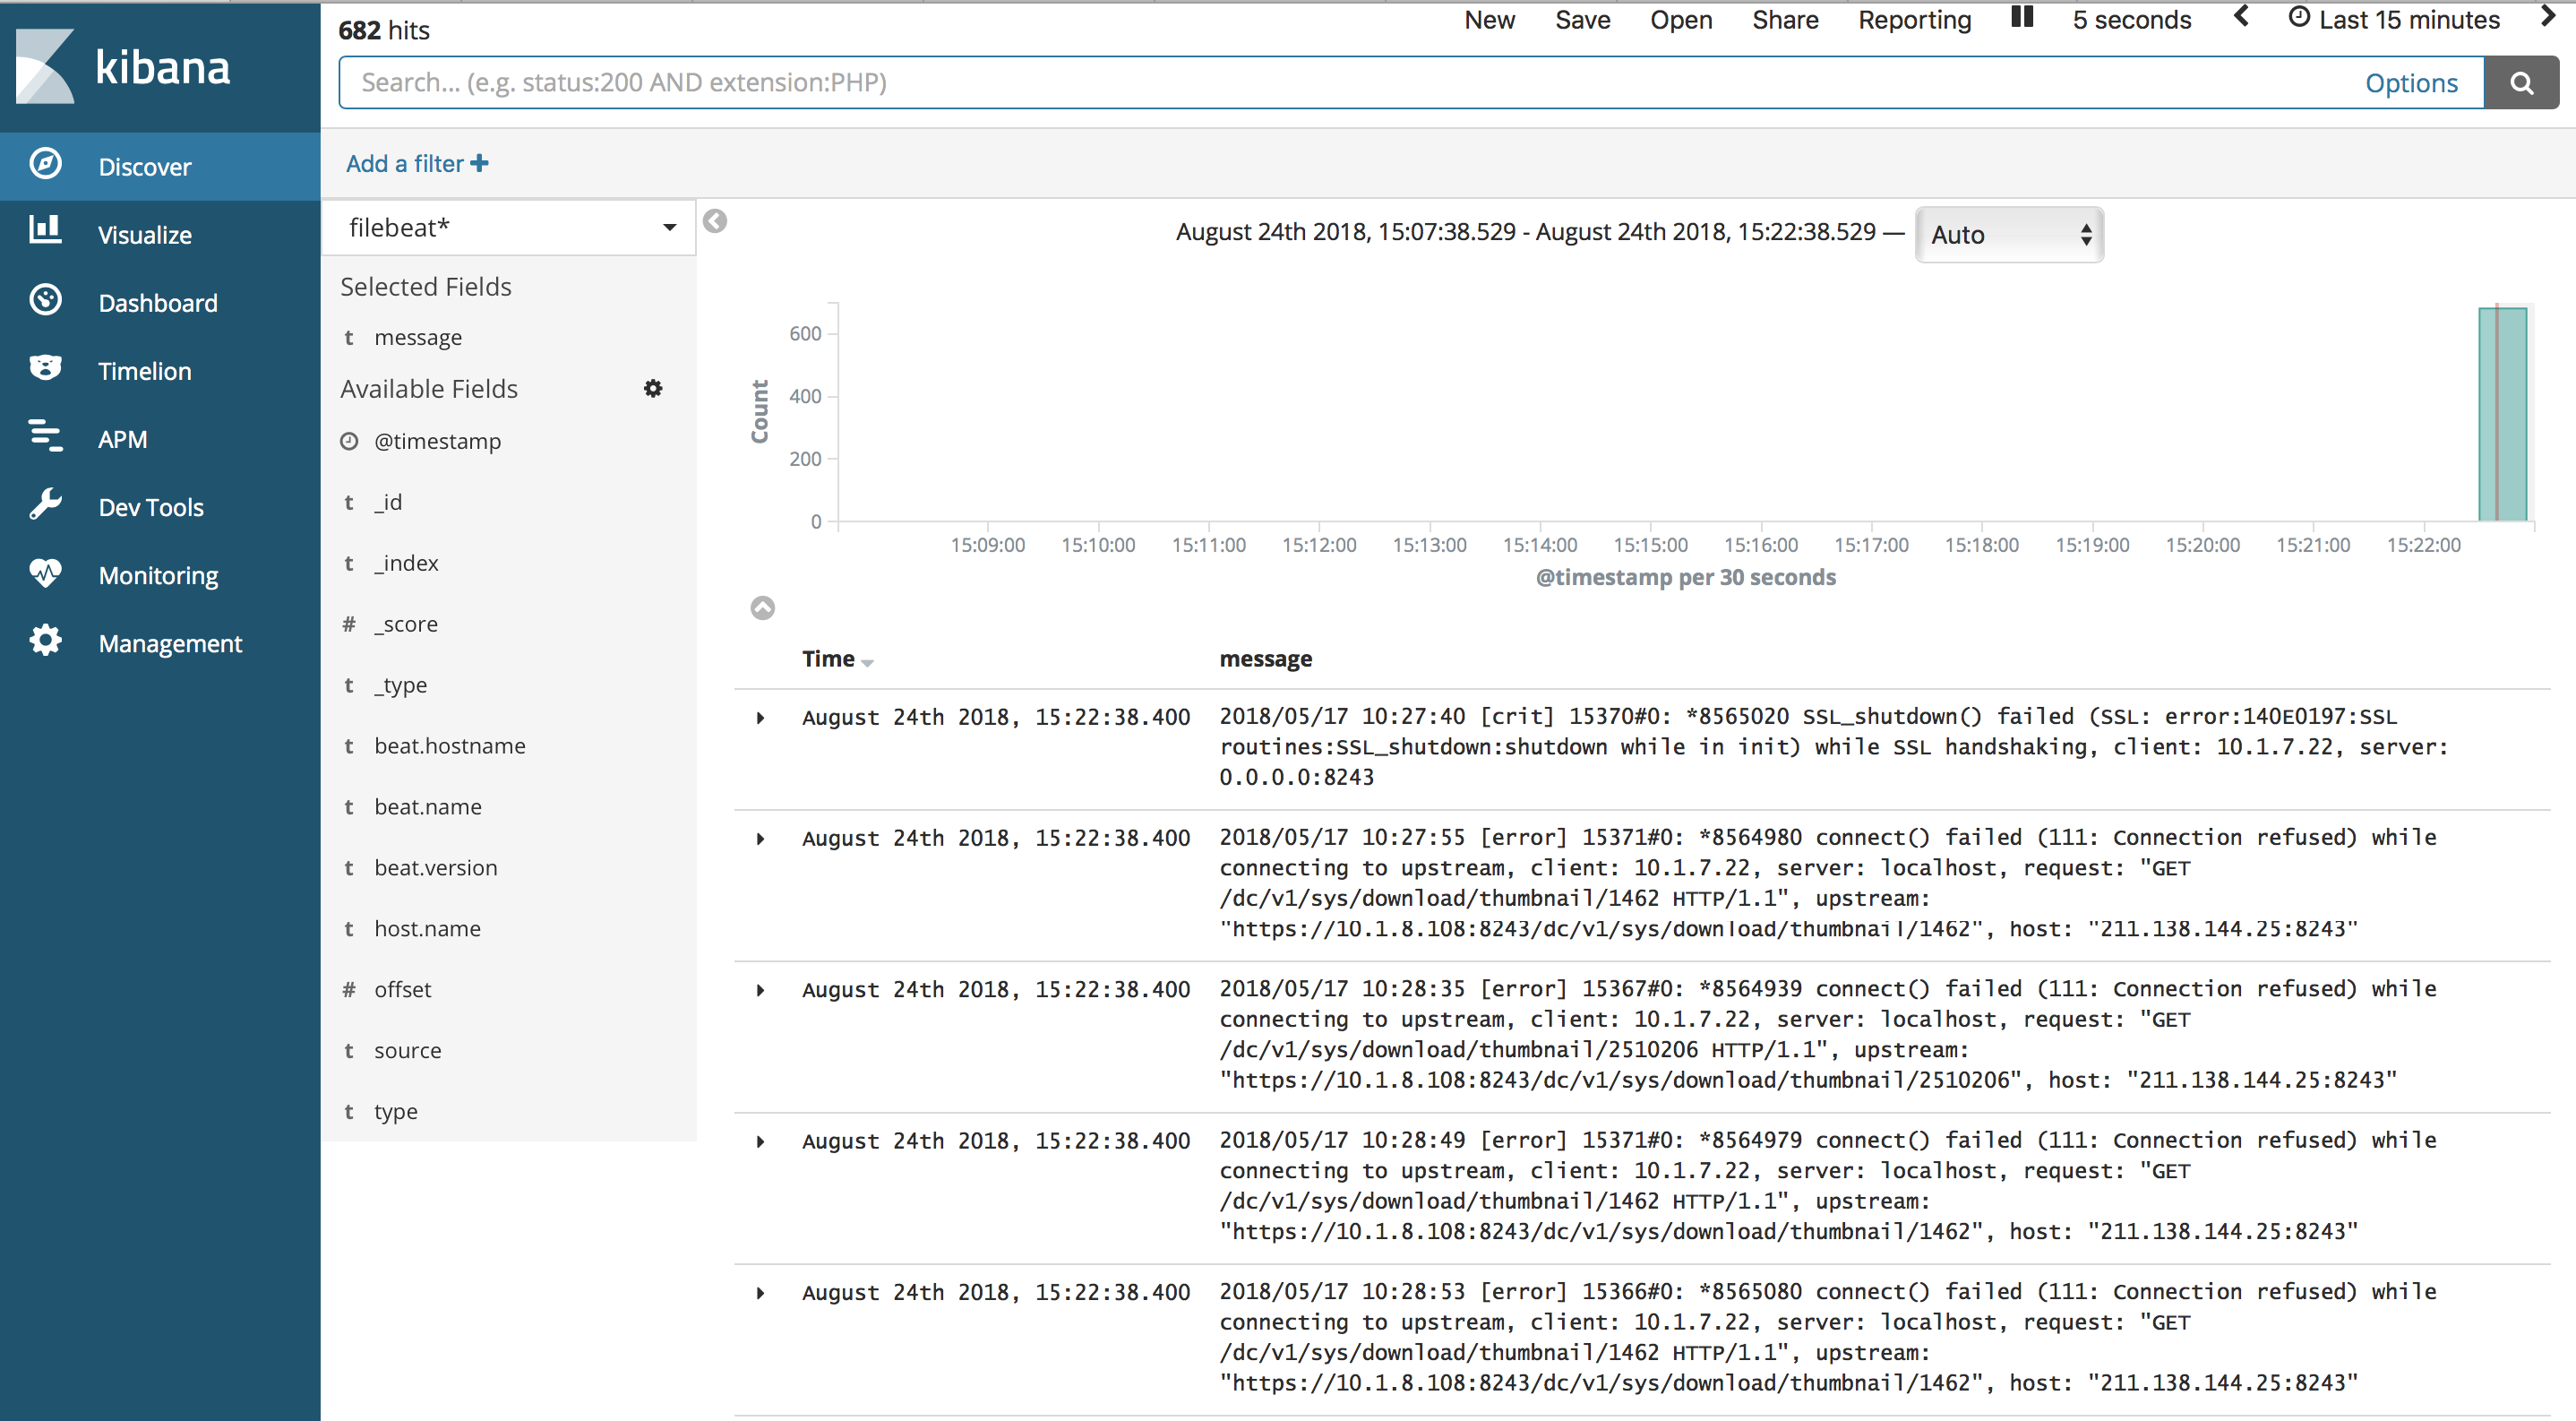
最终看到日志正常显示:
四、变更
logstash获取源由beat改为文件路径获取,部署在10.1.4.55,将logstash包拷贝到10.1.4.55,并修改配置文件config/nginx.conf并启动
input {
    file {
    type => "nginx-error"
    path => [ "/home/elk/filebeat-6.3.2-linux-x86_64/nginx/error/error*.log" ]
    tags => [ "nginx","error"]
    start_position => beginning
}
}
filter {
     if [type] == "nginx-error" {
        grok {
        match => [
            "message", "(?<time>\d{4}/\d{2}/\d{2}\s{1,}\d{2}:\d{2}:\d{2})\s{1,}\[%{DATA:err_severity}\]\s{1,}(%{NUMBER:pid:int}#%{NUMBER}:\s{1,}\*%{NUMBER}|\*%{NUMBER}) %{DATA:err_message}(?:,\s{1,}client:\s{1,}(?<client_ip>%{IP}|%{HOSTNAME}))(?:,\s{1,}server:\s{1,}%{IPORHOST:server})(?:, request: %{QS:request})?(?:, host: %{QS:client_ip})?(?:, referrer: \"%{URI:referrer})?",
            "message", "(?<time>\d{4}/\d{2}/\d{2}\s{1,}\d{2}:\d{2}:\d{2})\s{1,}\[%{DATA:err_severity}\]\s{1,}%{GREEDYDATA:err_message}"]
        }
        date{
            match=>["time","yyyy/MM/dd HH:mm:ss"]
            target=>"logdate"
        }
        ruby{
            code => "event.set('logdateunix',event.get('logdate').to_i)"
        }
    }
}
output{
   elasticsearch{
        hosts => ["10.1.4.54:9200"]
        index => "logstash-nginx-%{+YYYY.MM.dd}"
    }
}
在 /home/elk/filebeat-6.3.2-linux-x86_64/nginx/error/ 目录中添加一个错误日志,error11.log,可以看到kibana页面发生了变化:

说明按照目录导入了日志
filebeat也可以直接导入 ,修改配置文件并启动:
#filebeat#
filebeat.prospectors:
#nginx
- input_type: log
  enable: yes
  #tags: nginx-error
  paths:
    - /home/elk/filebeat-6.3.2-linux-x86_64/nginx/error/error*.log
  document_type: nginx-error
  exclude_lines: ["^$"]
  fields:
    type: "nginx-error"
  fields_under_root: true
output.elasticsearch:
  hosts: ["10.1.4.54:9200"]
  #index: filebeat
查看kibana页面
五、拓展,x-pack
待续...

 浙公网安备 33010602011771号