

MySQL Execution Plan--Index Merge导致查询预估行数不准问题
INDEX MERGE导致的查询预估行数不准问题
问题描述
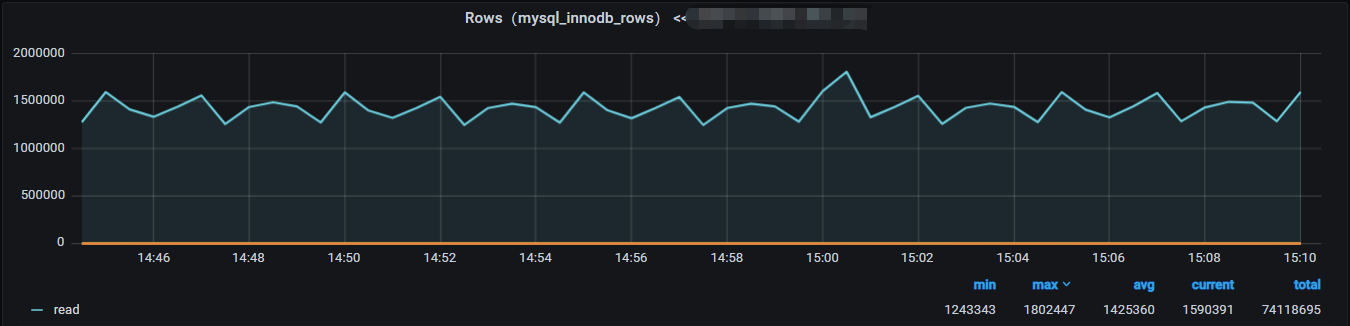
某业务集群实例每秒读取记录数长时间很高(每秒超过150万):
抓取135秒全量慢日志分析,按照预估行数排序得到:
****************************************************************************************************
执行占比:    69.14% (按sum_examined_rows)
指纹SQL:    use f_scp_dashboard; select * from persistence_info where '?' = '?' and app_code = '?' and
status = '?' ;
指纹MD5:    939b039584a4343cc75c0aa0ccc2285d
示例SQL:    use f_scp_dashboard; select * from persistence_info where 1=1 and app_code = 'b_order_user'
 and status = 1;
执行次数:    74992
平均/汇总预估行数:    8 / 655830
平均/汇总影响行数:    0 / 0
平均/汇总查询时间:    0 / 40536
平均/汇总返回行数:    8 / 624469
平均/汇总阻塞时间:    0 / 0
平均/汇总返回字节:    4862 / 364640686
****************************************************************************************************
执行占比:    20.02% (按sum_examined_rows)
指纹SQL:    use f_scp_dashboard; select * from persistence_info where '?' = '?' and app_code = '?' and
type = '?' order by status desc, last_modify desc;
指纹MD5:    2bcd29c02cf62604d405b739ffdfb4a6
示例SQL:    use f_scp_dashboard; select * from persistence_info where 1=1 and app_code = 'f_pangolin_se
arch_post' and type = 2 order by status desc, last_modify desc;
执行次数:    7477
平均/汇总预估行数:    25 / 189911
平均/汇总影响行数:    0 / 0
平均/汇总查询时间:    0 / 282
平均/汇总返回行数:    2 / 20570
平均/汇总阻塞时间:    0 / 0
平均/汇总返回字节:    2582 / 19308247
****************************************************************************************************
执行占比:    4.69% (按sum_examined_rows)
指纹SQL:    use qmall_insurance_db; select * from ins_product_detail where ins_product_no = '?' limit '?' ;
指纹MD5:    df4d994d0e13f88ed271d9218745db1f
示例SQL:    use qmall_insurance_db; select * from ins_product_detail where ins_product_no = '060014qunar_50' limit 1;
执行次数:    291
平均/汇总预估行数:    152 / 44449
平均/汇总影响行数:    0 / 0
平均/汇总查询时间:    0 / 1
平均/汇总返回行数:    1 / 291
平均/汇总阻塞时间:    0 / 0
平均/汇总返回字节:    3064 / 891804
按照慢SQL统计,MySQL实例135秒内扫描记录约为94万行,而MySQL实例级别统计到的扫描记录约为135*150万=20250万,相差约215倍。
根据平均预估行数来看,TOP 3的SQL都正常使用索引。由于第一条SQL的执行频率较高,查看其执行计划为:
# 查看执行计划
EXPLAIN SELECT *
FROM persistence_info
WHERE app_code = 'f_inter_twell'
AND STATUS = 1;
# 执行计划输出
*************************** 1. row ***************************
           id: 1
  select_type: SIMPLE
        table: persistence_info
   partitions: NULL
         type: index_merge
possible_keys: idx_status,idx_app_code,idx_app_code_type
          key: idx_app_code,idx_status
      key_len: 202,1
          ref: NULL
         rows: 20
     filtered: Using intersect(idx_app_code,idx_status); Using where
        Extra: NULL
表persistence_info结构为:
CREATE TABLE `persistence_info` (
  `id` bigint(20) unsigned NOT NULL AUTO_INCREMENT COMMENT '主键id',
  `app_code` varchar(50) NOT NULL DEFAULT '' COMMENT 'app_code',
  `status` tinyint(4) NOT NULL DEFAULT '1' COMMENT '规则状态',
  `type` tinyint(10) NOT NULL DEFAULT '0' COMMENT '类型',
  ....移除非相关数据列...
  PRIMARY KEY (`id`),
  KEY `idx_status` (`status`),
  KEY `idx_app_code` (`app_code`),
  KEY `idx_app_code_type` (`app_code`,`type`)
) ENGINE=InnoDB AUTO_INCREMENT=217613 DEFAULT CHARSET=utf8mb4 COMMENT='规则存储表'
由于执行计划使用intersect,那么查询相当于:
SELECT id
FROM persistence_info
WHERE app_code = 'f_inter_twell'
INTERSECT
SELECT id
FROM persistence_info
WHERE STATUS = 1
分别查看两个子查询的执行计划:
EXPLAIN SELECT id
FROM persistence_info
WHERE app_code = 'f_inter_twell'
*************************** 1. row ***************************
           id: 1
  select_type: SIMPLE
        table: persistence_info
   partitions: NULL
         type: ref
possible_keys: idx_app_code_type,idx_app_code
          key: idx_app_code
      key_len: 200
          ref: const
         rows: 73
     filtered: 100.00
        Extra: Using index


EXPLAIN SELECT id
FROM persistence_info
WHERE STATUS = 1
*************************** 1. row ***************************
           id: 1
  select_type: SIMPLE
        table: persistence_info
   partitions: NULL
         type: ref
possible_keys: idx_status
          key: idx_status
      key_len: 1
          ref: const
         rows: 5448
     filtered: 100.00
        Extra: Using index
因此理论上查询预估行数应该为5448(使用idx_status索引)+73(使用idx_app_code)+20(INTERSECT操作后主键查找)=5541行,而MySQL返回的预估行数为22,相差250倍,与使用慢查询日志计算出的215倍相近。
查询优化
由于查询使用INTERSECT方式会在索引idx_status上扫描大量记录,可通过组合索引方式来避免INDEX MERGE操作:
ALTER TABLE f_scp_dashboard.persistence_info ADD INDEX idx_app_code_status(app_code,status);
添加索引后执行计划为:
*************************** 1. row ***************************
           id: 1
  select_type: SIMPLE
        table: persistence_info
   partitions: NULL
         type: ref
possible_keys: idx_status,idx_app_code_type,idx_app_code_status
          key: idx_app_code_status
      key_len: 203
          ref: const,const
         rows: 1
     filtered: 100.00
        Extra: NULL
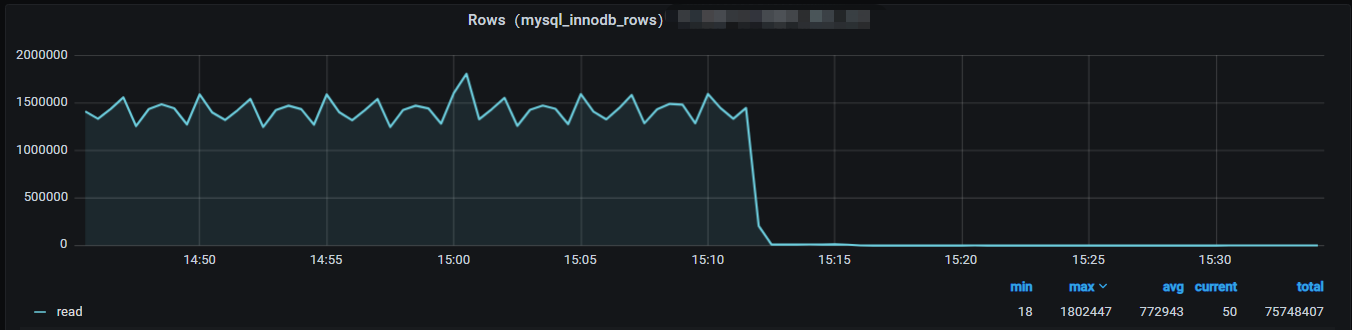
MySQL实例级别的读记录行数明显下降:

 浙公网安备 33010602011771号