python-数据分析
matplotlib 折线图基础
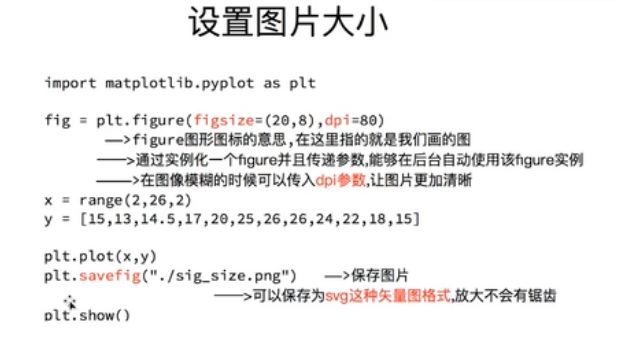
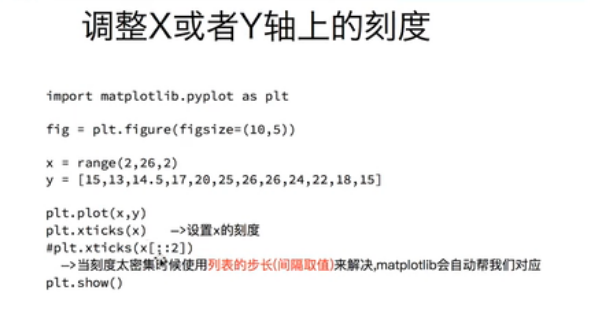
x = range(2,26,2)
y = [15,13,14.5,17,20,25,26,26,24,22,18,15]
plt.figure(figsize=(20,8),dpi=80)
plt.plot(x, y)
plt.show()
调整xy轴刻度的稀疏读

练习:


x = range(0,120)
print(list(x))


for i in range(0,120):
    print(i)

type(range(0,120))
range

##单独range 不会产生列表
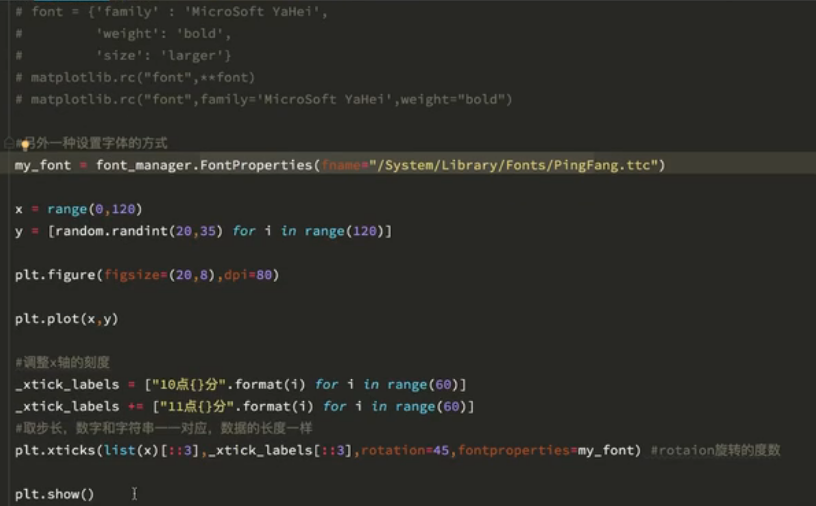
matplotlib 不显示中文字体

 浙公网安备 33010602011771号