

Arthas的class和classloader相关命令-monitor/watch/trace/stack/tt/profiler
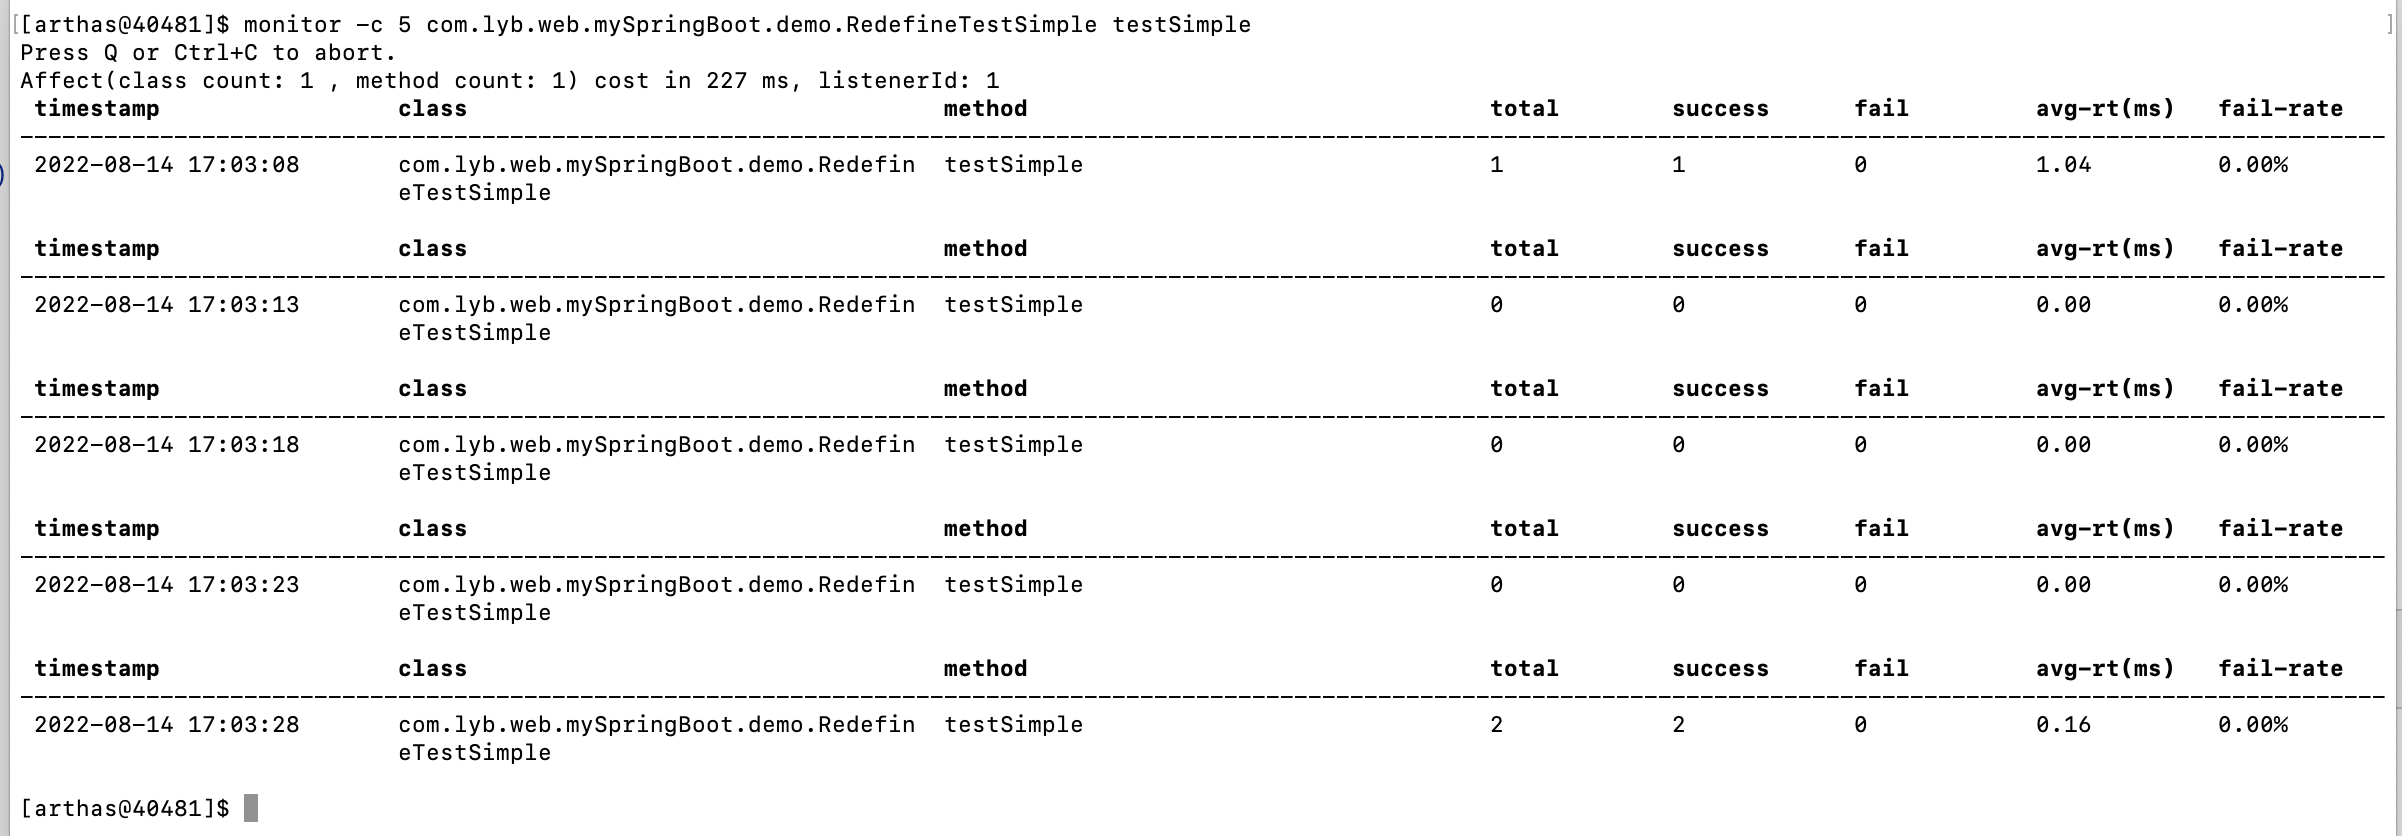
1.monitor:方法执行监控
monitor -c 5 com.lyb.web.mySpringBoot.demo.RedefineTestSimple testSimple
2.watch:函数执行数据观测
| 参数名称 | 参数说明 |
|---|---|
| class-pattern | 类名表达式匹配 |
| method-pattern | 函数名表达式匹配 |
| express | 观察表达式,默认值:{params, target, returnObj} |
| condition-express | 条件表达式 |
| [b] | 在函数调用之前观察begin |
| [e] | 在函数异常之后观察exception |
| [s] | 在函数返回之后观察success |
| [f] | 在函数结束之后(正常返回和异常返回)观察finish |
| [E] | 开启正则表达式匹配,默认为通配符匹配 |
| [x:] | 指定输出结果的属性遍历深度,默认为 1,最大值是 4 |
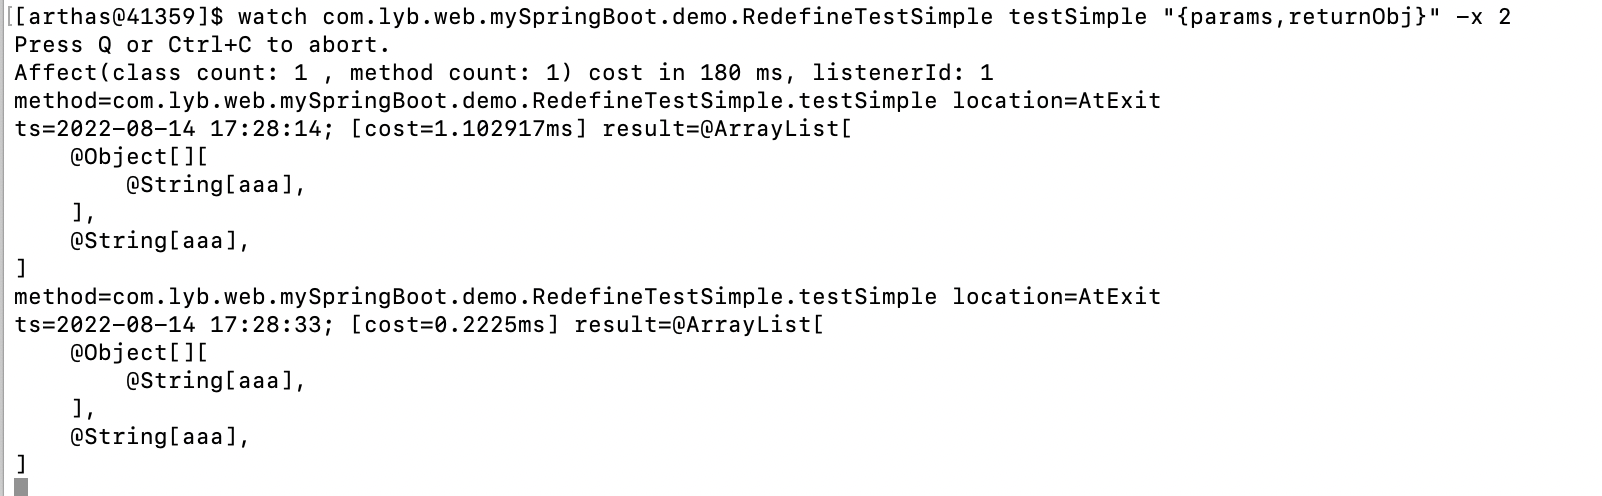
watch com.lyb.web.mySpringBoot.demo.RedefineTestSimple testSimple "{params,returnObj}" -x 2
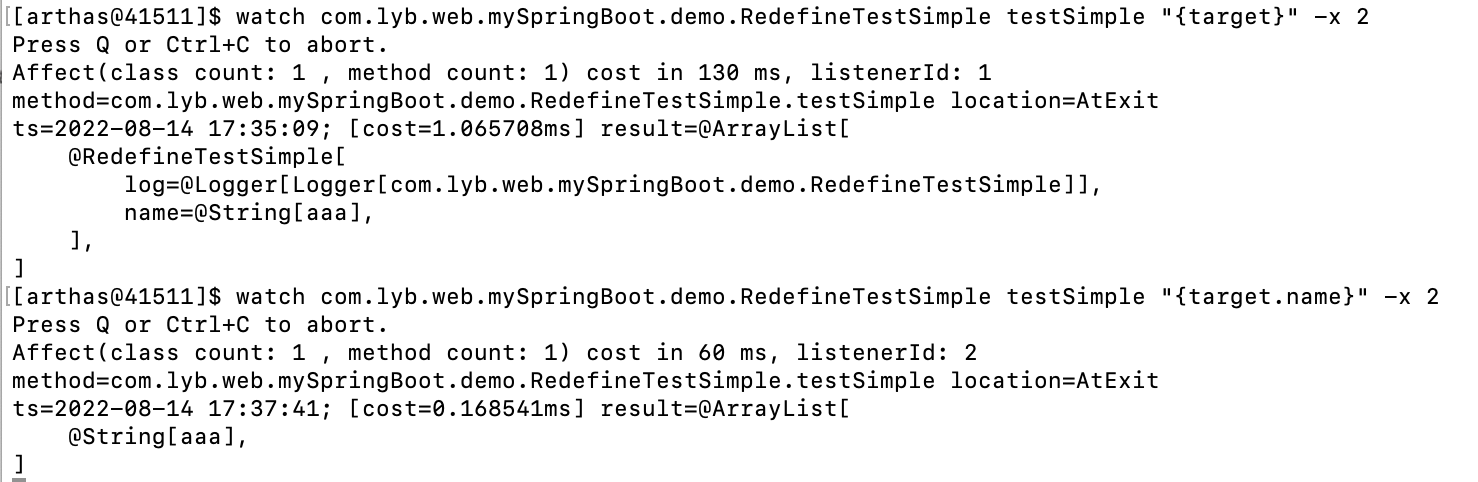
查看对象的成员变量
watch com.lyb.web.mySpringBoot.demo.RedefineTestSimple testSimple "{target}" -x 2
watch com.lyb.web.mySpringBoot.demo.RedefineTestSimple testSimple "{target.name}" -x 2
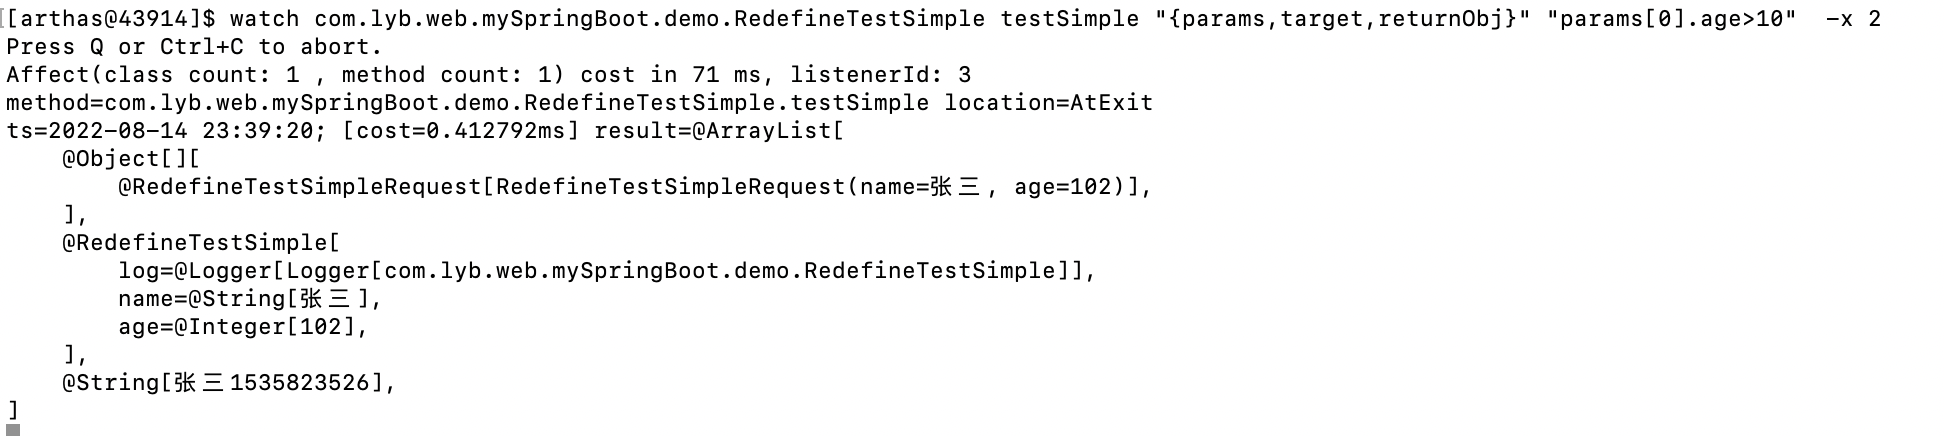
监控入参age>10的入参方法
watch com.lyb.web.mySpringBoot.demo.RedefineTestSimple testSimple "{params,target,returnObj}" "params[0].age>10" -x 2
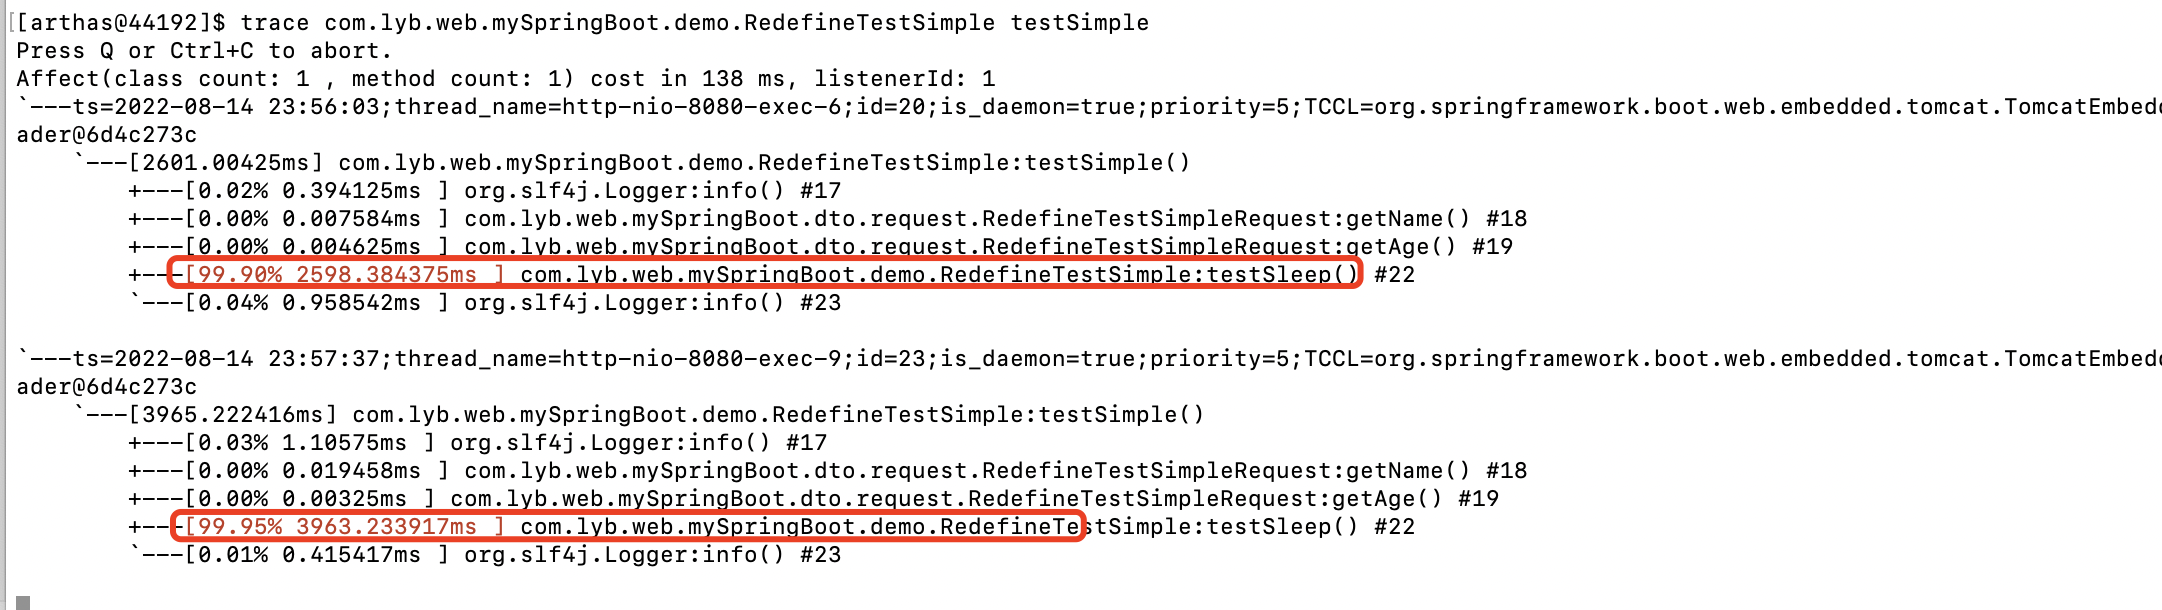
3.trace:方法内部调用路径,并输出方法路径上的每个节点上耗时
trace com.lyb.web.mySpringBoot.demo.RedefineTestSimple testSimple
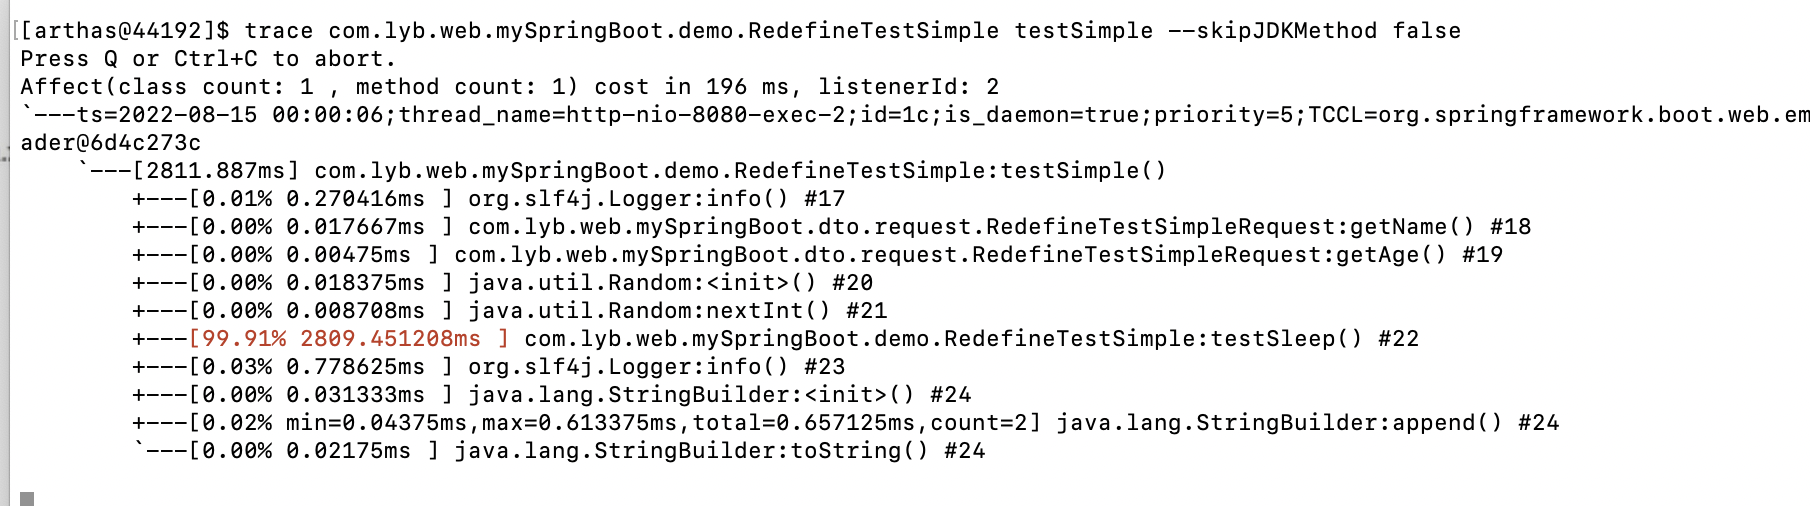
显示JDK的方法
trace com.lyb.web.mySpringBoot.demo.RedefineTestSimple testSimple --skipJDKMethod false
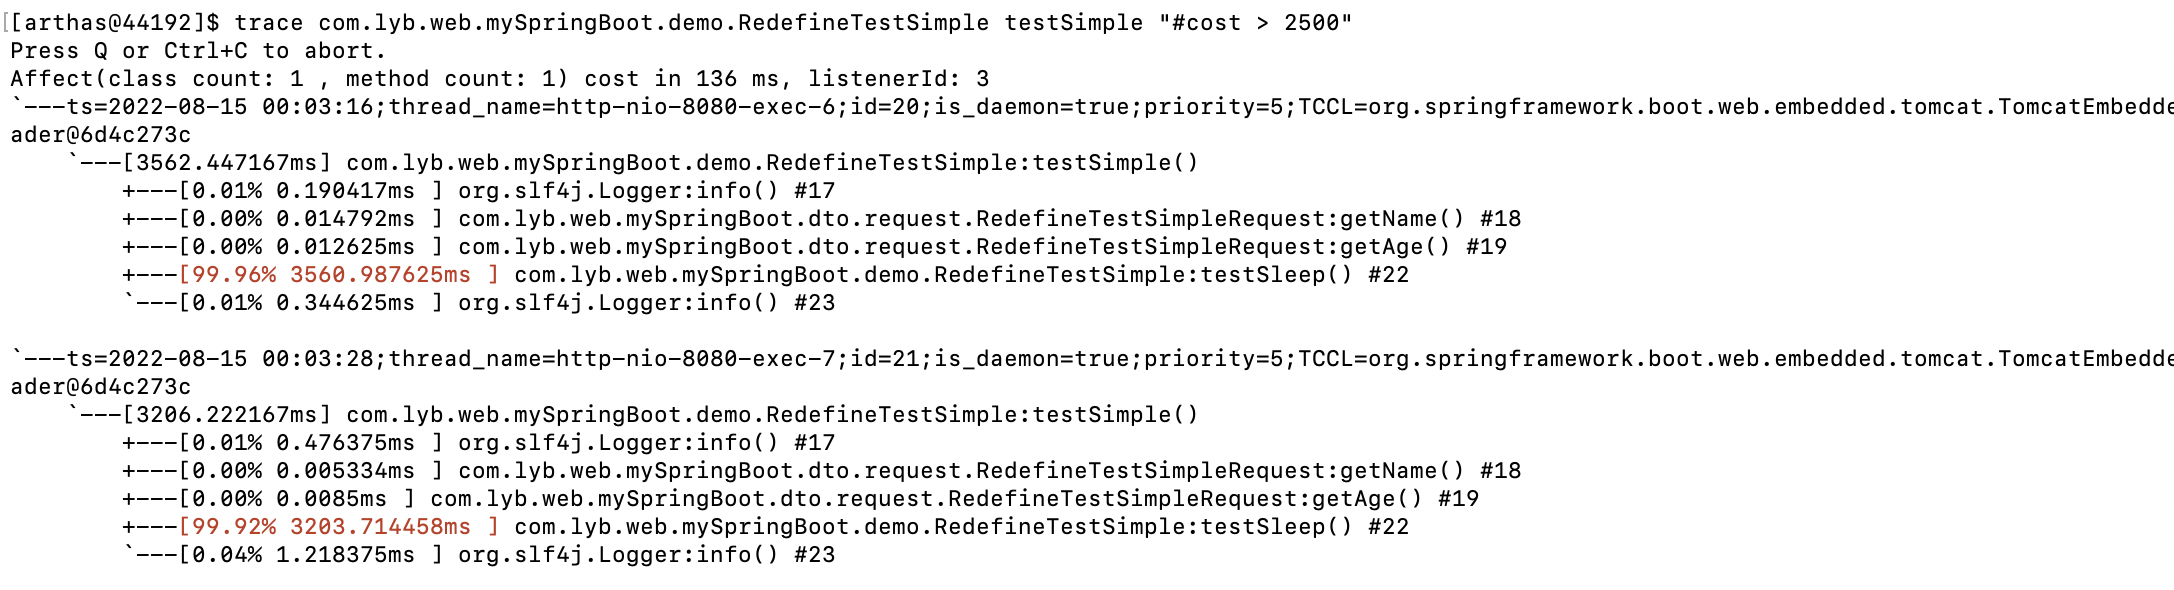
筛选耗时>2500ms的方法
trace com.lyb.web.mySpringBoot.demo.RedefineTestSimple testSimple "#cost > 2500"
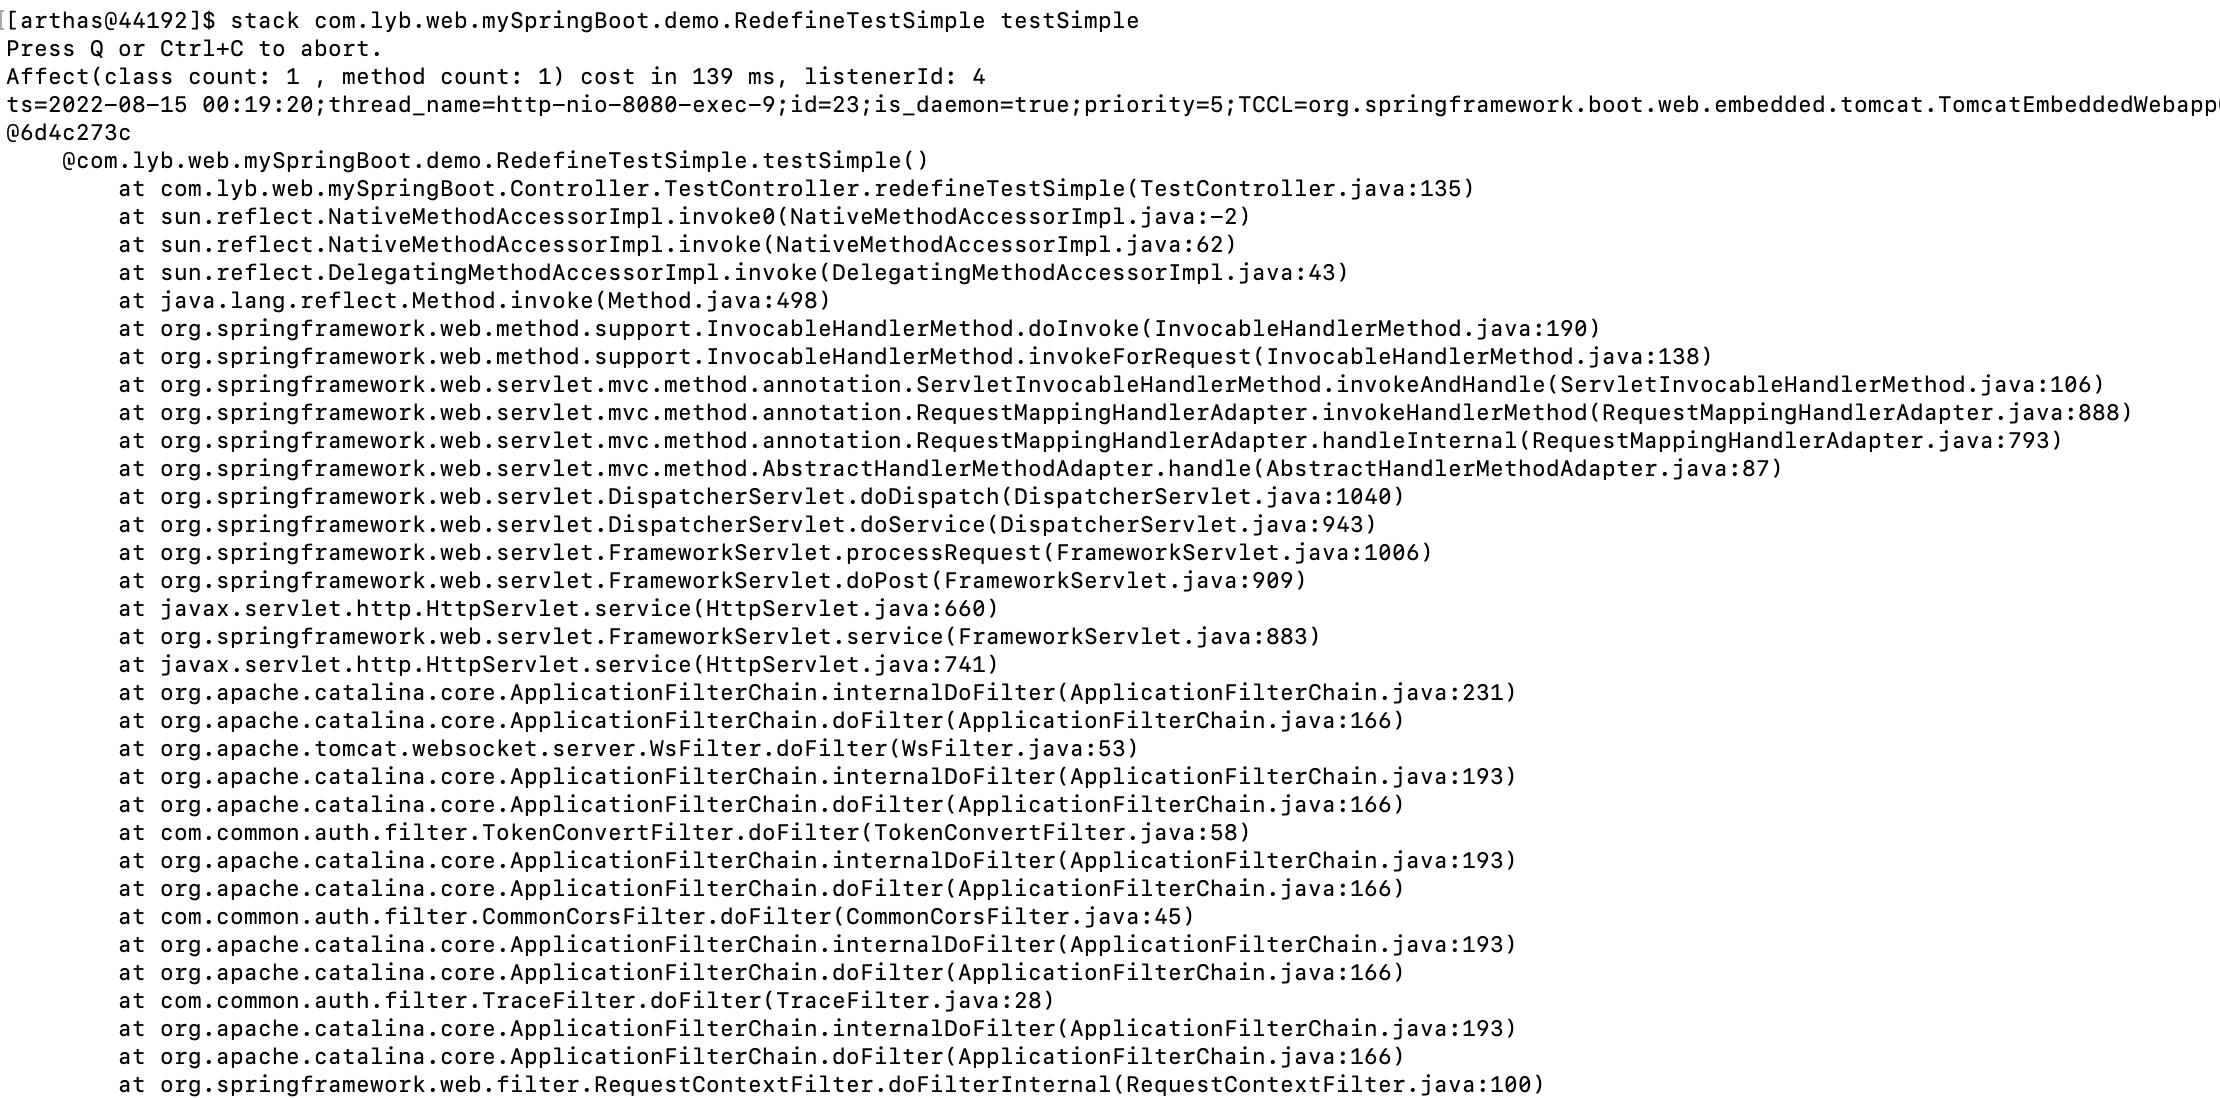
4.stack:输出当前方法被调用的调用栈
stack com.lyb.web.mySpringBoot.demo.RedefineTestSimple testSimple
stack com.lyb.web.mySpringBoot.demo.RedefineTestSimple testSimple "params[0].age>10"
stack com.lyb.web.mySpringBoot.demo.RedefineTestSimple testSimple "#cost > 2500"
5.tt:时间隧道
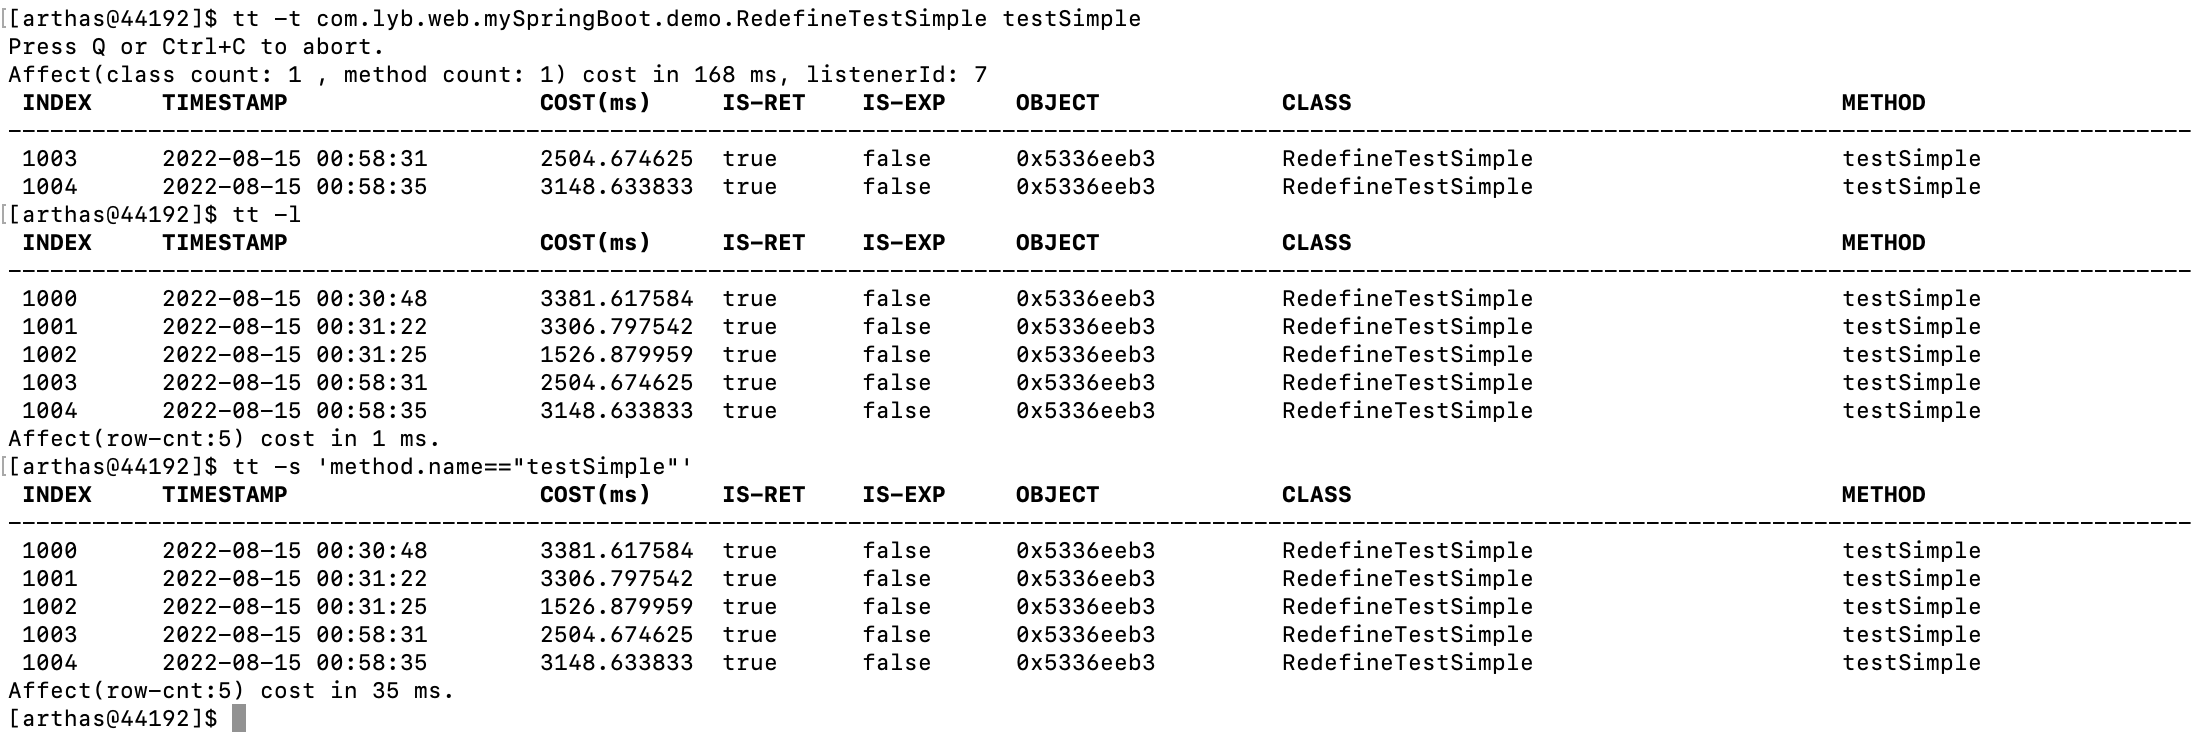
tt -t com.lyb.web.mySpringBoot.demo.RedefineTestSimple testSimple
tt -l
tt -s 'method.name=="testSimple"'
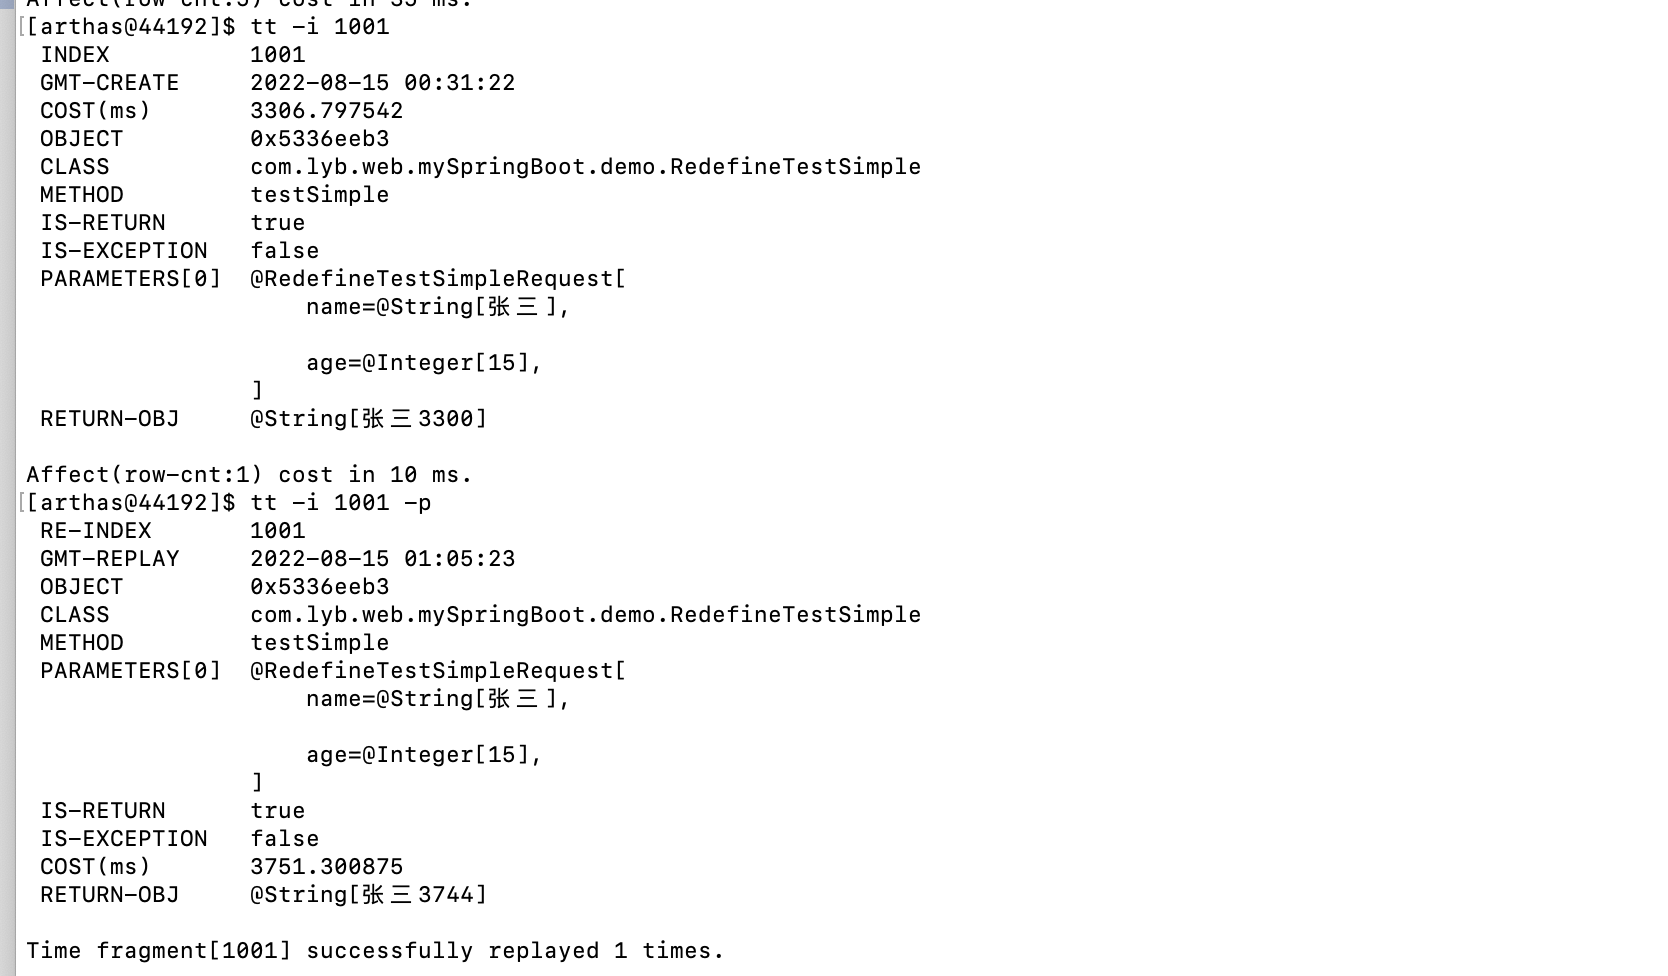
tt -i 1001 [显示1001这次调用入参和结果]
tt -i 1001 -p [重新执行1001入参]
tt -i 1001 -p --replay-times 3 [重新执行1001入参3次]
7.profiler:火焰图
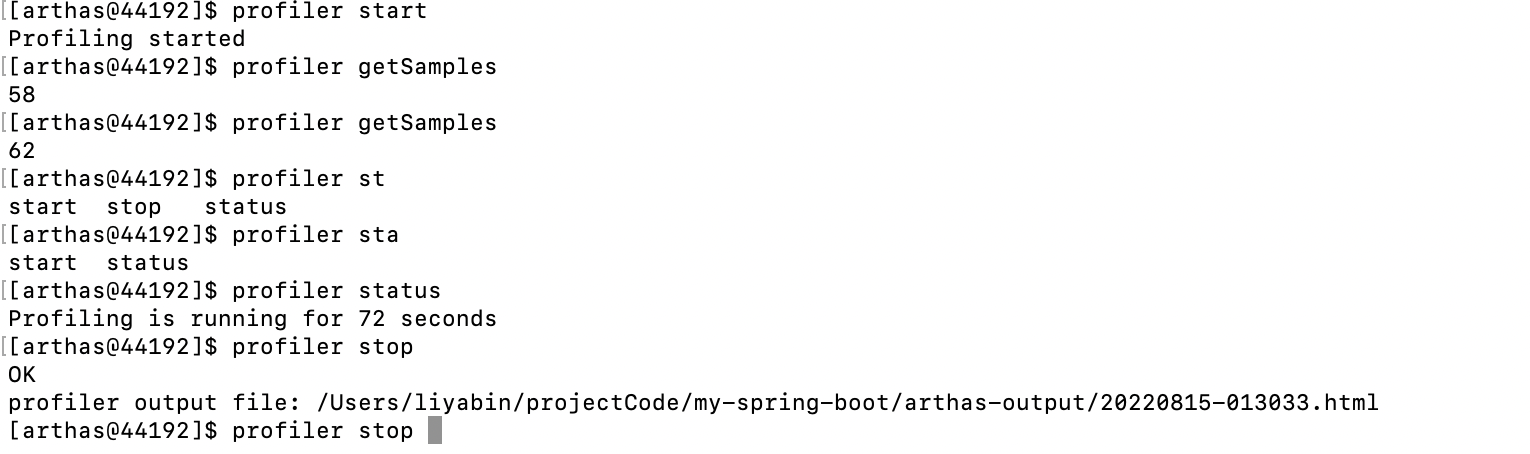
profiler start
profiler getSamples
profiler status
profiler stop

 浙公网安备 33010602011771号