Prometheus-指标监控
零、备注
- 监控实体需要提供prometheus抓取的接口,mysql的export,springboot 的actuator.
- 每添加一个监控实体,需要修改prometheus.yml文件
- grafana的datasource默认连接prometheus服务端口
- grafana的dashboard需要从网上查找
一、Prometheus监控
https://prometheus.io/download/
"prometheus.yml的默认配置"
- job_name: 'prometheus'
# metrics_path defaults to '/metrics'
# scheme defaults to 'http'.
static_configs:
- targets: ['localhost:9090']
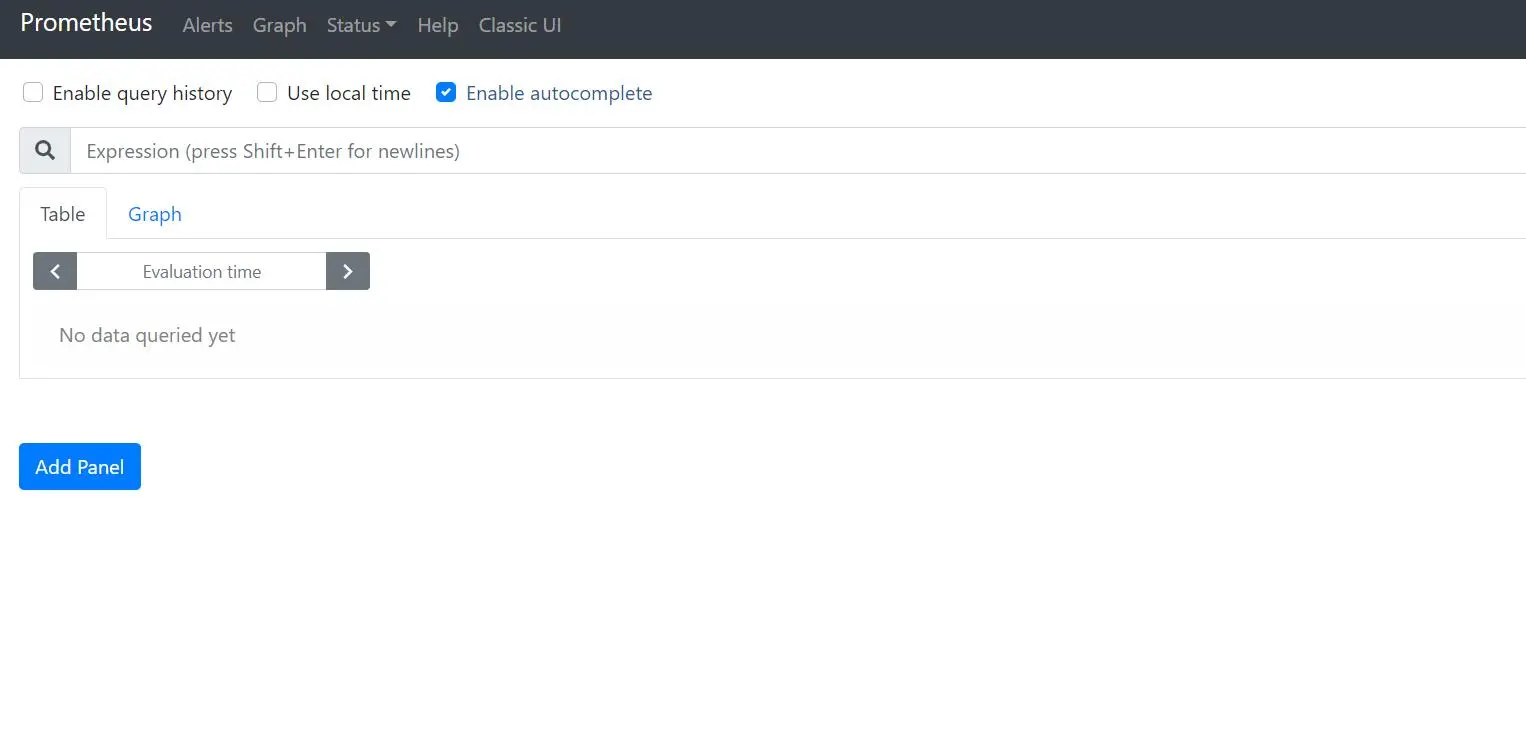
"启动"
.\prometheus.exe --config.file=.\prometheus.yml
http://localhost:9090/
![]()
二、Grafana监控
https://grafana.com/grafana/download?platform=windows
"启动"
.\bin\grafana-server.exe
http://localhost:3000/
![]()
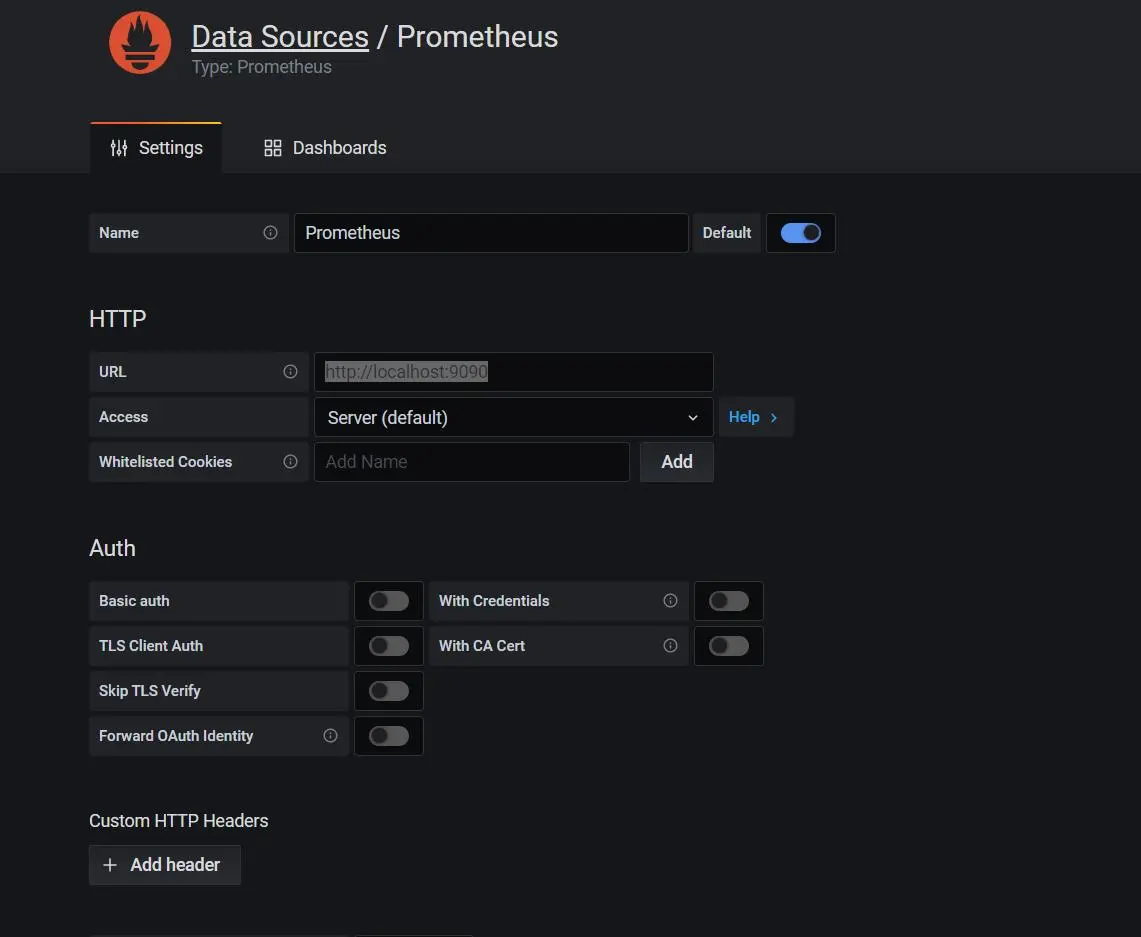
三、关联prometheus与grafana
![]()
四、添加mysql监控
"下载:"
https://github.com/prometheus/mysqld_exporter/releases
"配置:新增<.my.cnf>文件"

[client]
host=127.0.0.1
user=root
password=root

"启动:"
.\mysqld_exporter.exe --config.my-cnf=.my.cnf
"查看:http://localhost:9104/metrics"
![]()
"修改:prometheus.yml"
- job_name: mysql
static_configs:
- targets: ['localhost:9104'] "需要设置job的端口"
labels:
instance: db1 "可以给每个实例一个名字"
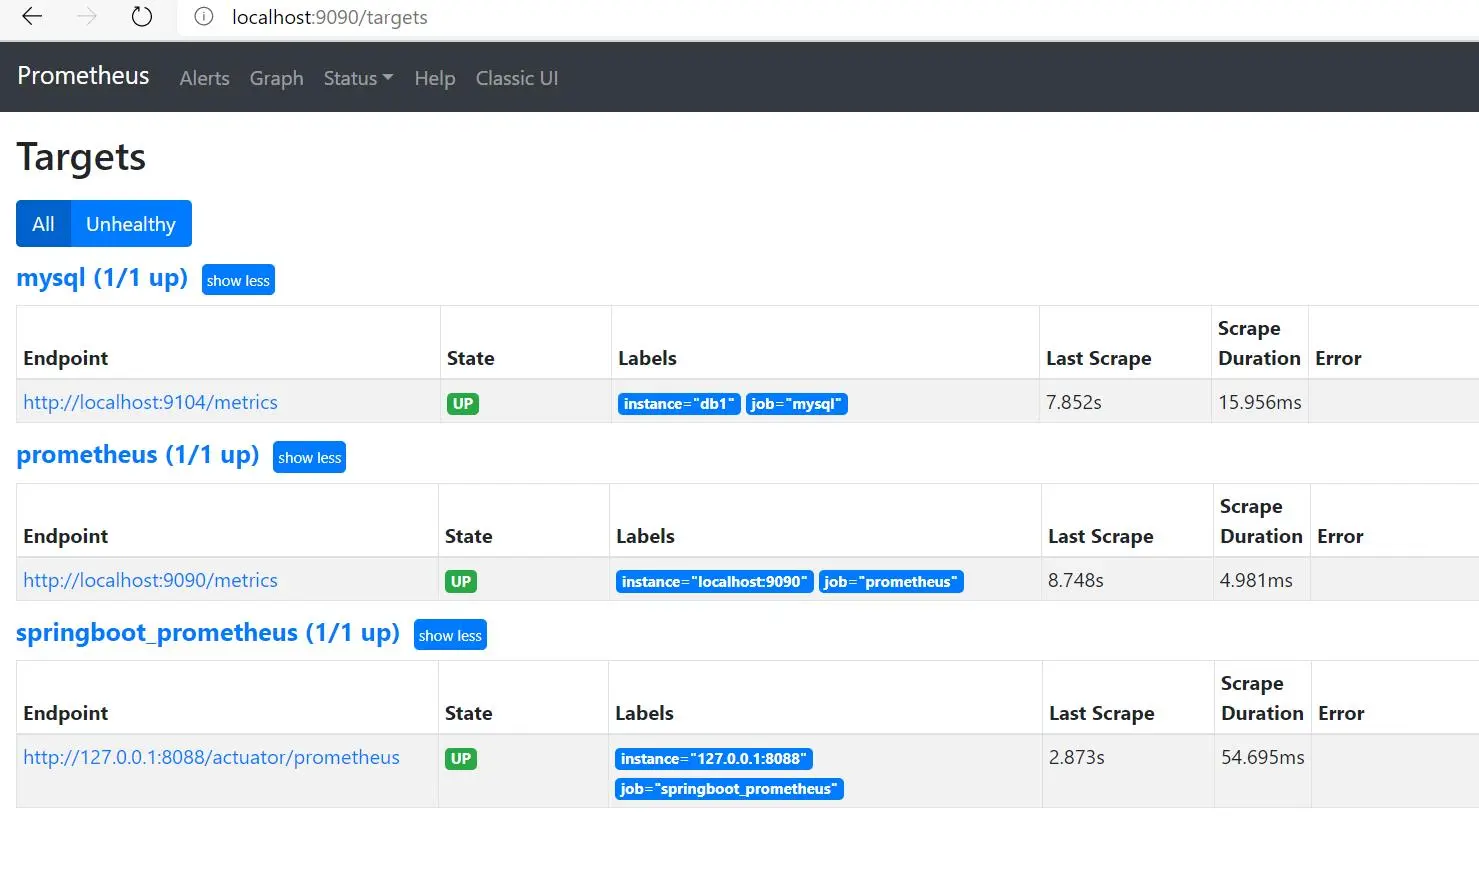
""查看:prometheus监控页的菜单:Status->Targets"
http://localhost:9090/targets"
![]()
"下载dashboard配置"
https://github.com/percona/grafana-dashboards/releases/tag/v1.0.0
"加载:grafana的Dashboards点击《import》,将下载文件中MySQL_Overview.json添加进去生成"
![]()
五、spring boot的matrics信息
"依赖"
<dependency>
	<groupId>org.springframework.boot</groupId>
	<artifactId>spring-boot-starter-actuator</artifactId>
</dependency>
<dependency>
	<groupId>org.springframework.boot</groupId>
	<artifactId>spring-boot-starter-web</artifactId>
</dependency>
<dependency>
	<groupId>io.micrometer</groupId>
	<artifactId>micrometer-registry-prometheus</artifactId>
	<version>1.1.3</version>
</dependency>

"启动配置"
spring.application.name=springboot_prometheus
management.endpoints.web.exposure.include=*
management.metrics.tags.application=${spring.application.name}

"启动"
@Bean
MeterRegistryCustomizer<MeterRegistry> metricsCommonTags(@Value("${spring.application.name}") String application) {
    return registry -> registry.config().commonTags("application", application);
}

"查看:http://localhost:8088/actuator/prometheus"
![]()
"prometheus.yml"
###以下内容为SpringBoot应用配置
  - job_name: 'springboot_prometheus'
    scrape_interval: 5s
    metrics_path: '/actuator/prometheus'
    static_configs:
      - targets: ['127.0.0.1:8080']
"查看"
![]()
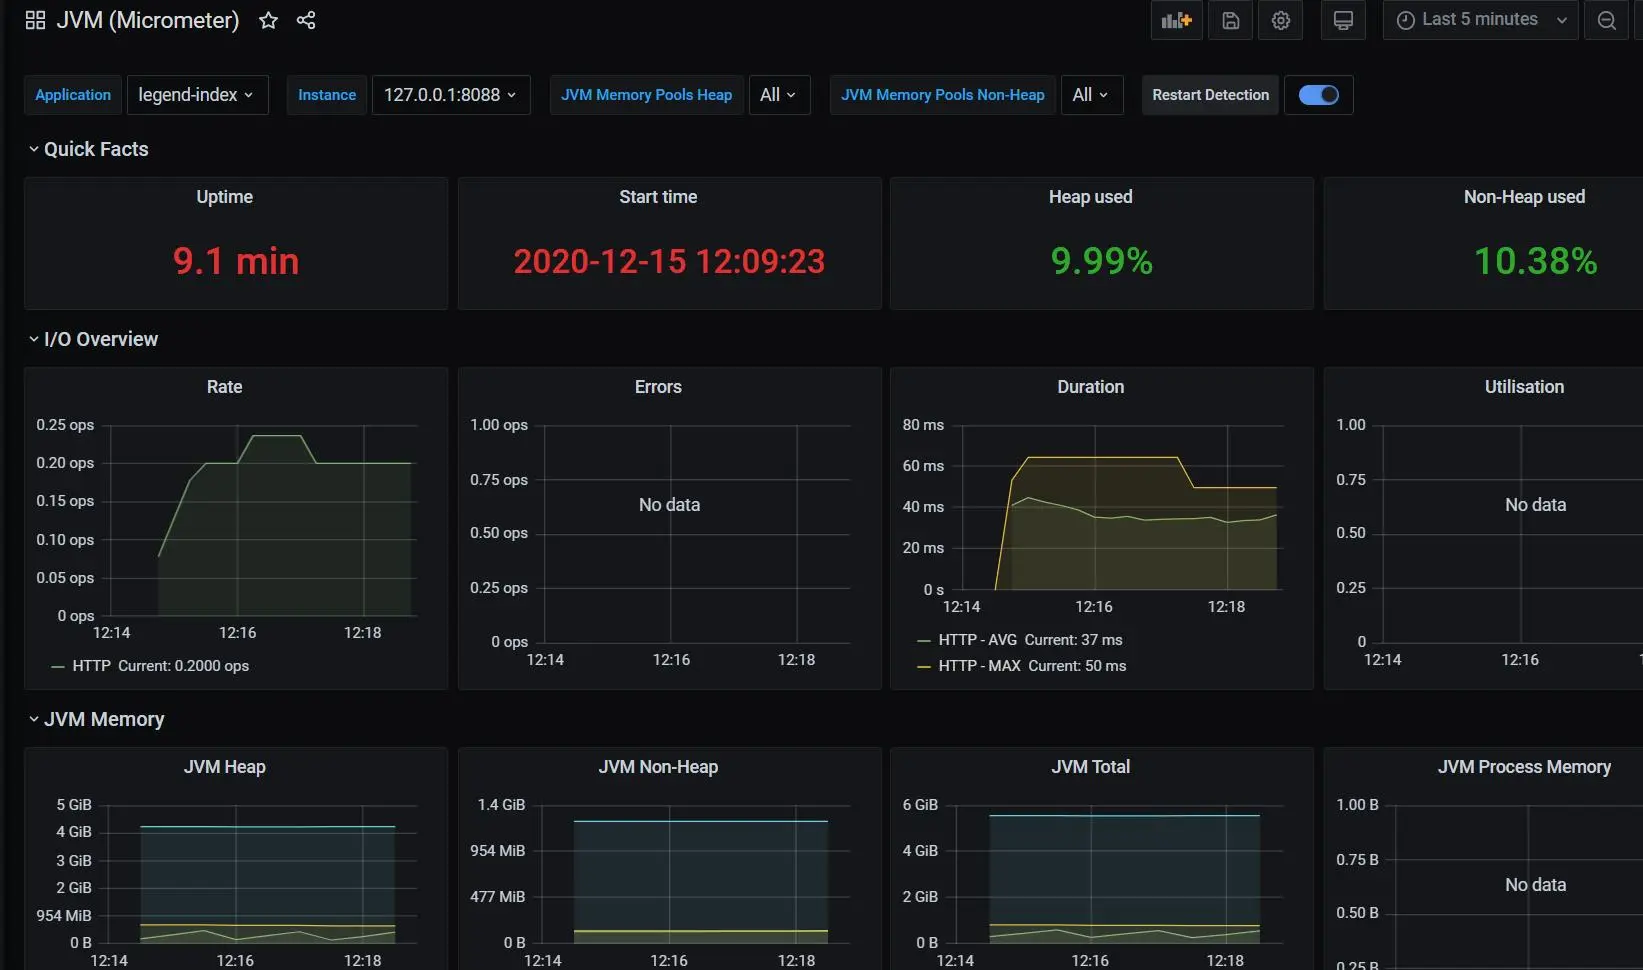
"下载Json文件"
https://grafana.com/grafana/dashboards/4701
- 查看
![]()


 浙公网安备 33010602011771号