Prometheus飞书告警
项目概述
通过alertmanager和PrometheusAlert实现飞书监控告警
端口使用
| 服务名称 | 端口 |
|---|---|
| Prometheus | 9090 |
| alertmanager | 9093 |
| PrometheusAlert | 8080 |
| grafana | 3000 |
监控指标
| 监控项目 | 阈值 |
|---|---|
| 内存占用 | 超过80%告警 |
| 磁盘占用 | 超过80%告警 |
| cpu所有核的占用率 | 超过80%告警 |
| 磁盘读写速度 | 超过100mb/s告警 |
一、PrometheusAlert以及相关配置
版本: v4.8.1
1.下载PrometheusAlert
cd /opt/aaa
wget https://github.com/feiyu563/PrometheusAlert/releases/download/v4.8.1/linux.zip
unzip linux.zip
mv linux ../PrometheusAlert
PrometheusAlert所在位置 /opt/PrometheusAlert
2.给启动脚本加x权限
cd /opt/PrometheusAlert
chmod +x PrometheusAlert
3.修改配置文件
配置文件所在位置 /opt/PrometheusAlert/conf/app.conf
 74 #是否开启飞书告警通道,可同时开始多个通道0为关闭,1为开启
 75 open-feishu=1   将飞书告警通道开启
4.通过systemd去控制PrometheusAlert
服务名为:PrometheusAlert.service
-
PrometheusAlert不能直接使用systemd管理,否则web端会报错,需要编写启动脚本,脚本内容如下:
vim /etc/init.d/PrometheusAlert
#!/bin/bash
# 作用:PrometheusAlert 启动脚本
export PATH="$PATH"
cd /opt/PrometheusAlert
prometheusalert_dir="/opt/PrometheusAlert"
prometheusalert_status=$(netstat -tunlp | grep PrometheusA | grep 8080 | wc -l)
start() {
    if [ "${prometheusalert_status}" -eq 0 ]; then
        nohup ./PrometheusAlert > /dev/null 2>&1 &
        return_value=$?
        if [ "${return_value}" -eq 0 ]; then
            echo "PrometheusAlert start successful"
        else
            echo "PrometheusAlert start fault, please check config file"
        fi
    else
    echo "PrometheusAlert in running"
    fi
}
stop() {
    if [ ${prometheusalert_status} -gt 0 ]; then
        prometheus_pid=$(netstat -tunlp | grep PrometheusA | grep 8080 | awk "NR==1" | awk '{print $7}' | awk -F "/" '{print $1}')
    kill -9 ${prometheus_pid}
    return_value=$?
    if [ "${return_value}" -eq 0 ]; then
        echo "PrometheusAlert stop successful"
    else
        echo "PrometheusAlert stop fault, please check redis status"
    fi
    else
        echo "PrometheusAlert is not running, please execure $0 start"
    fi
}
case "$1" in
start)
    start && exit 0
    ;;
stop)
    stop || exit 2
    ;;
restart)
    stop
    sleep 10s
    start && exit 0
    ;;
*)
    echo $"Usage: $0 {start|stop|restart}"
    exit 2
    ;;
esac
exit $?

---------------------------------------------
启动方式为
/etc/init.d/PrometheusAlert   {start|stop|restart}
-
设置开机自启
编写配置文件
cd  /usr/lib/systemd/system
cat >PrometheusAlert.service < EOF
[Unit]
Description=Prometheus Alert
After=network.target

[Service]
Type=forking
ExecStart=/etc/init.d/PrometheusAlert start
ExecRestart=/etc/init.d/PrometheusAlert restart
ExecStop=/etc/init.d/PrometheusAlert stop
Restart=on-failure

[Install]
WantedBy=multi-user.target
EOF


设置开机自启并启动
[root@m01-176 PrometheusAlert]# systemctl enable PrometheusAlert.service
Created symlink from /etc/systemd/system/multi-user.target.wants/PrometheusAlert.service to /usr/lib/systemd/system/PrometheusAlert.service.
[root@m01-176 system]# systemctl start PrometheusAlert.service
[root@m01-176 system]# systemctl status PrometheusAlert.service
● PrometheusAlert.service - Prometheus
   Loaded: loaded (/usr/lib/systemd/system/PrometheusAlert.service; enabled; vendor preset: disabled)

查看8080端口是否启动
[root@m01-176 system]# ss -tnl|grep 8080
LISTEN     0      128       [::]:18080                 [::]:*
LISTEN     0      128       [::]:8080                  [::]:*
5.进入PrometheusAlert的webUI进行设置
webUI的初始密码可在PrometheusAlert配置文件中查看 /opt/PrometheusAlert/conf/app.conf
  3 #登录用户名
  4 login_user=prometheusalert
  5 #登录密码
  6 login_password=prometheusalert
-
创建自定义模板
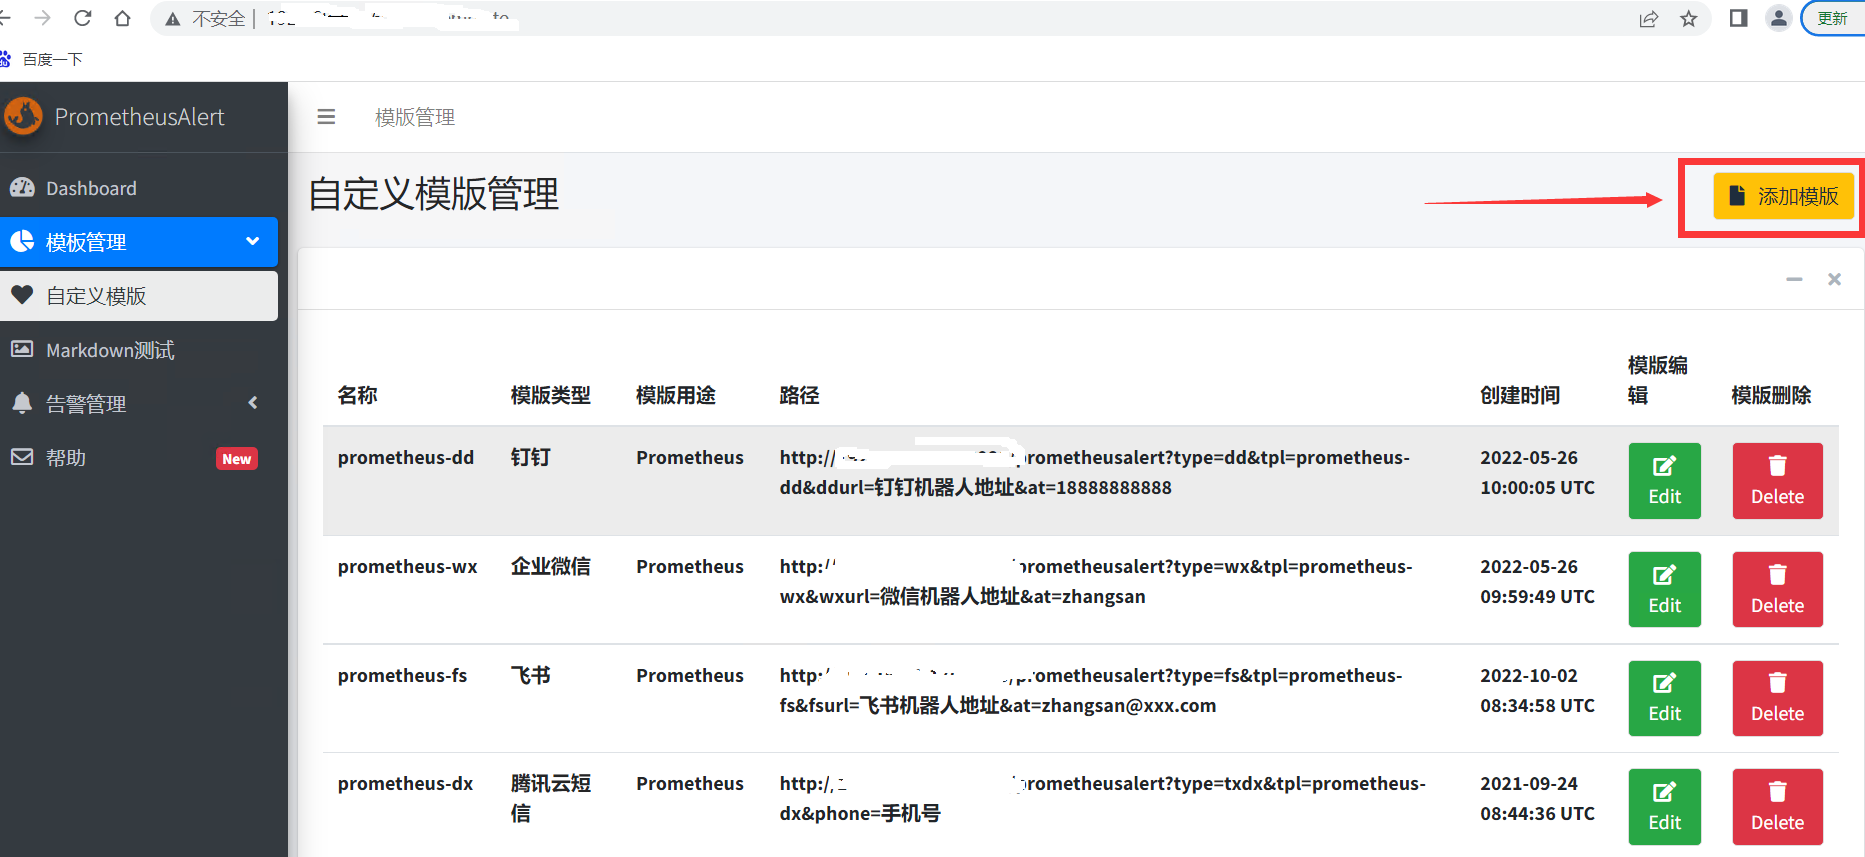
-
设置报警模板
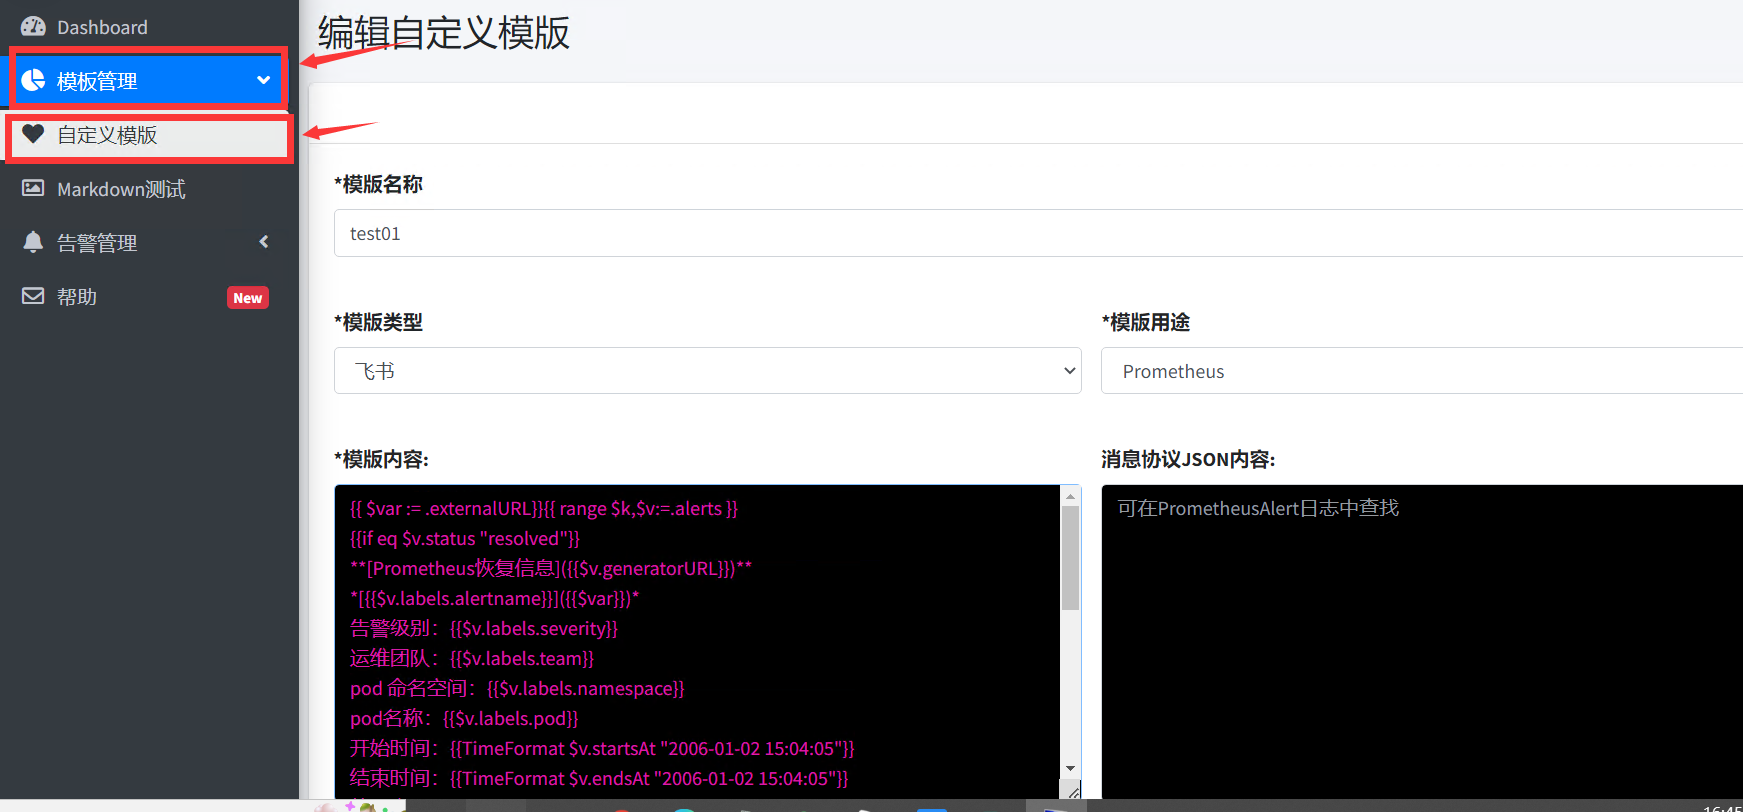
-
保存模板
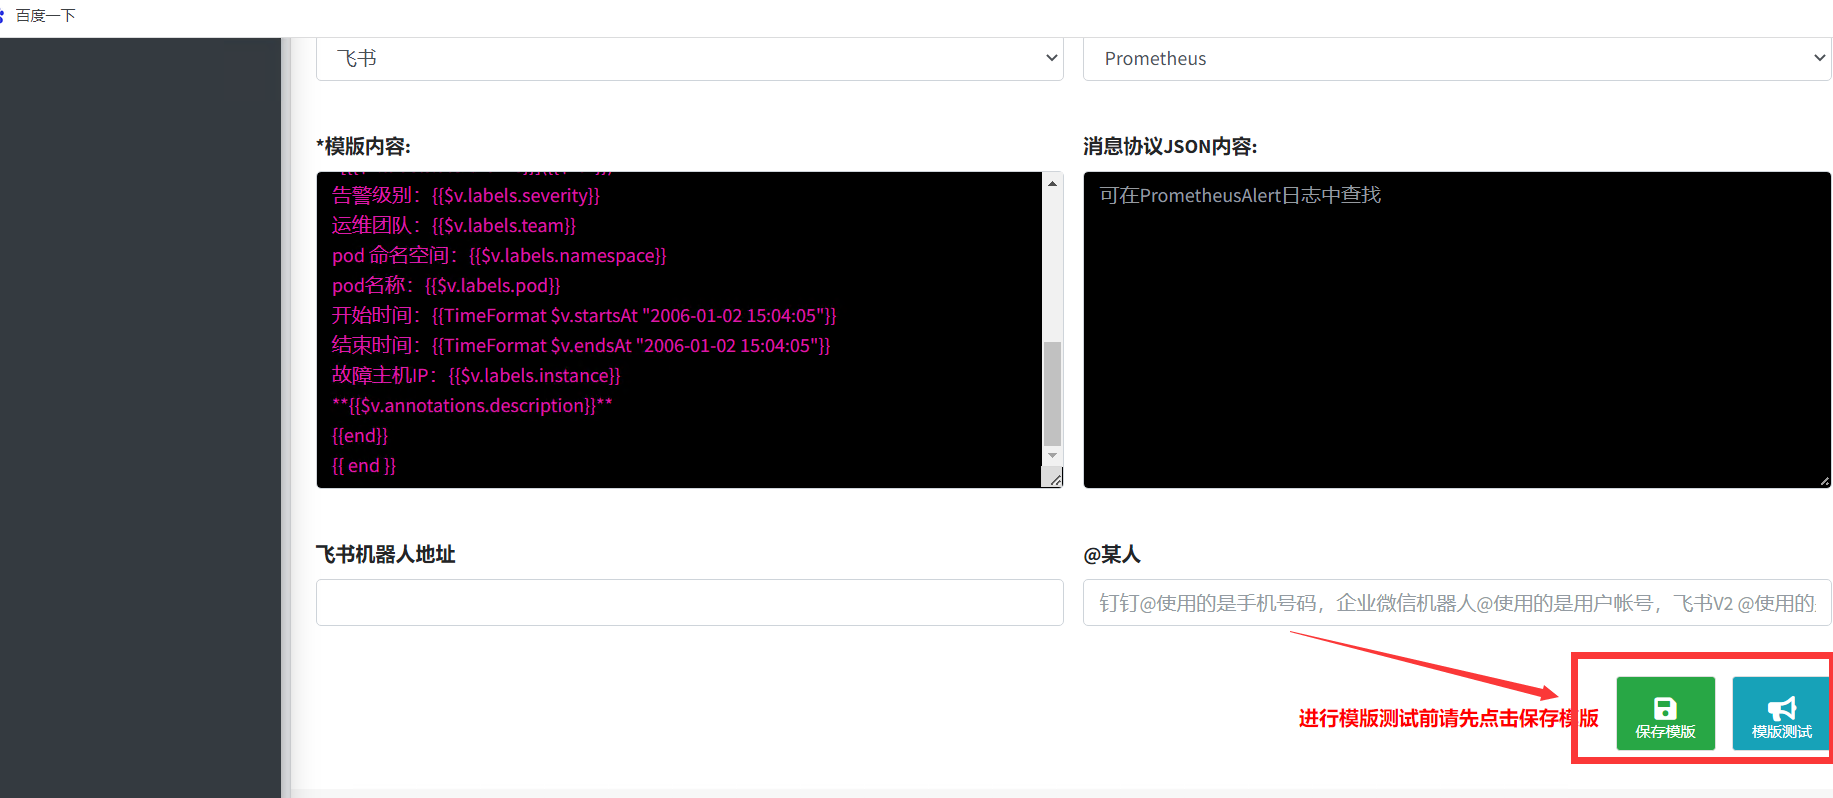
-
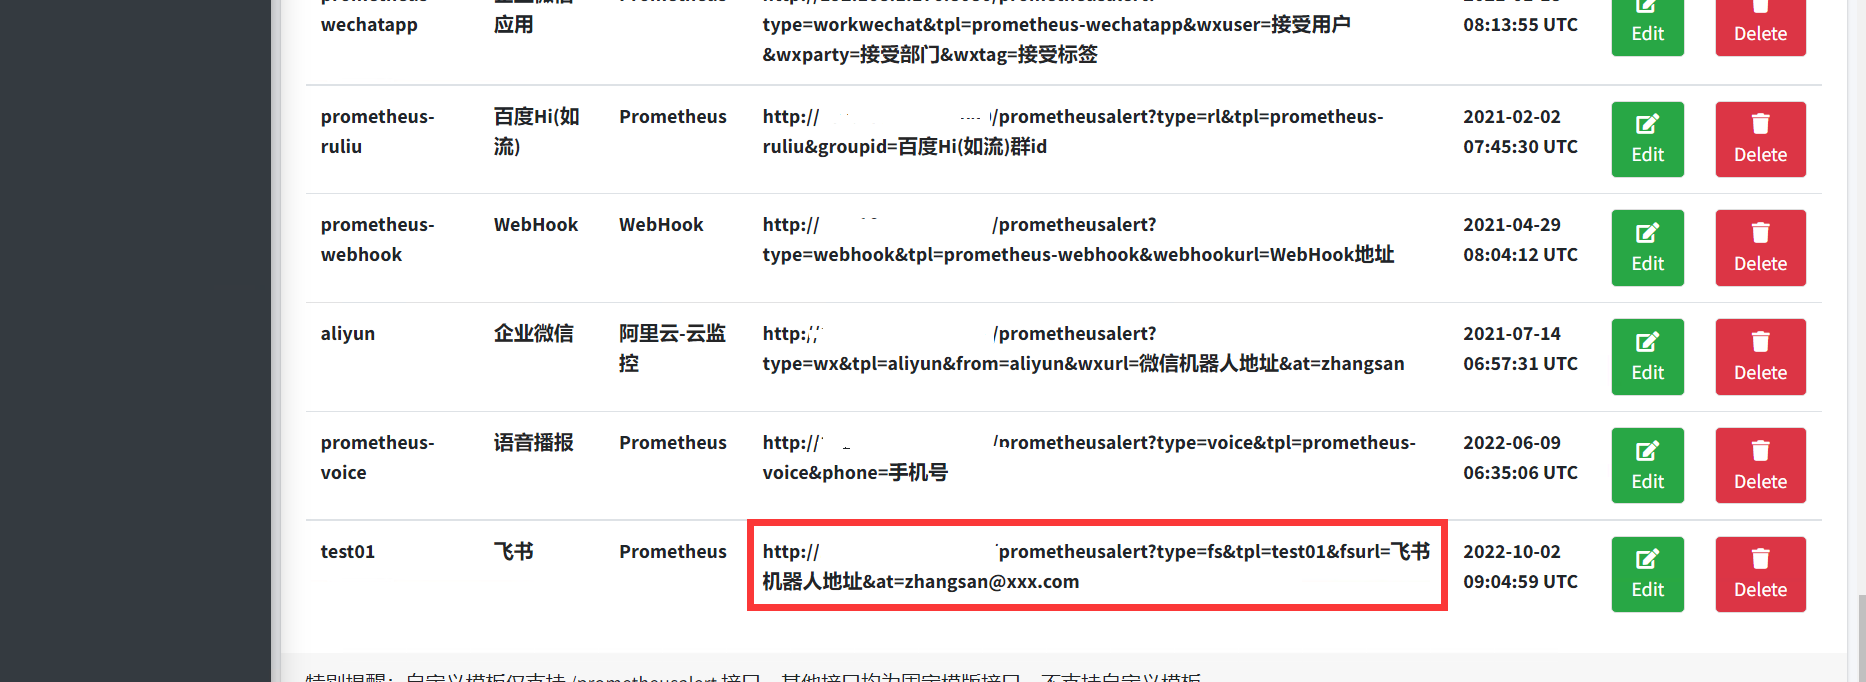
复制并保存模板的路径用于编写altermanager配置文件
二、altermanager部署及相关配置
版本: 0.24.0
1.下载altermanager
cd /opt
mkdir aaa
wget https://github.com/prometheus/alertmanager/releases/download/v0.24.0/alertmanager-0.24.0.linux-amd64.tar.gz
tar xf  alertmanager-0.24.0.linux-amd64.tar.gz -C /opt
mv alertmanager-0.24.0.linux-amd64/ alertmanager
2.修改配置文件
[root@m01-176 alertmanager]# cat alertmanager.yml
route:
  group_by: ['alertname']
  group_wait: 30s
  group_interval: 5m
  repeat_interval: 1h
  receiver: 'web.hook'
receivers:
  - name: 'web.hook'
    webhook_configs:
      - url: 'http://xxx.xxx.x.xxx:8080/prometheusalert?type=fs&tpl=test01&fsurl=https://open.feishu.cn/open-apis/bot/v2/hook/xxxxxxxx-xxxx-xxxx-xxxx-xxxxxxxxxxxx'       #将其改为PrometheusAlert的模板路径
inhibit_rules:
  - source_match:
      severity: 'critical'
    target_match:
      severity: 'warning'
    equal: ['alertname', 'dev', 'instance']
3.修改Prometheus的配置文件连接alertmanager
[root@m01-176 prometheus]# vim prometheus.yml
**************************
  8 alerting:
  9   alertmanagers:
 10     - static_configs:
 11         - targets:
 12           # - alertmanager:9093
 13           - 127.0.0.1:9093        #alertmanager地址
**************************
rule_files:
  # - "first_rules.yml"
  # - "second_rules.yml"
  - "/opt/prometheus/rules/*.yml"         #报警规则路径必须为绝对路径
4.编写报警规则
报警规则配置文件路径为/opt/prometheus/rules
-
进入Prometheus的WebUI页面使用PQL取值
# cpu在过去1分钟内的使用率
(1 - sum by (instance) (increase(node_cpu_seconds_total{mode="idle"}[1m])) / sum by (instance) (increase(node_cpu_seconds_total[1m]))) * 100
# 内存使用率
((node_memory_MemTotal_bytes-(node_memory_MemFree_bytes+node_memory_Buffers_bytes+node_memory_Cached_bytes))/node_memory_MemTotal_bytes)*100
# 磁盘使用率
(node_filesystem_size_bytes {mountpoint ="/"} - node_filesystem_free_bytes {mountpoint ="/"}) / node_filesystem_size_bytes {mountpoint ="/"} * 100
#磁盘读速度超过100mb/s告警
sum by (instance) (rate(node_disk_read_bytes_total[2m]))/1024/1024 >100
#磁盘写速度超过100mb/s告警
sum by (instance) (rate(node_disk_written_bytes_total[2m]))/1024 /1024 >100
-
进入Prometheus的WebUI页面使用PQL取值对比grafana查看取值是否准确
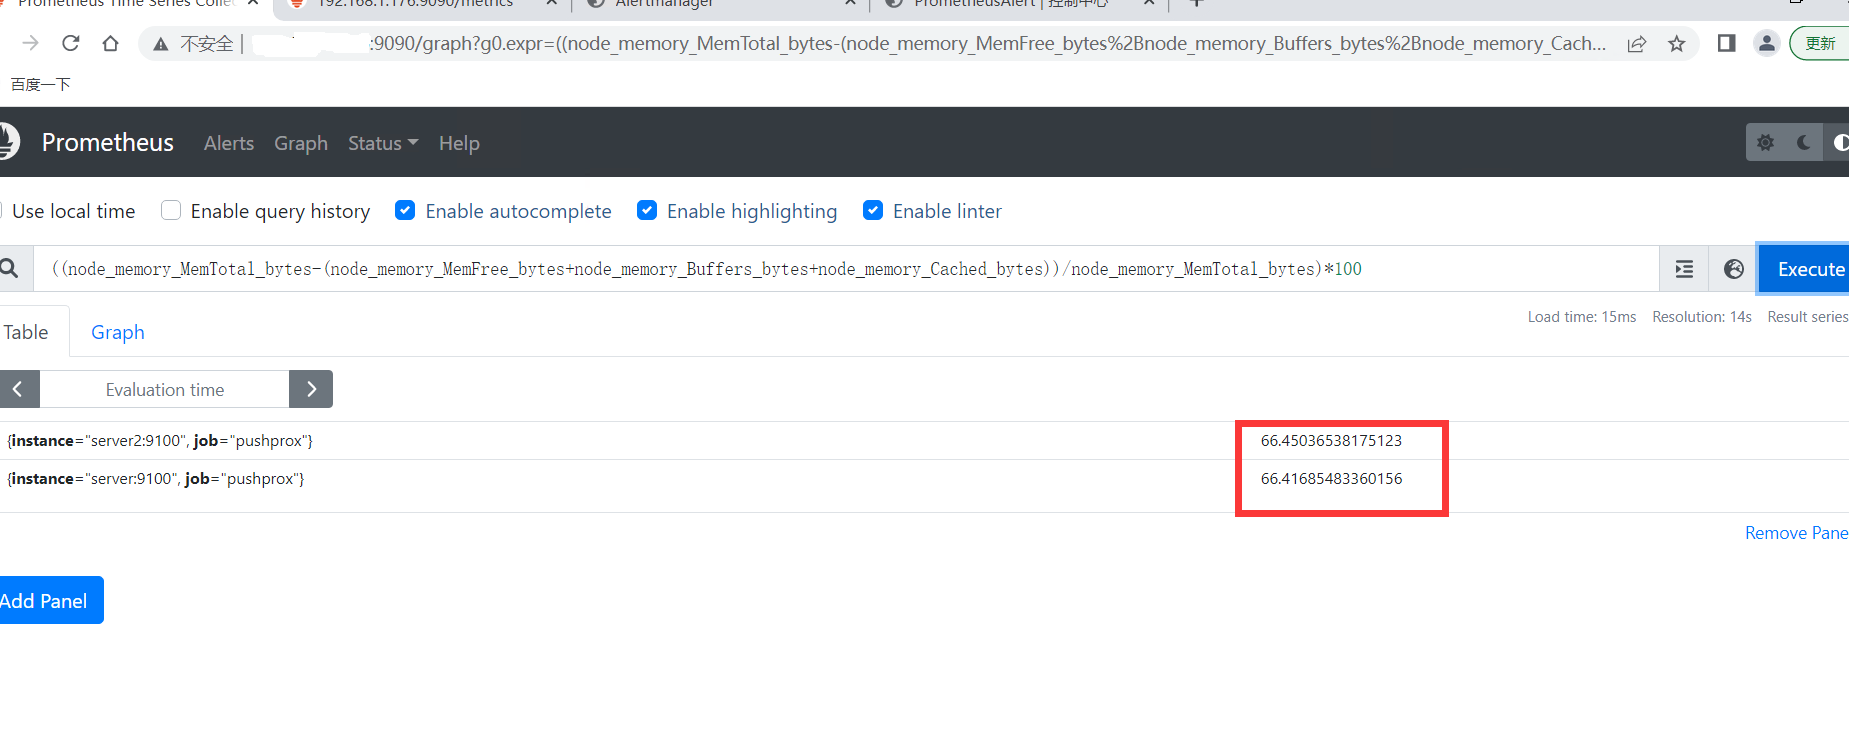
-
写入报警规则配置文件
[root@m01-176 rules]# ll
总用量 20
-rw-r--r--. 1 root root 510 10月  3 21:05 cpu_used_rules.yml      #cpu在过去1分钟内的使用率
-rw-r--r--. 1 root root 467 10月  3 21:27 disk_read_rules.yml       #磁盘读速度超过100mb/s告警
-rw-r--r--. 1 root root 477 10月  3 21:26 disk_written_rules.yml      #磁盘写速度超过100mb/s告警
-rw-r--r--. 1 root root 536 10月  3 21:12 filesystem_used_rules.yml    # 磁盘使用率
-rw-r--r--. 1 root root 510 10月  3 21:13 memory_used_rules.yml      # 内存使用率
-
文件内容如下
[root@m01-176 rules]# cat *
groups:
- name: Cpu
  rules:
    - alert: Cpu01
      expr: "(1 - sum(increase(node_cpu_seconds_total{mode='idle'}[1m])) by (instance) / sum(increase(node_cpu_seconds_total[1m])) by (instance)) * 100 > 80"
      for: 1m
      labels:
        severity: warning # 自定一个一个标签 info 级别
      annotations:
        summary: "服务 {{ $labels.instance }} cpu 使用率过高"
        description: "{{ $labels.instance }} 的 cpu 在过去1分钟内使用过高,cpu 使用率 {{humanize $value}}."

---------------------------------------------------------------

groups:
- name: Disk_read
  rules:
    - alert: disk_read
      expr: "sum by (instance) (rate(node_disk_read_bytes_total[5m]))/1024/1024 > 100"
      for: 1m
      labels:
        severity: warning # 自定一个一个标签 info 级别
      annotations:
        summary: "服务 {{ $labels.instance }}  磁盘读取速度状态异常"
        description: "{{ $labels.instance }} 的磁盘读取速度状态异常,磁盘读取速度为 {{humanize $value}} MB/s"

-------------------------------------------------------------------

groups:
- name: Disk_written
  rules:
    - alert: disk_written
      expr: "sum by (instance) (rate(node_disk_written_bytes_total[2m]))/1024 /1024 >100"
      for: 1m
      labels:
        severity: warning # 自定一个一个标签 info 级别
      annotations:
        summary: "服务 {{ $labels.instance }}  磁盘写入速度状态异常"
        description: "{{ $labels.instance }} 的磁盘写入速度状态异常,磁盘写入速度为 {{humanize $value}} MB/s"

---------------------------------------------------------------------

groups:
- name: Filesystem
  rules:
    - alert: filesystem
      expr: '(node_filesystem_size_bytes {mountpoint ="/"} - node_filesystem_free_bytes {mountpoint ="/"}) / node_filesystem_size_bytes {mountpoint ="/"} * 100 > 10'
      for: 1m
      labels:
        severity: warning # 自定一个一个标签 info 级别
      annotations:
        summary: "服务 {{ $labels.instance }} 磁盘使用率过高"
        description: "{{ $labels.instance }} 的 磁盘在过去1分钟内使用过高,磁盘使用率 {{humanize $value}}."

-----------------------------------------------------------------------

groups:
- name: Memory
  rules:
    - alert: memory
      expr: "((node_memory_MemTotal_bytes-(node_memory_MemFree_bytes+node_memory_Buffers_bytes+node_memory_Cached_bytes))/node_memory_MemTotal_bytes)*100 > 80"
      for: 1m
      labels:
        severity: warning # 自定一个一个标签 info 级别
      annotations:
        summary: "服务 {{ $labels.instance }}  内存使用率过高"
        description: "{{ $labels.instance }} 的 内存使用率过高,内存使用率为 {{humanize $value}}."
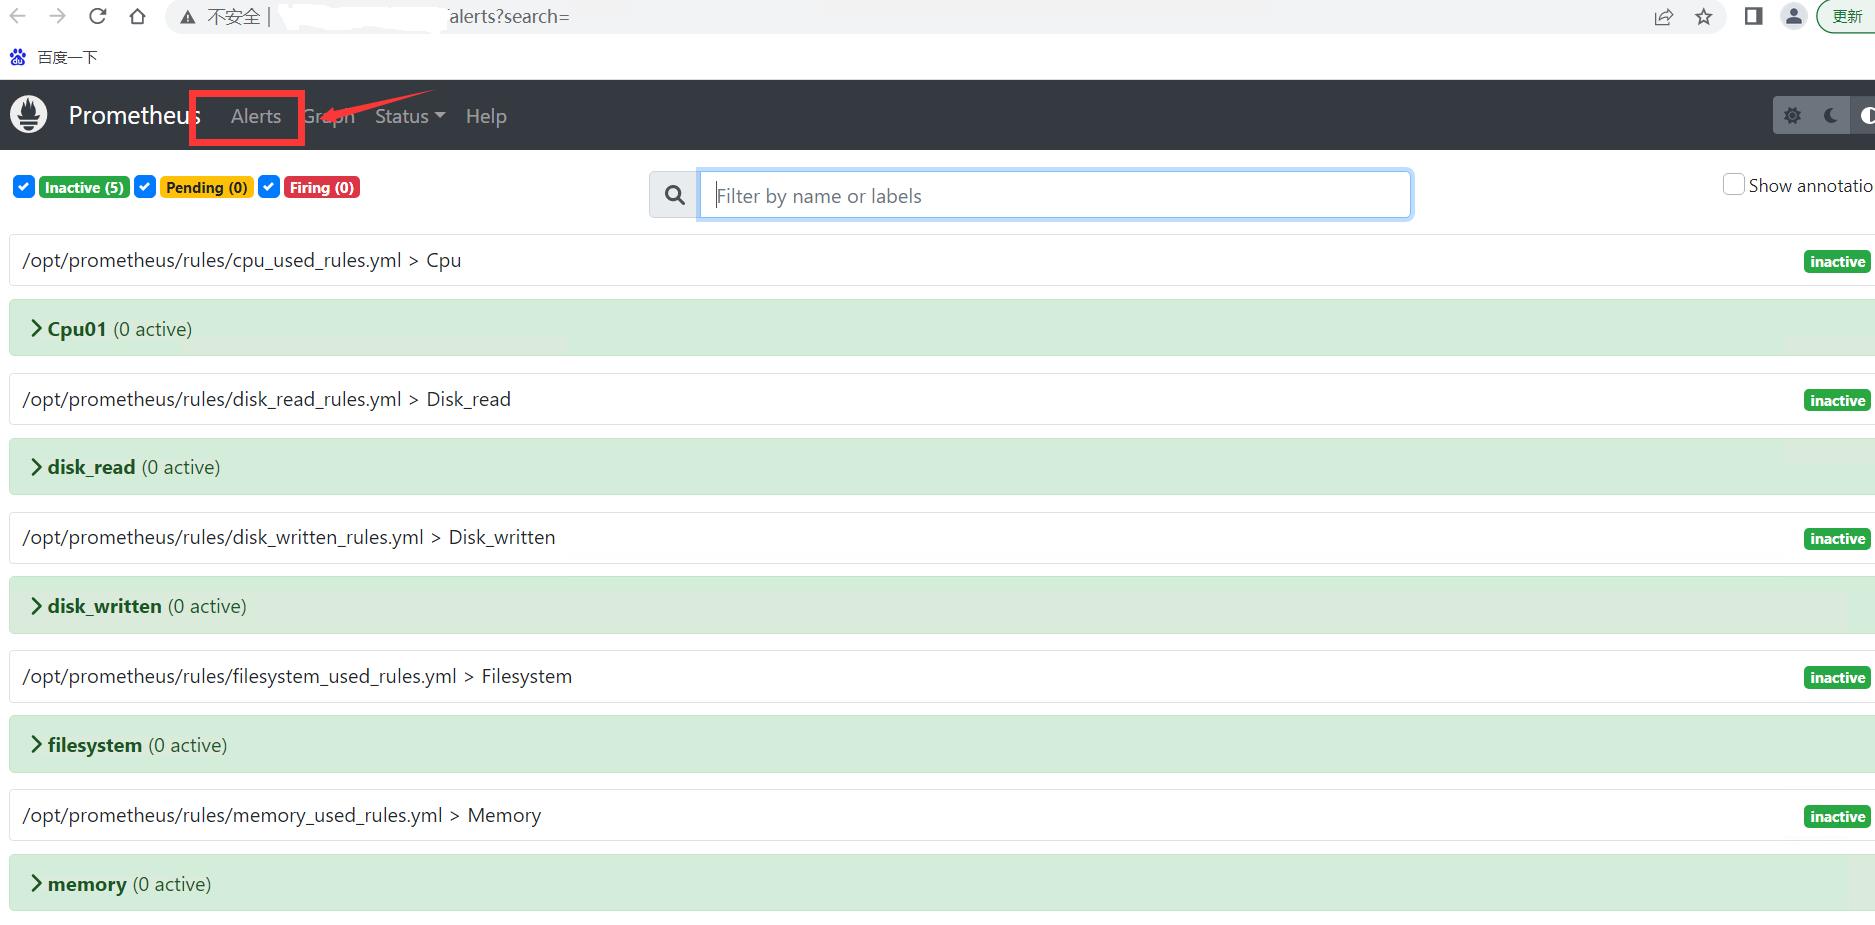
-
可以通过Prometheus的WebUI查看状态信息
报警阈值修改
修改配置文件expr字段末尾的数字
修改配置文件expr字段
[root@m01-176 rules]# cat *
groups:
- name: Cpu
  rules:
    - alert: Cpu01
      expr: "(1 - sum(increase(node_cpu_seconds_total{mode='idle'}[1m])) by (instance) / sum(increase(node_cpu_seconds_total[1m])) by (instance)) * 100 > 80"     #修改大于号后面的80,
      for: 1m
      labels:
        severity: warning # 自定一个一个标签 info 级别
      annotations:
        summary: "服务 {{ $labels.instance }} cpu 使用率过高"
        description: "{{ $labels.instance }} 的 cpu 在过去1分钟内使用过高,cpu 使用率 {{humanize $value}}."
相关技术文档
【PrometheusAlert入门】 - PrometheusAlert (gitbook.io)
| 项目 | |
|---|---|
| 监控普罗米修斯的目标客户端是否存活 | |
| 监控普罗米修斯的目标服务端是否存活 | |
| 监控普罗米修斯的服务端在过去15分钟内重启了两次以上 |
[root@m01-176 rules]# cat prometheus_self-monitoring_rules.yml
groups:
- name: Prmetheus-self-monitoring
  rules:
  #普罗米修斯的目标已经消失了。导出程序可能已崩溃
  - alert: PrometheusTargetMissing
    expr: up == 0
    for: 0m
    labels:
      severity: critical
    annotations:
      #summary: Prometheus target missing (instance {{ $labels.instance }})
      summary: "普罗米修斯的目标客户端 {{ $labels.instance }} 已经消失了。导出程序可能已崩溃。"
      description: "A Prometheus target has disappeared. An exporter might be crashed.\n  VALUE = {{ $value }}\n  LABELS = {{ $labels }}"
  #普罗米修斯的工作消失了
  - alert: PrometheusJobMissing
    expr: absent(up{job="prometheus"})
    for: 0m
    labels:
      severity: warning
    annotations:
      #summary: Prometheus job missing (instance {{ $labels.instance }})
      summary: "{{ $labels.instance }} 普罗米修斯服务端状态异常。"
      description: "A Prometheus job has disappeared\n  VALUE = {{ $value }}\n  LABELS = {{ $labels }}"
  #普罗米修斯在过去15分钟内重启了两次以上。它可能是崩溃
  - alert: PrometheusTooManyRestarts
    expr: changes(process_start_time_seconds{job=~"prometheus|pushgateway|alertmanager"}[15m]) > 2
    for: 0m
    labels:
      severity: warning
    annotations:
      #summary: Prometheus too many restarts (instance {{ $labels.instance }})
      summary: "{{ $labels.instance }} 普罗米修斯在过去15分钟内重启了两次以上。它可能是崩溃了."
      description: "Prometheus has restarted more than twice in the last 15 minutes. It might be crashlooping.\n  VALUE = {{ $value }}\n  LABELS = {{ $labels }}"
| 项目 | 阈值 |
|---|---|
| 主机网络接口可能接收到的数据过多 | (> 100 MB/s) |
| 主机网络接口可能发送的数据过多 | (> 100 MB/s) |
| 磁盘剩余的可用的 inode | 小于 10% |
| 检测到 OOM 杀伤 |
[root@m01-176 rules]# cat basic_resource_monitoring.yml
groups:
- name: Basic_resource_monitoring
  rules:
  #主机网络接口可能接收到的数据过多(> 100 MB/s)
  - alert: HostUnusualNetworkThroughputIn
    expr: sum by (instance) (rate(node_network_receive_bytes_total[2m])) / 1024 / 1024 > 100
    for: 5m
    labels:
      severity: warning
    annotations:
      #summary: Host unusual network throughput in (instance {{ $labels.instance }})
      summary: "{{ $labels.instance }} 网络接口接收到的数据过多,超过100Mb/s"
      description: "Host network interfaces are probably receiving too much data (> 100 MB/s)\n  VALUE = {{ $value }}\n  LABELS = {{ $labels }}"
  #主机网络接口可能发送的数据过多(> 100 MB/s)
  - alert: HostUnusualNetworkThroughputOut
    expr: sum by (instance) (rate(node_network_transmit_bytes_total[2m])) / 1024 / 1024 > 100
    for: 5m
    labels:
      severity: warning
    annotations:
      #summary: Host unusual network throughput out (instance {{ $labels.instance }}) "\n"
      summary: "{{ $labels.instance }} 网络接口可能发送的数据过多,超过100Mb/s"
      description: "Host network interfaces are probably sending too much data (> 100 MB/s)\n  VALUE = {{ $value }}\n  LABELS = {{ $labels }}"
  #磁盘几乎用完了可用的 inode(<剩余 10%)
  - alert: HostOutOfInodes
    expr: node_filesystem_files_free{mountpoint ="/rootfs"} / node_filesystem_files{mountpoint="/rootfs"} * 100 < 10 and ON (instance, device, mountpoint) node_filesystem_readonly{mountpoint="/rootfs"} == 0
    for: 2m
    labels:
      severity: warning
    annotations:
      #summary: Host out of inodes (instance {{ $labels.instance }})
      summary:  "{{ $labels.instance }} 磁盘剩余的可用的 inode 小于 10%"
      description: "Disk is almost running out of available inodes (< 10% left)\n  VALUE = {{ $value }}\n  LABELS = {{ $labels }}"
  #检测到 OOM 杀伤
  - alert: HostOomKillDetected
    expr: increase(node_vmstat_oom_kill[1m]) > 0
    for: 0m
    labels:
      severity: warning
    annotations:
      #summary: Host OOM kill detected (instance {{ $labels.instance }})
      summary: "{{ $labels.instance }} 检测到存在内存杀伤。"
      description: "OOM kill detected\n  VALUE = {{ $value }}\n  LABELS = {{ $labels }}"
本文来自博客园,作者:fwy,转载请注明原文链接:https://www.cnblogs.com/fwynb/p/17044216.html

 浙公网安备 33010602011771号