day04:举例:游戏公司运营分析
分析目标
-
为了了解当前游戏的运营情况,对游戏从以下3个方面进行分析
-
1.新增玩家分析:从玩家数量、付费玩家占比、每日新增玩家数
-
2.玩家活跃度分析:从不同用户在线时长、分布特征展开分析
-
3.玩家付费情况分析:从PUR,ARPPU、ARPU等关键指标进行分析
-
字段解读
-
'user_id': 玩家唯一ID
-
'pay_price': 付费金额
-
'register_time': 玩家注册时间
-
'avg_online_minutes': 在线时长
-
'pvp_battle_count': 与玩家对战次数
-
'pvp_lanch_count': 主动发起与玩家对战的次数
-
'pvp_win_count': 与玩家对战获胜的次数
-
'pve_battle_count': 与电脑对战次数
-
'pve_lanch_count': 主动发起与电脑对战的次数
-
'pve_win_count': 与电脑对战获胜次数
数据加载
In [ ]:
#导入需要的库
import pandas as pd
import numpy as np
import matplotlib.pyplot as plt
#忽略警告
import warnings
warnings.filterwarnings('ignore')

# 中文乱码的处理
plt.rcParams['font.sans-serif']=['PingFang HK'] #mac系统使用
# plt.rcParams['font.sans-serif'] = ['Microsoft YaHei']# windows使用设置微软雅黑字体
plt.rcParams['axes.unicode_minus'] = False # 避免坐标轴不能正常的显示负号
In [ ]:
# ./game_op.csv
df = pd.read_csv('./game_op.csv').drop(columns='Unnamed: 0')
df.head()
Out[ ]:
| user_id | pay_price | register_time | avg_online_minutes | pvp_battle_count | pvp_lanch_count | pvp_win_count | pve_battle_count | pve_lanch_count | pve_win_count | |
|---|---|---|---|---|---|---|---|---|---|---|
| 0 | 1 | 0.0 | 2018-02-02 19:47:15 | 0.333333 | 0 | 0 | 0 | 0 | 0 | 0 |
| 1 | 1593 | 0.0 | 2018-01-26 00:01:05 | 0.333333 | 0 | 0 | 0 | 0 | 0 | 0 |
| 2 | 1594 | 0.0 | 2018-01-26 00:01:58 | 1.166667 | 0 | 0 | 0 | 0 | 0 | 0 |
| 3 | 1595 | 0.0 | 2018-01-26 00:02:13 | 3.166667 | 0 | 0 | 0 | 0 | 0 | 0 |
| 4 | 1596 | 0.0 | 2018-01-26 00:02:46 | 2.333333 | 0 | 0 | 0 | 0 | 0 | 0 |
数据预处理
In [ ]:
df.info()<class 'pandas.core.frame.DataFrame'>
RangeIndex: 2288007 entries, 0 to 2288006
Data columns (total 10 columns):
# Column Dtype
--- ------ -----
0 user_id int64
1 pay_price float64
2 register_time object
3 avg_online_minutes float64
4 pvp_battle_count int64
5 pvp_lanch_count int64
6 pvp_win_count int64
7 pve_battle_count int64
8 pve_lanch_count int64
9 pve_win_count int64
dtypes: float64(2), int64(7), object(1)
memory usage: 174.6+ MBIn [ ]:
def get_date(d):
    return d.split(' ')[0]
df['register_time'] = df['register_time'].map(get_date)
In [ ]:
df['register_time'] = pd.to_datetime(df['register_time'])In [ ]:
df.info()<class 'pandas.core.frame.DataFrame'>
RangeIndex: 2288007 entries, 0 to 2288006
Data columns (total 10 columns):
# Column Dtype
--- ------ -----
0 user_id int64
1 pay_price float64
2 register_time datetime64[ns]
3 avg_online_minutes float64
4 pvp_battle_count int64
5 pvp_lanch_count int64
6 pvp_win_count int64
7 pve_battle_count int64
8 pve_lanch_count int64
9 pve_win_count int64
dtypes: datetime64[ns](1), float64(2), int64(7)
memory usage: 174.6 MBIn [ ]:
#是否存在缺失数据
df.isnull().any(axis=0)
Out[ ]:
user_id               False
pay_price             False
register_time         False
avg_online_minutes    False
pvp_battle_count      False
pvp_lanch_count       False
pvp_win_count         False
pve_battle_count      False
pve_lanch_count       False
pve_win_count         False
dtype: bool
In [ ]:
#是否存在重复数据
df.duplicated().sum()
Out[ ]:
0In [ ]:
df[['pay_price','avg_online_minutes']].describe()Out[ ]:
| pay_price | avg_online_minutes | |
|---|---|---|
| count | 2.288007e+06 | 2.288007e+06 |
| mean | 5.346691e-01 | 1.020749e+01 |
| std | 2.263835e+01 | 3.895946e+01 |
| min | 0.000000e+00 | 0.000000e+00 |
| 25% | 0.000000e+00 | 5.000000e-01 |
| 50% | 0.000000e+00 | 1.833333e+00 |
| 75% | 0.000000e+00 | 4.833333e+00 |
| max | 7.457950e+03 | 2.049667e+03 |
新增玩家分析
新增玩家数量
- 查看每日新增玩家数量
- 查看不同注册日期的用户数量
In [ ]:
day_grow_df = df.groupby(by='register_time')['user_id'].count().reset_index().rename(columns={'register_time':'注册时间','user_id':'新增用户数'})
day_grow_df
Out[ ]:
| 注册时间 | 新增用户数 | |
|---|---|---|
| 0 | 2018-01-26 | 70250 |
| 1 | 2018-01-27 | 70417 |
| 2 | 2018-01-28 | 79227 |
| 3 | 2018-01-29 | 63803 |
| 4 | 2018-01-30 | 50201 |
| 5 | 2018-01-31 | 56522 |
| 6 | 2018-02-01 | 83245 |
| 7 | 2018-02-02 | 60173 |
| 8 | 2018-02-03 | 51659 |
| 9 | 2018-02-04 | 60421 |
| 10 | 2018-02-05 | 60998 |
| 11 | 2018-02-06 | 57203 |
| 12 | 2018-02-07 | 71576 |
| 13 | 2018-02-08 | 72402 |
| 14 | 2018-02-09 | 50143 |
| 15 | 2018-02-10 | 53521 |
| 16 | 2018-02-11 | 54014 |
| 17 | 2018-02-12 | 52231 |
| 18 | 2018-02-13 | 50638 |
| 19 | 2018-02-14 | 54419 |
| 20 | 2018-02-15 | 78707 |
| 21 | 2018-02-16 | 56355 |
| 22 | 2018-02-17 | 44477 |
| 23 | 2018-02-18 | 59447 |
| 24 | 2018-02-19 | 117311 |
| 25 | 2018-02-20 | 92860 |
| 26 | 2018-02-21 | 43720 |
| 27 | 2018-02-22 | 42110 |
| 28 | 2018-02-23 | 44635 |
| 29 | 2018-02-24 | 45648 |
| 30 | 2018-02-25 | 49835 |
| 31 | 2018-02-26 | 42647 |
| 32 | 2018-02-27 | 39140 |
| 33 | 2018-02-28 | 42928 |
| 34 | 2018-03-01 | 36226 |
| 35 | 2018-03-02 | 42775 |
| 36 | 2018-03-03 | 48970 |
| 37 | 2018-03-04 | 50989 |
| 38 | 2018-03-05 | 44726 |
| 39 | 2018-03-06 | 41438 |
In [ ]:
plt.plot(day_grow_df['注册时间'],day_grow_df['新增用户数'])
plt.xticks(rotation=30)
Out[ ]:
(array([17563., 17570., 17577., 17584., 17591.]),
 [Text(0, 0, ''),
  Text(0, 0, ''),
  Text(0, 0, ''),
  Text(0, 0, ''),
  Text(0, 0, '')])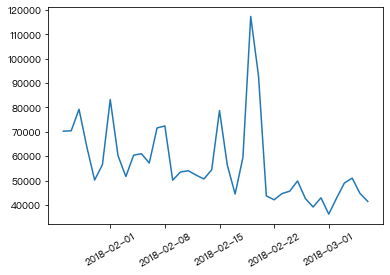
结论:在2月18日左右会有一次新增用户的大幅增长。其次,在1月27日、2月1日和2月15日左右都有几次小高峰的增长。
新增付费玩家用户数量
- 查看每日新增付费玩家数量
In [ ]:
pay_df = df.loc[df['pay_price'] > 0]
pay_df
Out[ ]:
| user_id | pay_price | register_time | avg_online_minutes | pvp_battle_count | pvp_lanch_count | pvp_win_count | pve_battle_count | pve_lanch_count | pve_win_count | |
|---|---|---|---|---|---|---|---|---|---|---|
| 25 | 1617 | 0.99 | 2018-01-26 | 44.666667 | 0 | 0 | 0 | 0 | 0 | 0 |
| 40 | 1632 | 2.97 | 2018-01-26 | 199.333333 | 1 | 1 | 1 | 6 | 6 | 6 |
| 47 | 1639 | 12.97 | 2018-01-26 | 109.333333 | 0 | 0 | 0 | 0 | 0 | 0 |
| 86 | 1678 | 0.99 | 2018-01-26 | 127.833333 | 0 | 0 | 0 | 0 | 0 | 0 |
| 119 | 1711 | 0.99 | 2018-01-26 | 203.166667 | 0 | 0 | 0 | 0 | 0 | 0 |
| ... | ... | ... | ... | ... | ... | ... | ... | ... | ... | ... |
| 2287944 | 3190468 | 0.99 | 2018-02-03 | 168.666667 | 11 | 8 | 7 | 21 | 21 | 15 |
| 2287946 | 3190470 | 352.77 | 2018-02-03 | 548.500000 | 51 | 36 | 38 | 161 | 161 | 151 |
| 2287960 | 3190484 | 0.99 | 2018-02-03 | 185.666667 | 9 | 0 | 7 | 77 | 77 | 74 |
| 2287970 | 3190494 | 0.99 | 2018-02-03 | 62.000000 | 13 | 5 | 5 | 18 | 18 | 18 |
| 2287984 | 3190508 | 1.98 | 2018-02-03 | 20.333333 | 5 | 2 | 4 | 10 | 10 | 7 |
41439 rows × 10 columns
In [ ]:
pay_grow_df = pay_df.groupby(by='register_time')['user_id'].count().reset_index().rename(columns={'register_time':'注册时间','user_id':'新增用户数'})
pay_grow_df
Out[ ]:
| 注册时间 | 新增用户数 | |
|---|---|---|
| 0 | 2018-01-26 | 1636 |
| 1 | 2018-01-27 | 1519 |
| 2 | 2018-01-28 | 1513 |
| 3 | 2018-01-29 | 1498 |
| 4 | 2018-01-30 | 1236 |
| 5 | 2018-01-31 | 1032 |
| 6 | 2018-02-01 | 1126 |
| 7 | 2018-02-02 | 1393 |
| 8 | 2018-02-03 | 1201 |
| 9 | 2018-02-04 | 1155 |
| 10 | 2018-02-05 | 1356 |
| 11 | 2018-02-06 | 992 |
| 12 | 2018-02-07 | 976 |
| 13 | 2018-02-08 | 1016 |
| 14 | 2018-02-09 | 1111 |
| 15 | 2018-02-10 | 1039 |
| 16 | 2018-02-11 | 962 |
| 17 | 2018-02-12 | 1206 |
| 18 | 2018-02-13 | 841 |
| 19 | 2018-02-14 | 703 |
| 20 | 2018-02-15 | 687 |
| 21 | 2018-02-16 | 989 |
| 22 | 2018-02-17 | 749 |
| 23 | 2018-02-18 | 784 |
| 24 | 2018-02-19 | 1052 |
| 25 | 2018-02-20 | 839 |
| 26 | 2018-02-21 | 1021 |
| 27 | 2018-02-22 | 834 |
| 28 | 2018-02-23 | 1007 |
| 29 | 2018-02-24 | 866 |
| 30 | 2018-02-25 | 855 |
| 31 | 2018-02-26 | 1034 |
| 32 | 2018-02-27 | 695 |
| 33 | 2018-02-28 | 740 |
| 34 | 2018-03-01 | 666 |
| 35 | 2018-03-02 | 1032 |
| 36 | 2018-03-03 | 904 |
| 37 | 2018-03-04 | 994 |
| 38 | 2018-03-05 | 1169 |
| 39 | 2018-03-06 | 1011 |
In [ ]:
plt.plot(pay_grow_df['注册时间'],pay_grow_df['新增用户数'])
plt.xticks(rotation=30)
Out[ ]:
(array([17563., 17570., 17577., 17584., 17591.]),
 [Text(0, 0, ''),
  Text(0, 0, ''),
  Text(0, 0, ''),
  Text(0, 0, ''),
  Text(0, 0, '')])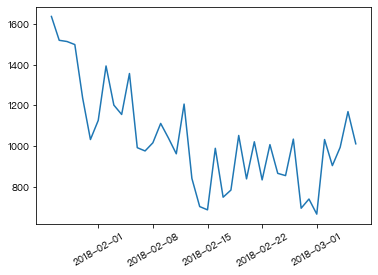
结论:每天新增付费玩家的用户数量是在浮动式的下滑。
新增付费玩家占比
- 查看新增用户数量
In [ ]:
grow_sum = day_grow_df['新增用户数'].sum()- 查看新增付费玩家用户数量
In [ ]:
pay_sum = pay_grow_df['新增用户数'].sum()- 绘制图例显示新增用户总数和新增付费用户总数的占比情况
In [ ]:
plt.pie([grow_sum,pay_sum],labels=['总新增用户数','新增付费用户数'],autopct='%.2f%%')Out[ ]:
([<matplotlib.patches.Wedge at 0x285b33730>,
  <matplotlib.patches.Wedge at 0x285b31490>],
 [Text(-1.0982826393725091, 0.06144301467990718, '总新增用户数'),
  Text(1.098282643687039, -0.061442937558425566, '新增付费用户数')],
 [Text(-0.5990632578395504, 0.033514371643585734, '98.22%'),
  Text(0.5990632601929303, -0.03351432957732303, '1.78%')])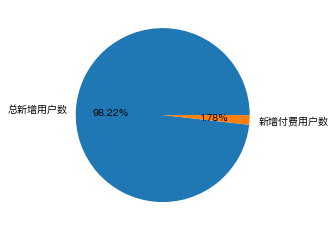
玩家活跃度分析
全部玩家平均在线时长
In [ ]:
avg_time = df['avg_online_minutes'].mean()
avg_time
Out[ ]:
10.207489627790176付费玩家的平均在线时长
In [ ]:
pay_df['avg_online_minutes'].mean()Out[ ]:
140.18774584526693结论:明显可以看出,付费玩家的平均在线时长要远远大于全体玩家的平均值,活跃度比他们高得多。
平均在线时长的分布特点
- 全部玩家在线时长的分布特点
In [ ]:
df['avg_online_minutes'].describe()Out[ ]:
count    2.288007e+06
mean     1.020749e+01
std      3.895946e+01
min      0.000000e+00
25%      5.000000e-01
50%      1.833333e+00
75%      4.833333e+00
max      2.049667e+03
Name: avg_online_minutes, dtype: float64
结论:所有的玩家中,75%的用户平均在线时长是<5分钟,说明用户流失相对比较严重。
- 付费玩家在线时长的分布特点
In [ ]:
pay_df['avg_online_minutes'].describe()Out[ ]:
count    41439.000000
mean       140.187746
std        149.972913
min          0.000000
25%         33.000000
50%         88.833333
75%        194.666667
max       1674.666667
Name: avg_online_minutes, dtype: float64
结论:在付费用户中,有75%的用户的平均在线时长是超过了33分钟。
玩家付费情况分析
关键指标
- AU:活跃用户数
- 平均在线时长超过15分钟的用户数量
- ARPU:平均每个活跃用户的收入
- 总收入 / AU活跃用户数
- APA:活跃付费用户数
- 是活跃用户并且也是付费用户的用户数量
- ARPPU:平均付费玩家收入
- 总收入 / APA活跃付费用户数
- PUR:付费率
- APA活跃付费用户数 / AU活跃用户数
指标计算
- 活跃用户数AU
- 平均在线时长超过15分钟的用户数量
In [ ]:
#取出了所有活跃用户的行数据
au_df = df.loc[df['avg_online_minutes'] >= 15]
au_df
Out[ ]:
| user_id | pay_price | register_time | avg_online_minutes | pvp_battle_count | pvp_lanch_count | pvp_win_count | pve_battle_count | pve_lanch_count | pve_win_count | |
|---|---|---|---|---|---|---|---|---|---|---|
| 25 | 1617 | 0.99 | 2018-01-26 | 44.666667 | 0 | 0 | 0 | 0 | 0 | 0 |
| 29 | 1621 | 0.00 | 2018-01-26 | 24.166667 | 0 | 0 | 0 | 0 | 0 | 0 |
| 40 | 1632 | 2.97 | 2018-01-26 | 199.333333 | 1 | 1 | 1 | 6 | 6 | 6 |
| 47 | 1639 | 12.97 | 2018-01-26 | 109.333333 | 0 | 0 | 0 | 0 | 0 | 0 |
| 64 | 1656 | 0.00 | 2018-01-26 | 25.333333 | 0 | 0 | 0 | 0 | 0 | 0 |
| ... | ... | ... | ... | ... | ... | ... | ... | ... | ... | ... |
| 2287960 | 3190484 | 0.99 | 2018-02-03 | 185.666667 | 9 | 0 | 7 | 77 | 77 | 74 |
| 2287964 | 3190488 | 0.00 | 2018-02-03 | 34.166667 | 10 | 4 | 4 | 6 | 6 | 4 |
| 2287970 | 3190494 | 0.99 | 2018-02-03 | 62.000000 | 13 | 5 | 5 | 18 | 18 | 18 |
| 2287984 | 3190508 | 1.98 | 2018-02-03 | 20.333333 | 5 | 2 | 4 | 10 | 10 | 7 |
| 2287994 | 3190518 | 0.00 | 2018-02-03 | 94.833333 | 26 | 20 | 15 | 23 | 23 | 15 |
229208 rows × 10 columns
In [ ]:
AU = au_df['user_id'].count()
AU
Out[ ]:
229208- 平均每个活跃用户的收入ARPU
- 总收入 / AU活跃用户数
In [ ]:
total_amount = df['pay_price'].sum()
ARPU = float(format(total_amount / AU,'.2f'))
ARPU
Out[ ]:
5.34- 活跃付费用户数APA
- 是活跃用户并且也是付费用户的用户数量
In [ ]:
APA = df.query('avg_online_minutes >= 15 & pay_price > 0')['user_id'].count()
APA
Out[ ]:
36339- 平均付费玩家收入ARPPU
- 总收入 / APA活跃付费用户数
In [ ]:
ARPPU = float(format(total_amount / APA,'.2f'))
ARPPU
Out[ ]:
33.66- 付费率PUR:
- APA活跃付费用户数 / AU活跃用户数
In [ ]:
PUR = float(format(APA / AU,'.2f'))
PUR
Out[ ]:
0.16- 核心指标数据可视化
In [ ]:
ax1 = plt.subplot(1,2,1)
ax1.bar(['AU','APA'],[AU,APA],width=0.5,alpha=0.5)

ax2 = plt.subplot(1,2,2)
ax2.bar(['ARPU','ARPPU'],[ARPU,ARPPU],width=0.5,alpha=0.5,color='red')
Out[ ]:
<BarContainer object of 2 artists>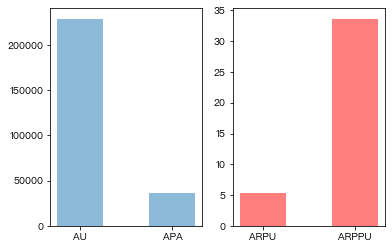
- 结论:
- APA活跃付费用户远低于活跃用户数AU。并且该游戏的活跃用户的人均付费率ARPU很低,说明游戏收入表现较差,但是对比ARPU,平均每个付费用户的ARPPU很高,是ARPU的6倍多,说明游戏对活跃用户的体验感较差。
- 付费率为0.16偏低,因此可以开展首冲活动,让用户充值少量的钱,开始逐渐付费,例如充值6元获得限量的礼包。付费率高,就可以更多的获得渠道商的青睐。

 浙公网安备 33010602011771号