
Prometheus监控部署
Prometheus监控安装
二进制部署
- 下载安装包
下载最新的安装包
官方参考文档
- 解压及配置
tar xvfz prometheus-*.tar.gz
cd prometheus-*
mv prometheus-* /usr/local/prometheus
cat  /usr/lib/systemd/system/prometheus.service
[Unit]
Description=https://prometheus.io

[Service]
Restart=on-failure
ExecStart=/usr/local/prometheus/prometheus --config.file=/usr/local/prometheus/prometheus.yml

[Install]
WantedBy=multi-user.target
- 启动
systemctl start prometheus && systemctl enable prometheus
Docker方式部署
- 配置 prometheus.yml
cat /tmp/prometheus.yml
# my global config
global:
  scrape_interval:     15s # Set the scrape interval to every 15 seconds. Default is every 1 minute.
  evaluation_interval: 15s # Evaluate rules every 15 seconds. The default is every 1 minute.
  # scrape_timeout is set to the global default (10s).

# Alertmanager configuration
alerting:
  alertmanagers:
  - static_configs:
    - targets:
      # - alertmanager:9093

# Load rules once and periodically evaluate them according to the global 'evaluation_interval'.
rule_files:
  # - "first_rules.yml"
  # - "second_rules.yml"

# A scrape configuration containing exactly one endpoint to scrape:
# Here it's Prometheus itself.
scrape_configs:
  # The job name is added as a label `job=<job_name>` to any timeseries scraped from this config.
  - job_name: 'prometheus'

    # metrics_path defaults to '/metrics'
    # scheme defaults to 'http'.

    static_configs:
    - targets: ['localhost:9090']
-
运行Prometheus
docker run -p 9090:9090 -v /tmp/prometheus.yml:/etc/prometheus/prometheus.yml prom/prometheus
可视化方案Grafana
prometheus多数情况下需要结合Grafana工具来达到可视化效果,Grafana是一个开源的度量分析和可视化工具。
下载Grafana
- docker方式部署
docker run -d --name=grafana -p 3000:3000 grafana/grafana
docker客户端监控
cAdvisor(Container Advisor)用于收集正在运行的容器资源使用和性能信息
GitHub介绍
- 客户端部署
docker run -d \
--volume=/:/rootfs:ro \
--volume=/var/run:/var/run:ro \
--volume=/sys:/sys:ro \
--volume=/var/lib/docker/:/var/lib/docker:ro \
--volume=/dev/disk/:/dev/disk:ro \
--publish=8080:8080 \
--detach=true \
--name=cadvisor \
google/cadvisor:latest
- 配置/tmp/prometheus.yml
cat /tmp/prometheus.yml
将配置添加到后面
......
# 添加新主机
  - job_name: 'docker'
    static_configs:
    - targets: ['172.16.230.17:8080','192.168.20.157:8080']
- 重启Prometheus
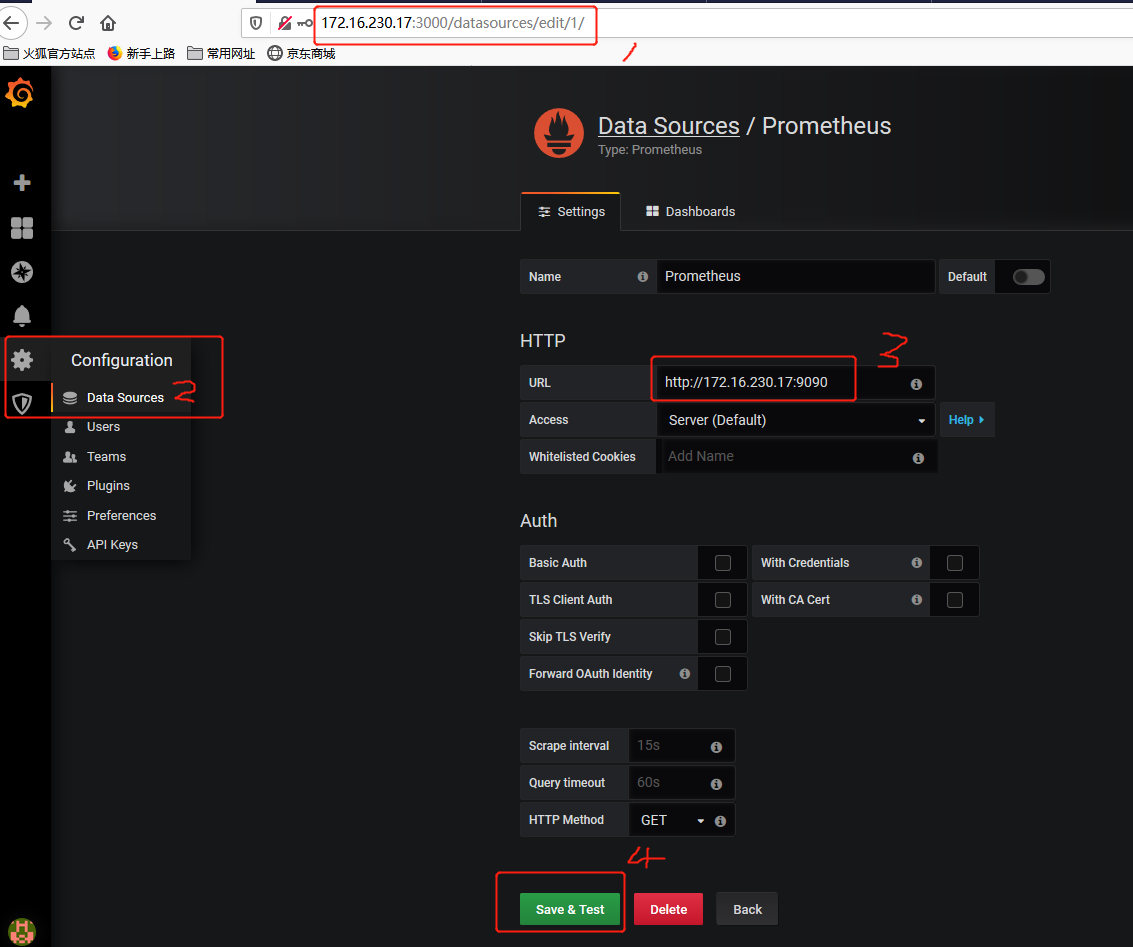
重启后进行访问即可看到新添加的主机数据。 - 配置grafana
访问:ip:3000 admin/admin
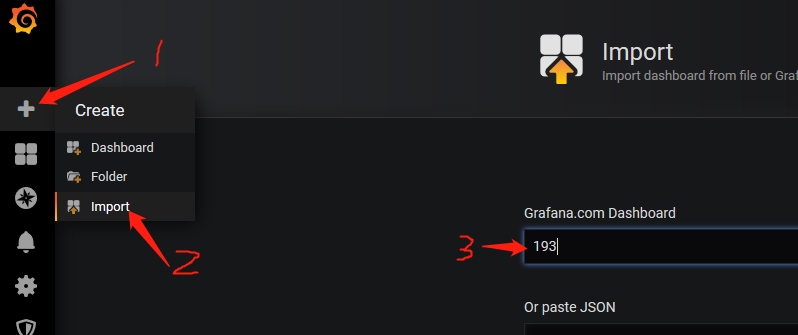
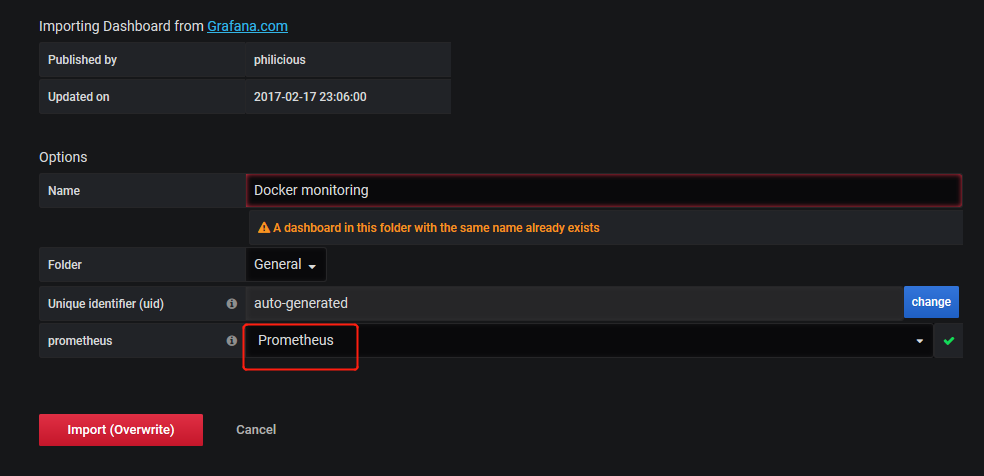
- 导入仪表盘
仪表盘导入时,只需输入id编号即可跳转。
Grafana共享仪表盘
https://grafana.com/grafana/dashboards
- 查看
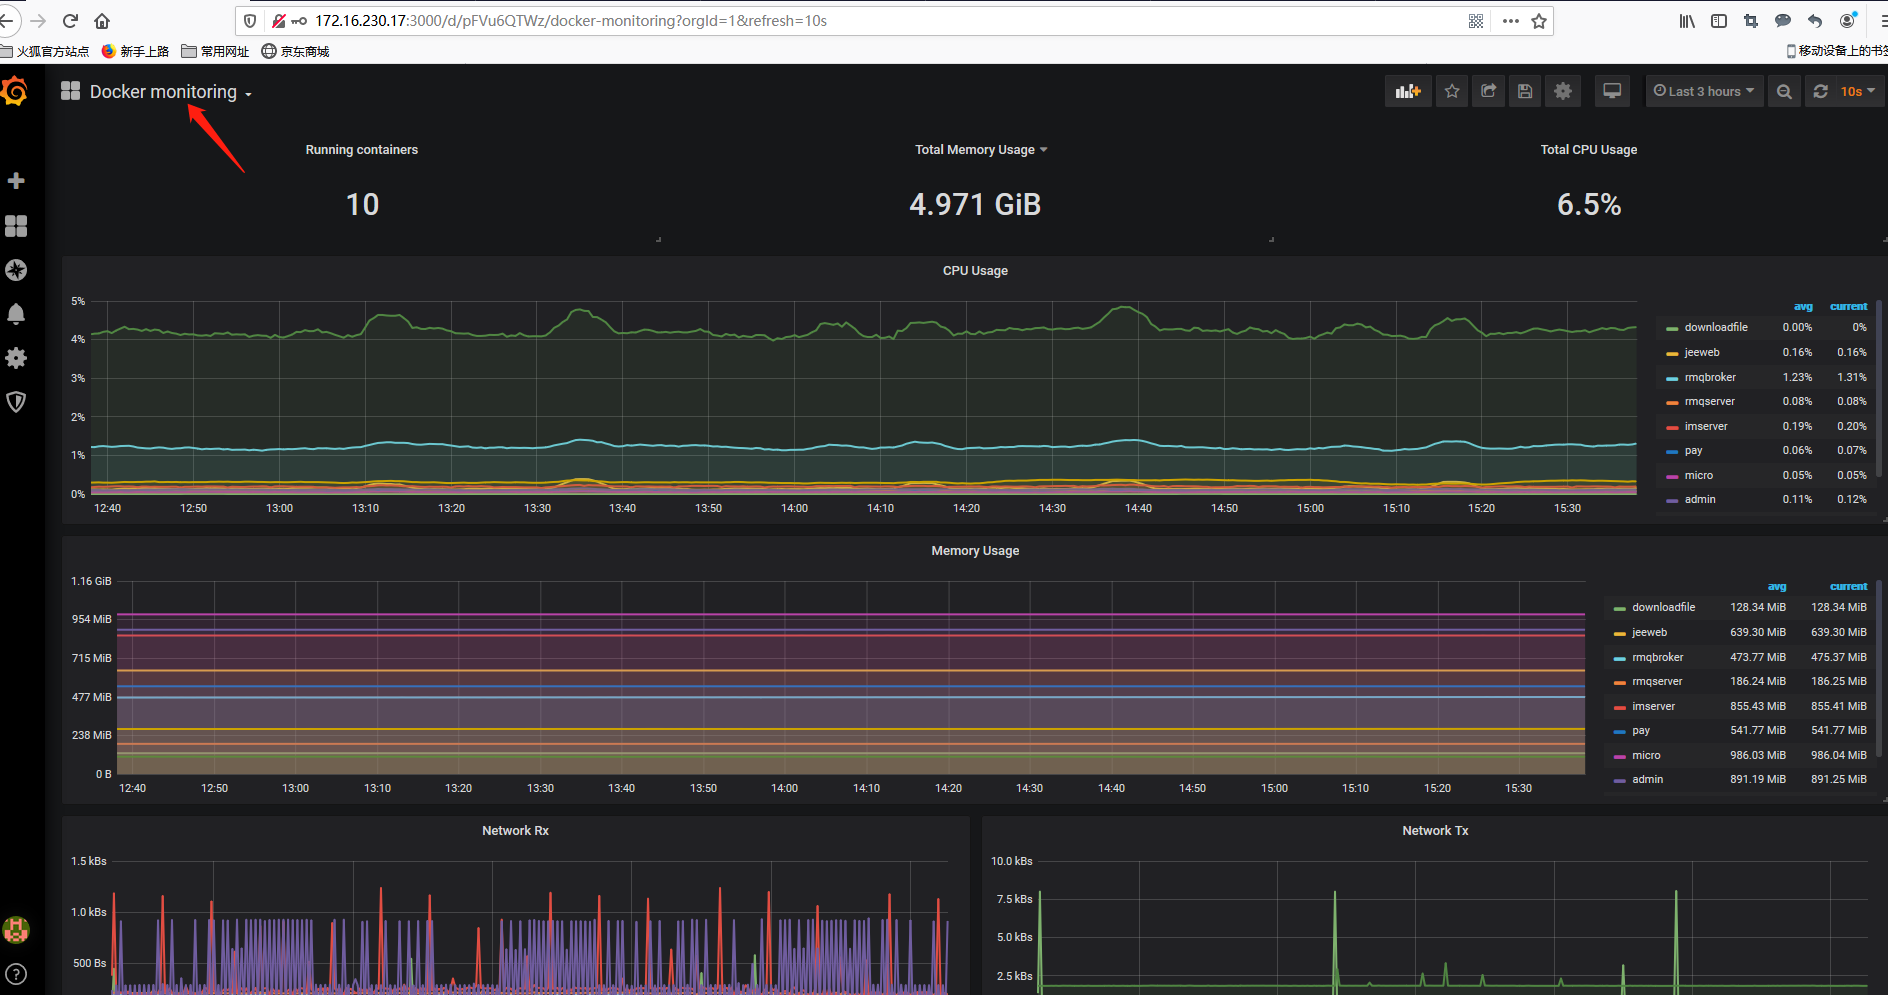
数据量的采集,取决于被监控端的数据量,如果数据无法显示请检查/tmp/prometheus.yml配置文件。可同时监控多个主机。
详情见另一篇文章。
相关参考文章

 浙公网安备 33010602011771号