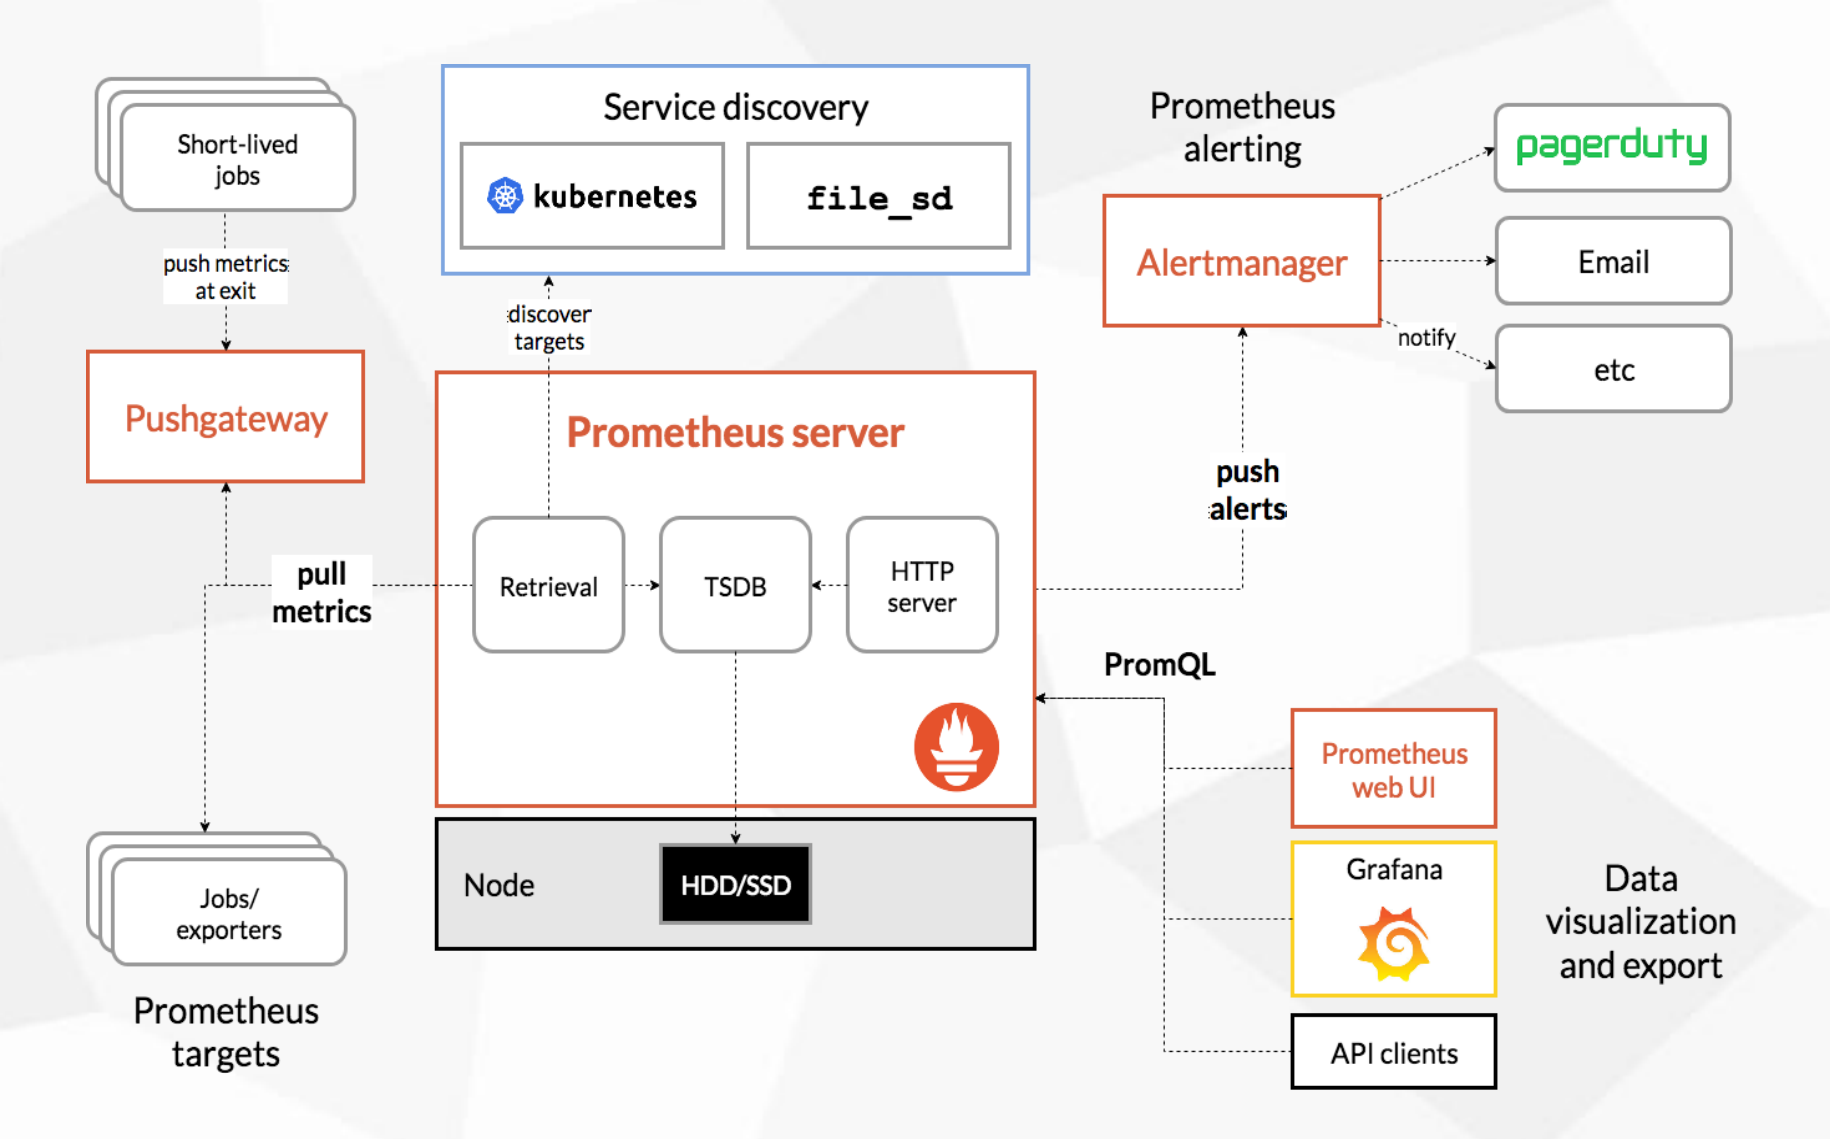
Prometheus
1.Prometheus安装
- 创建prometheus工作目录,解压二进制包并放到工作目录下
mkdir /data
tar xvfz prometheus-*.tar.gz
mv prometheus /data/
- 创建Prometheus的启动托管文件 /etc/systemd/system/prometheus.service
[Unit]
Description=Prometheus server daemon
After=network.target

[Service]
Type=simple
ExecStart=/data/prometheus/prometheus     \
--config.file=/data/prometheus/prometheus.yml     \
--storage.tsdb.path=/data/prometheus/data    \
--storage.tsdb.retention=30d     \
--web.console.templates=/data/prometheus/consoles     \
--web.console.libraries=/data/prometheus/console_libraries     \
--web.external-url=http://192.168.1.45:9090      \
--web.enable-admin-api \
--web.listen-address=0.0.0.0:9090
Restart=on-failure
ExecReload=/bin/kill -HUP $MAINPID

[Install]
WantedBy=multi-user.target
- 启动Prometheus
systemctl daemon-reload
systemctl start prometheus
2.Prometheus配置文件
1.全局配置文件
# 全局默认配置
global:
  # 监控指标采集频率,默认1m
  scrape_interval: 1m

  # 监控指标采集超时时长,默认10s
  scrape_timeout: 10s

  # 告警评估时长,默认1m
  evaluation_interval: 1m

# 监控告警规则
rule_files:
  - "/etc/prometheus/rules/*.yml"

# 被监控主机参数
scrape_configs:
  [ - <scrape_config> ... ]

# 告警配置参数
alerting:
  alert_relabel_configs:
    [ - <relabel_config> ... ]
  alertmanagers:
    [ - <alertmanager_config> ... ]

# 远程数据库
remote_write:
  [ - <remote_write> ... ]
remote_read:
  [ - <remote_read> ... ]
2.scrape_configs配置
# 在prometheus中显示的job名称
job_name: <job_name>

# 监控指标采集频率,默认使用全局参数
[ scrape_interval: <duration> | default = <global_config.scrape_interval> ]

# 监控指标采集超时时长,默认全局参数
[ scrape_timeout: <duration> | default = <global_config.scrape_timeout> ]

# 监控指标采集后存放的路径,默认/metrics
[ metrics_path: <path> | default = /metrics ]

# 是否覆盖同名的标签,默认false,会重命名标签
[ honor_labels: <boolean> | default = false ]

# 覆盖标签时的时间戳?
[ honor_timestamps: <boolean> | default = true ]

# 采集指标时使用的协议,默认http
[ scheme: <scheme> | default = http ]

# 采集指标时携带的参数
params:
  [ <string>: [<string>, ...] ]

# 采集指标时的用户名和密码,password_file和其他的不能同时使用
basic_auth:
  [ username: <string> ]
  [ password: <secret> ]
  [ password_file: <string> ]

# 使用证书认证
authorization:
  [ type: <string> | default: Bearer ]
  [ credentials: <secret> ]
  [ credentials_file: <filename> ]

# 使用三方认证
oauth2:
  [ <oauth2> ]

# 是否接受重定向,默认true
[ follow_redirects: <boolean> | default = true ]

# tls参数
tls_config:
  [ <tls_config> ]

# 代理参数
[ proxy_url: <string> ]

# 被监控主机发现的方式
azure_sd_configs:
consul_sd_configs:
digitalocean_sd_configs:
docker_sd_configs:
dockerswarm_sd_configs:
dns_sd_configs:
ec2_sd_configs:
eureka_sd_configs:
file_sd_configs:
gce_sd_configs:
hetzner_sd_configs:
http_sd_configs:
kubernetes_sd_configs:
kuma_sd_configs:
lightsail_sd_configs:
linode_sd_configs:
marathon_sd_configs:
nerve_sd_configs:
openstack_sd_configs:
puppetdb_sd_configs:
scaleway_sd_configs:
serverset_sd_configs:
triton_sd_configs:
uyuni_sd_configs:
static_configs:

# 重新打标签
relabel_configs:

#
metric_relabel_configs:

# body大小限制,默认不限制
[ body_size_limit: <size> | default = 0 ]

# 采集次数限制,默认不限制
[ sample_limit: <int> | default = 0 ]

# 采集指标的标签个数限制,默认不限制
[ label_limit: <int> | default = 0 ]

# 采集指标的标签名称长度的限制,默认不限制
[ label_name_length_limit: <int> | default = 0 ]

# 采集指标的标签值长度限制,默认不限制
[ label_value_length_limit: <int> | default = 0 ]

# 采集指标的标签个数限制,默认不限制
[ target_limit: <int> | default = 0 ]
3.relabel_configs配置
# 源标签
[ source_labels: '[' <labelname> [, ...] ']' ]

# 多个源标签时连接的分隔符,默认;
[ separator: <string> | default = ; ]

# 重新标记的标签
[ target_label: <labelname> ]

# 正则表达式匹配的源标签值
[ regex: <regex> | default = (.*) ]

# Modulus to take of the hash of the source label values.
[ modulus: <int> ]

# 替换正则表达式匹配到的分组,分组引用$1,$2
[ replacement: <string> | default = $1 ]

# 基于正则表达式匹配执行的操作
[ action: <relabel_action> | default = replace ]
4.file_sd_configs配置
基于配置文件的服务发现
# 指定服务所在的文件,文件可以以.json, .yml or .yaml结尾,同样可以使用通配符
# 例如my/path/tg_*.json.
files:
  [ - <filename_pattern> ... ]

# 重新读取服务所在文件的间隔,默认5m
[ refresh_interval: <duration> | default = 5m ]
指定服务所在的文件需要是JSON或yaml格式
JSON [ { "targets": [ "", ... ], "labels": { " ": " ", ... } }, ... ]
YAML - targets: [ - '' ] labels: [ : ... ]
示例:
/data/prometheus/prometheus.yml
global:
  scrape_interval: 15s
  evaluation_interval: 15s

alerting:
  alertmanagers:
    - static_configs:
        - targets: ["localhost:9093"]

rule_files:
  - "/etc/prometheus/rules/*.yml"

scrape_configs:
  - job_name:  'pushgateway'
    honor_labels: true
    scrape_interval: 15s
    scrape_timeout: 10s
    metrics_path: /metrics
    file_sd_configs:
      - files:
        - /etc/prometheus/pushgateway/*.json
        refresh_interval: 5s
/etc/prometheus/rules/iot_heart.yml
groups:
- name: iot心跳信息
  rules:
  - alert: 网关心跳异常
    expr: tstiot_machine_running_stat_influxdb{job="tstiot"} != 1
    for: 10m
    labels:
      severity: warning
    annotations:
      summary: "{{ $labels.machine_id }}无法收到心跳信息"
/etc/prometheus/pushgateway/pushgateway.json
[{
    "targets": [ "127.0.0.1:9091" ]
}]
3.Pushgateway
- 解压二进制包,移动到工作目录
tar xf pushgateway.tar.gz
mkdir /data/pushgateway
mv pushgateway /data/pushgateway/
- 创建服务托管文件
/etc/systemd/system/pushgateway.service
[Unit]
Description=pushgateway server daemon
After=network.target

[Service]
Type=simple
ExecStart=/data/pushgateway/pushgateway
Restart=on-failure
ExecReload=/bin/kill -HUP $MAINPID

[Install]
WantedBy=multi-user.target
pushgateway默认配置启动就可以,prometheus会定时拉取数据
4.Alertmanager
- 解压二进制包,移动到工作目录
tar xf alertmanager.tar.gz
mkdir /data/alertmanager/
mv alertmanager  /data/alertmanager/
- 创建alertmanager启动托管文件 /etc/systemd/system/alertmanager.service
[Unit]
Description=alertmanager server daemon
After=network.target

[Service]
Type=simple
ExecStart=/data/alertmanager/alertmanager --config.file=/etc/prometheus/alertmanager/config.yml
Restart=on-failure
ExecReload=/bin/kill -HUP $MAINPID

[Install]
WantedBy=multi-user.target
- 创建alertmanager配置文件 /etc/prometheus/alertmanager/config.yml
route:
  # 以alertname为标签进行分组,这个标签是rules规则中的name值
  group_by: ['alertname']
  # 分组等待30秒
  group_wait: 30s
  group_interval: 5m
  # 重复发送警报间隔时长
  repeat_interval: 24h
  # 报警默认发送的接收者,如果下面匹配的规则都没有匹配上就发送给这个默认的
  receiver: 'tianche'
  routes:
  - receiver: 'tianche'
    group_wait: 30s
	# 匹配标签
    match_re:
      job: tianche
  - receiver: 'tstiot'
    group_wait: 30s
    match_re:
      job: tstiot
receivers:
# 真正发送报警的配置
- name: 'tianche'
# 这个地址连接的是Prometheus-webhook-dingtalk
  webhook_configs:
  - url: 'http://localhost:8060/dingtalk/webhook1/send'
    send_resolved: false

- name: 'tstiot'
  webhook_configs:
  - url: 'http://localhost:8060/dingtalk/webhook2/send'
    send_resolved: false

# 抑制功能
inhibit_rules:
  - source_match:
      severity: 'critical'
    target_match:
      severity: 'warning'
    equal: ['alertname', 'dev', 'instance']
5.prometheus-webhook-dingding
- 解压二进制程序并放到工作目录
tar xf prometheus-webhoob-dingding.tar.gz
mv prometheus-webhook-dingding /data/alertmanager
- 创建配置文件
/etc/prometheus/dingtalk/config.yml
targets:
  webhook1:
    url: https://oapi.dingtalk.com/robot/send?access_token=c00be30ef17f59c5b44c
    secret: SEC67753f8
    mention:
      all: true
  webhook2:
    url: https://oapi.dingtalk.com/robot/send?access_token=c741e138b3cbfe
    secret: SEC0258f0e414a8
    mention:
      all: true
- 创建服务托管文件
/etc/systemd/system/dingtalk.service
[Unit]
Description=dingtalk server daemon
After=network.target

[Service]
Type=simple
ExecStart=/data/alertmanager/prometheus-webhook-dingtalk --config.file=/etc/prometheus/dingtalk/config.yml
Restart=on-failure
ExecReload=/bin/kill -HUP $MAINPID


[Install]
WantedBy=multi-user.target
- 启动程序
systemctl daemon-reload
systemctl start dingtalk
systemctl enable dingtalk
初学linux,每学到一点东西就写一点,如有不对的地方,恳请包涵!

 浙公网安备 33010602011771号