highcharts中的仪表盘样式
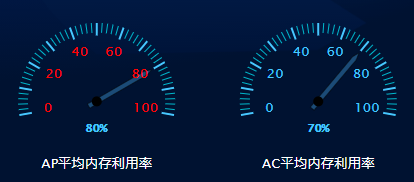
仪表盘的样式如下:
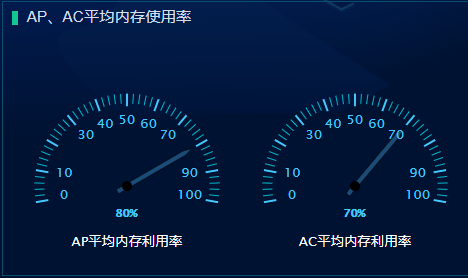
是双表盘展示
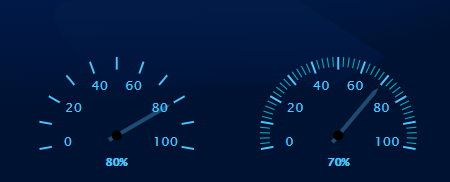
左边的图中minorTickInterval的值为null,右边的minorTickInterval的值为“auto”
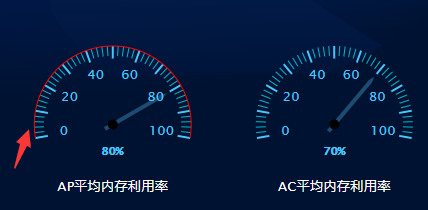
左边的图中lineColor的值为‘#f00’,右边的lineColor的值为“transparent”
yAxis: [{
    min: 0,
    // 最小刻度值
    max: 100,
    // 最大刻度值
    minorTickInterval: 'auto',
    // 表盘中比较短的刻度值
    minorTickWidth: that.torem(2),
    // 表盘中比较短的刻度值的宽度
    minorTickLength: that.torem(20),
    // 表盘中比较短的刻度值的长度
    minorTickPosition: 'inside',
    // 表盘中比较短的刻度值在内部还是在外部显示
    minorTickColor: '#00bfd3',
    // 表盘中比较短的刻度值的颜色
    tickPixelInterval: 'auto',
    // 表盘中比较长的刻度值
    tickWidth: that.torem(4),
    // 表盘中比较长的刻度值的宽度
    tickPosition: 'inside',
    // 表盘中比较长的刻度值在内部还是在外部显示
    tickLength: that.torem(26),
    // 表盘中比较长的刻度值的长度
    tickColor: '#48c7ff',
    // 表盘中比较长的刻度值的颜色
    tickInterval: 10,
    // 间隔
    lineColor: 'transparent',
    // 表盘最外层的连接线
}]
labels: {
    style: { // 刻度值数字的样式
        color: '#f00',
        fontSize: that.torem(28)
        // step: 20
    },
    distance: that.offetY
},
y轴的一些设置
yAxis: [{
    min: 0,
    // 最小刻度值
    max: 100,
    // 最大刻度值
    minorTickInterval: 'auto',
    // 表盘中比较短的刻度值
    minorTickWidth: that.torem(2),
    // 表盘中比较短的刻度值的宽度
    minorTickLength: that.torem(20),
    // 表盘中比较短的刻度值的长度
    minorTickPosition: 'inside',
    // 表盘中比较短的刻度值在内部还是在外部显示
    minorTickColor: '#00bfd3',
    // 表盘中比较短的刻度值的颜色
    tickPixelInterval: 'auto',
    // 表盘中比较长的刻度值
    tickWidth: that.torem(4),
    // 表盘中比较长的刻度值的宽度
    tickPosition: 'inside',
    // 表盘中比较长的刻度值在内部还是在外部显示
    tickLength: that.torem(26),
    // 表盘中比较长的刻度值的长度
    tickColor: '#48c7ff',
    // 表盘中比较长的刻度值的颜色
    tickInterval: 10,
    // 间隔
    lineColor: 'transparent',
    // 表盘最外层的连接线
    labels: {
        style: { // 刻度值数字的颜色
            color: '#48c7ff',
            fontSize: that.torem(28)
            // step: 20
        },
        distance: that.offetY
    },
    pane: 0,
    // 第一个面板,第二个面板是1
    title: { // 描述文字
        text: this.text1,
        verticalAlign: 'bottom',
        style: {
            color: '#fff',
            fontSize: that.torem(28)
        },
        y: that.torem(220) // 离y轴的距离
    }
}, {
    min: 0,
    max: 100,
    minorTickInterval: 'auto',
    minorTickWidth: that.torem(2),
    minorTickLength: that.torem(20),
    minorTickPosition: 'inside',
    minorTickColor: '#00bfd3',
    tickPixelInterval: 30,
    tickWidth: that.torem(4),
    tickPosition: 'inside',
    tickLength: that.torem(26),
    tickColor: '#48c7ff',
    tickInterval: 10,
    // 间隔
    tickmarkPlacement: 'on',
    lineColor: 'transparent',
    labels: {
        style: {
            color: '#48c7ff',
            fontSize: that.torem(28)
        },
        distance: that.offetY
    },
    pane: 1,
    title: {
        text: this.text2,
        verticalAlign: 'bottom',
        style: {
            color: '#fff',
            fontSize: that.torem(28)
        },
        y: that.torem(220)
    }
}],
指针以及表盘内百分比的显示的设置
plotOptions: {
    gauge: {
        dataLabels: {
            borderWidth: 0,
            enabled: true,
            color: '#48c7ff',
            fontSize: that.torem(80),
            format: ` <span> {y} % </span>`
        },
        dial: {
            radius: '80%', // 半径:指针长度
            backgroundColor: '#1b4b77',
            //指针背景色
            borderColor: 'black',
            borderWidth: that.torem(1),
            baseWidth: that.torem(10),
            topWidth: that.torem(1),
            baseLength: '90%',
            // of radius
            rearLength: '15%' //尾巴长度
        },
        borderWidth: 0
    }
},
指针中的百分比值,也就是y轴的初始刻度值
series: [{// 第一个表盘对应的数据
    data: [80],
    yAxis: 0
}, {// 第二个表盘对应的数据
    data: [70],
    yAxis: 1
}]
完整的代码
<template>
  <div class="highcharts-container" ref="chart_gauge"></div>
</template>

<script>
import Highcharts from 'highcharts/highstock';
import HighchartsMore from 'highcharts/highcharts-more';
import HighchartsDrilldown from 'highcharts/modules/drilldown';
import Highcharts3D from 'highcharts/highcharts-3d';
HighchartsMore(Highcharts);
HighchartsDrilldown(Highcharts);
Highcharts3D(Highcharts);
import { font } from '@/mixins';

export default {
    props: ['name', 'title'],
    name: 'highcharts',
    mixins: [font],
    data() {
        return {
            chart1: null,
            data_terminal: [
                {
                    name: '华为',
                    y: 21.9
                },
                {
                    name: '苹果',
                    y: 14.9
                },
                {
                    name: '三星',
                    y: 15.2
                },
                {
                    name: '小米',
                    y: 25.7
                },
                {
                    name: '其他',
                    y: 35.7
                }
            ],
            data_flow: [
                {
                    name: '热点1',
                    y: 21.9
                },
                {
                    name: '热点2',
                    y: 14.9
                },
                {
                    name: '热点3',
                    y: 15.2
                },
                {
                    name: '热点4',
                    y: 25.7
                },
                {
                    name: '其他',
                    y: 35.7
                }
            ],
            options: null,
            chartTitle: '',
            text1: null,
            text2: null,
            standSize: document.body.clientWidth,
            offetY: 0
        };
    },
    watch: {
        standSize: {
            handler(newVal, oldVal) {
                if (newVal == 4000) {
                    this.offetY = this.torem(-70);
                } else {
                    this.offetY = this.torem(-60);
                }
            },
            deep: true,
            immediate: true
        }
    },
    mounted() {
        var that = this;
        that.$el.style.height = that.$refs.chart_gauge.offsetHeight - that.torem(100) + 'px';
        console.log(this.$refs.chart_gauge.offsetHeight, 'qq');
        switch (that.title) {
            case 'cpu':
                that.text1 = 'AP平均cpu利用率';
                that.text2 = 'AC平均cpu利用率';
                break;
            case '内存':
                that.text1 = 'AP平均内存利用率';
                that.text2 = 'AC平均内存利用率';
                break;
        }
        this.options = {
            chart: {
                type: 'gauge',
                backgroundColor: 'transparent'
                // height: that.torem(500)
            },
            title: {
                text: null
            },
            labels: {
                items: [
                    {
                        style: { left: that.torem(180), top: that.torem(280), fontSize: that.torem(42), fontWeight: 'bold', fontFamily: '微软雅黑' }
                        // html: '<span style="color:#C02316">{y}</span>'
                    }
                ]
            },
            pane: [
                // 表盘1设置
                {
                    startAngle: -100, // 表盘开始的角度
                    endAngle: 100, // 表盘结束的角度
                    background: null, // 表盘的背景颜色,为null的话就是不要背景颜色
                    center: ['25%', '65%'], // 表盘的位置
                    size: '80%' // 表盘的大小
                },
                // 表盘2设置
                {
                    startAngle: -100,
                    endAngle: 100,
                    background: null,
                    center: ['75%', '65%'],
                    size: '80%'
                }
            ],
            yAxis: [
                {
                    min: 0, // 最小刻度值
                    max: 100, // 最大刻度值
                    minorTickInterval: 'auto', // 表盘中比较短的刻度值
                    minorTickWidth: that.torem(2), // 表盘中比较短的刻度值的宽度
                    minorTickLength: that.torem(20),// 表盘中比较短的刻度值的长度
                    minorTickPosition: 'inside',// 表盘中比较短的刻度值在内部还是在外部显示
                    minorTickColor: '#00bfd3',// 表盘中比较短的刻度值的颜色
                    tickPixelInterval: 'auto', // 表盘中比较长的刻度值
                    tickWidth: that.torem(4),// 表盘中比较长的刻度值的宽度
                    tickPosition: 'inside',// 表盘中比较长的刻度值在内部还是在外部显示
                    tickLength: that.torem(26),// 表盘中比较长的刻度值的长度
                    tickColor: '#48c7ff',// 表盘中比较长的刻度值的颜色
                    tickInterval: 10, // 间隔
                    lineColor: 'transparent',// 表盘最外层的连接线
                    labels: {
                        style: {// 刻度值数字的颜色
                            color: '#48c7ff',
                            fontSize: that.torem(28)
                            // step: 20
                        },
                        distance: that.offetY
                    },
                    pane: 0, // 第一个面板,第二个面板是1
                    title: { // 描述文字
                        text: this.text1,
                        verticalAlign: 'bottom',
                        style: {
                            color: '#fff',
                            fontSize: that.torem(28)
                        },
                        y: that.torem(220) // 离y轴的距离
                    }
                },
                {
                    min: 0,
                    max: 100,
                    minorTickInterval: 'auto',
                    minorTickWidth: that.torem(2),
                    minorTickLength: that.torem(20),
                    minorTickPosition: 'inside',
                    minorTickColor: '#00bfd3',
                    tickPixelInterval: 30,
                    tickWidth: that.torem(4),
                    tickPosition: 'inside',
                    tickLength: that.torem(26),
                    tickColor: '#48c7ff',
                    tickInterval: 10, // 间隔
                    tickmarkPlacement: 'on',
                    lineColor: 'transparent',
                    labels: {
                        style: {
                            color: '#48c7ff',
                            fontSize: that.torem(28)
                        },
                        distance: that.offetY
                    },
                    pane: 1,
                    title: {
                        text: this.text2,
                        verticalAlign: 'bottom',
                        style: {
                            color: '#fff',
                            fontSize: that.torem(28)
                        },
                        y: that.torem(220)
                    }
                }
            ],
            plotOptions: {
                gauge: {
                    dataLabels: {
                        borderWidth: 0,
                        enabled: true,
                        color: '#48c7ff',
                        fontSize: that.torem(80),
                        format: `<span>{y}%</span>`
                    },
                    dial: {
                        radius: '80%', // 半径:指针长度
                        backgroundColor: '#1b4b77', //指针背景色
                        borderColor: 'black',
                        borderWidth: that.torem(1),
                        baseWidth: that.torem(10),
                        topWidth: that.torem(1),
                        baseLength: '90%', // of radius
                        rearLength: '15%' //尾巴长度
                    },
                    borderWidth: 0
                }
            },
            series: [
                {
                    data: [80],
                    yAxis: 0
                },
                {
                    data: [70],
                    yAxis: 1
                }
            ]
        };
        this.initChart();
    },
    methods: {
        initChart(options) {
            this.chart1 = new Highcharts.Chart(this.$refs.chart_gauge, this.options);
            var title_AP_cpu = {
                text: 'AP平均cpu利用率'
            };
            var title_AC_cpu = {
                text: 'AC平均cpu利用率'
            };
            var title_AP_RAM = {
                text: 'AP平均内存利用率'
            };
            var title_AC_RAM = {
                text: 'AC平均内存利用率'
            };
        }
    }
};
</script>

<style lang="scss">
// .highcharts-container {
// width: 100%;
// height: calc(100% - 30px);
// display: flex;
// & > div {
//     flex: 1;
// }
.highcharts-credits {
    display: none !important;
}
.highcharts-text-outline {
    // 去掉dataLabels的outline
    display: none;
}
.redColor {
    color: #ff6748;
}
.blueColor {
    color: #48c7ff;
}
.greenColor {
    color: #13c792;
}
// }
</style>

 浙公网安备 33010602011771号