clickhouse 集群测试
1. 问题描述
自建clickhouse集群,遇到几个问题:
建表不同步
插入数据不同步
查询数据不一致
其实均与配置有关,其中数据不一致问题,纠结比较久,这里总结分享一下。
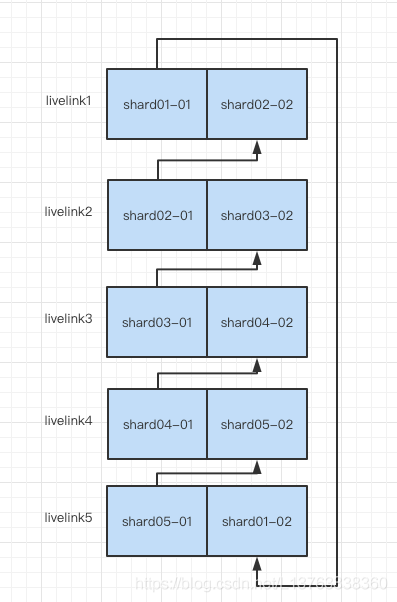
2. 集群设计
clickhouse集群配置:5节点,每个节点2个实例,总共5个分片,每个分片2副本。
整理表格如下
| 节点 | 实例 | 实例2 |
| livelink1 |
livelink1:9000 分片01-副本01 |
livelink1:9002 分片02-副本02 |
| livelink2 |
livelink2:9000 分片02-副本01 |
livelink2:9002 分片03-副本02 |
| livelink3 |
livelink3:9000 分片03-副本01 |
livelink3:9002 分片04-副本02 |
| livelink4 |
livelink4:9000 分片04-副本01 |
livelink4:9002 分片05-副本02 |
| livelink5 |
livelink5:9000 分片05-副本01 |
livelink1:9002 分片01-副本02 |
架构图
3. 实例配置
3.1 config-node1.xml
以livelink1节点的实例1的config-node1.xml为例,标注红色部分是需要根据节点实例进行修改或者需要特别注意的
<?xml version="1.0"?>
<yandex>
    <logger>
        <level>trace</level>
        <log>/var/log/clickhouse-server/clickhouse-server-node1.log</log>
        <errorlog>/var/log/clickhouse-server/clickhouse-server-node1.err.log</errorlog>
        <size>1000M</size>
        <count>10</count>
    </logger>

    <!-- 根据具体节点和实例进行修改 -->
    <http_port>8081</http_port>
    <listen_host>::</listen_host>
    <tcp_port>9000</tcp_port>
    <mysql_port>9004</mysql_port>
    <postgresql_port>9005</postgresql_port>
    <interserver_http_port>9009</interserver_http_port>
    <interserver_http_host>livelink1</interserver_http_host>
    <path>/data/clickhouse/node1/</path>
    <tmp_path>/data/clickhouse/node1/tmp/</tmp_path>
    <format_schema_path>/data/clickhouse/node1/format_schemas/</format_schema_path>
    <user_files_path>/data/clickhouse/node1/user_files/</user_files_path>
    <user_directories>
        <users_xml>
            <path>users-node1.xml</path>
        </users_xml>
        <local_directory>
            <path>/data/clickhouse/node1/access/</path>
        </local_directory>
    </user_directories>

    <!-- clickhouse_remote_servers、 zookeeper-servers、macros命名要与metrika-node1.xml中一致-->
    <include_from>/etc/clickhouse-server/metrika-node1.xml</include_from>
    <remote_servers incl="clickhouse_remote_servers" />
    <zookeeper incl="zookeeper-servers" optional="true" />
    <macros incl="macros" optional="true" />

    <max_connections>4096</max_connections>
    <keep_alive_timeout>3</keep_alive_timeout>
    <max_concurrent_queries>100</max_concurrent_queries>
    <max_server_memory_usage>0</max_server_memory_usage>
    <max_thread_pool_size>10000</max_thread_pool_size>
    <max_server_memory_usage_to_ram_ratio>0.9</max_server_memory_usage_to_ram_ratio>
    <total_memory_profiler_step>4194304</total_memory_profiler_step>
    <total_memory_tracker_sample_probability>0</total_memory_tracker_sample_probability>
    <uncompressed_cache_size>8589934592</uncompressed_cache_size>
    <mark_cache_size>5368709120</mark_cache_size>
    <mmap_cache_size>1000</mmap_cache_size>
    <compiled_expression_cache_size>1073741824</compiled_expression_cache_size>

    <default_profile>default</default_profile>
    <custom_settings_prefixes></custom_settings_prefixes>
    <default_database>default</default_database>

    <mlock_executable>true</mlock_executable>

    <!-- Reallocate memory for machine code ("text") using huge pages. Highly experimental. -->
    <remap_executable>false</remap_executable>

    <builtin_dictionaries_reload_interval>3600</builtin_dictionaries_reload_interval>
    <max_session_timeout>3600</max_session_timeout>
    <default_session_timeout>60</default_session_timeout>

    <query_log>
        <database>system</database>
        <table>query_log</table>
        <partition_by>toYYYYMM(event_date)</partition_by>
        <flush_interval_milliseconds>7500</flush_interval_milliseconds>
    </query_log>

    <trace_log>
        <database>system</database>
        <table>trace_log</table>
        <partition_by>toYYYYMM(event_date)</partition_by>
        <flush_interval_milliseconds>7500</flush_interval_milliseconds>
    </trace_log>

    <query_thread_log>
        <database>system</database>
        <table>query_thread_log</table>
        <partition_by>toYYYYMM(event_date)</partition_by>
        <flush_interval_milliseconds>7500</flush_interval_milliseconds>
    </query_thread_log>

    <metric_log>
        <database>system</database>
        <table>metric_log</table>
        <flush_interval_milliseconds>7500</flush_interval_milliseconds>
        <collect_interval_milliseconds>1000</collect_interval_milliseconds>
    </metric_log>

    <asynchronous_metric_log>
        <database>system</database>
        <table>asynchronous_metric_log</table>
        <flush_interval_milliseconds>60000</flush_interval_milliseconds>
    </asynchronous_metric_log>

    <!--
        OpenTelemetry log contains OpenTelemetry trace spans.
    -->
    <opentelemetry_span_log>
        <engine>
            engine MergeTree
            partition by toYYYYMM(finish_date)
            order by (finish_date, finish_time_us, trace_id)
        </engine>
        <database>system</database>
        <table>opentelemetry_span_log</table>
        <flush_interval_milliseconds>7500</flush_interval_milliseconds>
    </opentelemetry_span_log>


    <crash_log>
        <database>system</database>
        <table>crash_log</table>

        <partition_by />
        <flush_interval_milliseconds>1000</flush_interval_milliseconds>
    </crash_log>


    <top_level_domains_lists></top_level_domains_lists>
    <dictionaries_config>*_dictionary.xml</dictionaries_config>
    <distributed_ddl>
        <path>/clickhouse/task_queue/ddl</path>
    </distributed_ddl>

    <graphite_rollup_example>
        <pattern>
            <regexp>click_cost</regexp>
            <function>any</function>
            <retention>
                <age>0</age>
                <precision>3600</precision>
            </retention>
            <retention>
                <age>86400</age>
                <precision>60</precision>
            </retention>
        </pattern>
        <default>
            <function>max</function>
            <retention>
                <age>0</age>
                <precision>60</precision>
            </retention>
            <retention>
                <age>3600</age>
                <precision>300</precision>
            </retention>
            <retention>
                <age>86400</age>
                <precision>3600</precision>
            </retention>
        </default>
    </graphite_rollup_example>


    <query_masking_rules>
        <rule>
            <name>hide encrypt/decrypt arguments</name>
            <regexp>((?:aes_)?(?:encrypt|decrypt)(?:_mysql)?)\s*\s∗(?:′(?:′|.)+′|.∗?)\s∗\s∗(?:′(?:′|.)+′|.∗?)\s∗</regexp>
            <replace>\1(???)</replace>
        </rule>
    </query_masking_rules>

    <send_crash_reports>
        <enabled>false</enabled>
        <anonymize>false</anonymize>
        <endpoint>https://6f33034cfe684dd7a3ab9875e57b1c8d@o388870.ingest.sentry.io/5226277</endpoint>
    </send_crash_reports>
    <http_server_default_response><![CDATA[<html ng-app="SMI2"><head><base href="http://ui.tabix.io/"></head><body><div ui-view="" class="content-ui"></div><script src="http://loader.tabix.io/master.js"></script></body></html>]]></http_server_default_response>
</yandex>
3.2 user-node1.xml
<?xml version="1.0"?>
<yandex>
    <profiles>
        <default>
            <max_memory_usage>10000000000</max_memory_usage>
            <load_balancing>random</load_balancing>
        </default>
        <readonly>
            <readonly>1</readonly>
        </readonly>
    </profiles>

    <users>
        <!-- 配置两个账户,一个可读写,一个只读 -->
        <livelink_rw>
            <password>xxx</password>
            <networks>
                <ip>::/0</ip>
            </networks>
            <profile>default</profile>
            <quota>default</quota>
        </livelink_rw>
        <livelink_r>
            <password>xxx</password>
            <networks>
                <ip>::/0</ip>
            </networks>
            <profile>readonly</profile>
            <quota>default</quota>
        </livelink_r>
    </users>

    <!-- Quotas. -->
    <quotas>
        <!-- Name of quota. -->
        <default>
            <!-- Limits for time interval. You could specify many intervals with different limits. -->
            <interval>
                <!-- Length of interval. -->
                <duration>3600</duration>

                <!-- No limits. Just calculate resource usage for time interval. -->
                <queries>0</queries>
                <errors>0</errors>
                <result_rows>0</result_rows>
                <read_rows>0</read_rows>
                <execution_time>0</execution_time>
            </interval>
        </default>
    </quotas>
</yandex>
3.3 metrika-node1.xml
<?xml version="1.0"?>
<yandex>

    <!--server相关配置-->
    <clickhouse_remote_servers>
        <livelink_cluster>
            <shard>
                <weight>1</weight>
                <internal_replication>true</internal_replication>
                <replica>
                    <host>livelink1</host>
                    <port>9000</port>
                    <user>livelink_rw</user>
                    <password>livelink123</password>
                </replica>
                <replica>
                    <host>livelink5</host>
                    <port>9002</port>
                    <user>livelink_rw</user>
                    <password>livelink123</password>
                </replica>
            </shard>
            <shard>
                <weight>1</weight>
                <internal_replication>true</internal_replication>
                <replica>
                    <host>livelink1</host>
                    <port>9002</port>
                    <user>livelink_rw</user>
                    <password>livelink123</password>
                </replica>
                <replica>
                    <host>livelink2</host>
                    <port>9000</port>
                    <user>livelink_rw</user>
                    <password>livelink123</password>
                </replica>
            </shard>
            <shard>
                <weight>1</weight>
                <internal_replication>true</internal_replication>
                <replica>
                    <host>livelink2</host>
                    <port>9002</port>
                    <user>livelink_rw</user>
                    <password>livelink123</password>
                </replica>
                <replica>
                    <host>livelink3</host>
                    <port>9000</port>
                    <user>livelink_rw</user>
                    <password>livelink123</password>
                </replica>
            </shard>
            <shard>
                <weight>1</weight>
                <internal_replication>true</internal_replication>
                <replica>
                    <host>livelink3</host>
                    <port>9002</port>
                    <user>livelink_rw</user>
                    <password>livelink123</password>
                </replica>
                <replica>
                    <host>livelink4</host>
                    <port>9000</port>
                    <user>livelink_rw</user>
                    <password>livelink123</password>
                </replica>
            </shard>
            <shard>
                <weight>1</weight>
                <internal_replication>true</internal_replication>
                <replica>
                    <host>livelink4</host>
                    <port>9002</port>
                    <user>livelink_rw</user>
                    <password>livelink123</password>
                </replica>
                <replica>
                    <host>livelink5</host>
                    <port>9000</port>
                    <user>livelink_rw</user>
                    <password>livelink123</password>
                </replica>
            </shard>
        </livelink_cluster>
    </clickhouse_remote_servers>

    <!--zookeeper相关配置-->
    <zookeeper-servers>
        <node index="1">
            <host>livelink1</host>
            <port>2181</port>
        </node>
        <node index="2">
            <host>livelink2</host>
            <port>2181</port>
        </node>
        <node index="3">
            <host>livelink3</host>
            <port>2181</port>
        </node>
        <node index="4">
            <host>livelink4</host>
            <port>2181</port>
        </node>
        <node index="5">
            <host>livelink5</host>
            <port>2181</port>
        </node>
    </zookeeper-servers>

    <macros>
        <layer>01</layer>
        <shard>01</shard>
        <replica>01-01-01</replica>
    </macros>

    <networks>
        <ip>::/0</ip>
    </networks>

    <clickhouse_compression>
        <case>
            <min_part_size>10000000000</min_part_size>
            <min_part_size_ratio>0.01</min_part_size_ratio>
            <method>lz4</method>
        </case>
    </clickhouse_compression>
</yandex>
metrika-node1.xml中的clickhouse_remote_servers、zookeeper-servers、macros必须在config-node1.xml配置且命名一致,很重要!否则定义的macros不可用、表或者数据不能同步。
 <include_from>/etc/clickhouse-server/metrika-node1.xml</include_from>
    <remote_servers incl="clickhouse_remote_servers" />
    <zookeeper incl="zookeeper-servers" optional="true" />
    <macros incl="macros" optional="true" />
每个实例的metrika配置文件,macros需要单独配置。刚开始以为macros只是宏定义,用于建表指定zookkeeper的时候,其实macros配置准确很重要,否则会影响分布式表查询不一致!!
命名规则可以自定义,但所有实例要一致!上面规则是:layer-shard-replical,下面是每个实例的macros
实例:livelink1:9000
<macros>
    <layer>01</layer>
    <shard>01</shard>
    <replica>01-01-01</replica>
</macros>
- 实例:livelink1:9002
<macros>
    <layer>01</layer>
    <shard>02</shard>
    <replica>01-02-02</replica>
</macros>
- 实例:livelink2:9000
<macros>
    <layer>01</layer>
    <shard>02</shard>
    <replica>01-02-01</replica>
</macros>
- 实例:livelink2:9002
<macros> <layer>01</layer> <shard>03</shard> <replica>01-03-02</replica> </macros> - 实例:livelink3:9000
<macros>
    <layer>01</layer>
    <shard>01</shard>
    <replica>01-03-01</replica>
</macros>
- 实例:livelink3:9002
<macros>
    <layer>01</layer>
    <shard>04</shard>
    <replica>01-04-02</replica>
</macros>
- 实例:livelink4:9000
<macros>
    <layer>01</layer>
    <shard>04</shard>
    <replica>01-04-01</replica>
</macros>
- 实例:livelink4:9002
<macros>
    <layer>01</layer>
    <shard>05</shard>
    <replica>01-05-02</replica>
</macros>
- 实例:livelink5:9000
<macros>
    <layer>01</layer>
    <shard>05</shard>
    <replica>01-05-01</replica>
</macros>
- 实例:livelink5:90002
<macros>
    <layer>01</layer>
    <shard>01</shard>
    <replica>01-01-02</replica>
</macros>
4. 验证数据
4.1 创建复制表
只需要在其中一个实际上执行,每个实例会创建本地表
建表的时候,字段类型需要注意大小写,比如Int32不能写成int32,String不能写成string或者STRING,不然会报错
CREATE TABLE test.test_local on cluster livelink_cluster (
    CounterID UInt32,
    StartDate Date,
    Sign Int8,
    IsNew UInt8,
    VisitID UInt64,
    UserID UInt64,
    StartTime DateTime
) ENGINE = ReplicatedMergeTree('/clickhouse/tables/{shard}/test.test_local', '{replica}')
PARTITION BY toYYYYMM(StartDate)
ORDER BY (CounterID, StartDate, intHash32(UserID), VisitID)
SAMPLE BY intHash32(UserID)
SETTINGS index_granularity = 8192
4.2 创建分布式表
create table test.test_all on cluster livelink_cluster as test.test_local
ENGINE = Distributed(livelink_cluster,test,test_local,rand())
4.3 插入数据
livelink2:9000实例本地复制表插入数据
insert into test_local values(1, '2021-07-01 00:11:22', 1, 1, 1, 11, toDateTime('2021-07-08 00:11:22'));
4.4 查询数据
按上面的架构图,在livelink2:9000和livelink1:9000实例本地复制表分配对应两个副本,都可以查到数据,其他实例本地表查询不到,但每个实例都可以通过分布式表查询得到
livelink1 :) select * from test.test_local;

SELECT *
FROM test.test_local

Query id: 1478d7ff-3885-45bc-b0bf-1c3111e51dcb

┌─CounterID─┬──StartDate─┬─Sign─┬─IsNew─┬─VisitID─┬─UserID─┬───────────StartTime─┐
│         1 │ 2021-07-01 │    1 │     1 │       1 │     11 │ 2021-07-08 00:11:22 │
└───────────┴────────────┴──────┴───────┴─────────┴────────┴─────────────────────┘

1 rows in set. Elapsed: 0.002 sec.

livelink1 :) select * from test.test_all;

SELECT *
FROM test.test_all

Query id: baf6b70d-2eaf-492a-b295-5ee9b6b226c3

┌─CounterID─┬──StartDate─┬─Sign─┬─IsNew─┬─VisitID─┬─UserID─┬───────────StartTime─┐
│         1 │ 2021-07-01 │    1 │     1 │       1 │     11 │ 2021-07-08 00:11:22 │
└───────────┴────────────┴──────┴───────┴─────────┴────────┴─────────────────────┘

1 rows in set. Elapsed: 0.005 sec.
查询分布式表的时候要多查几次,看是否每次查询数据准确、一致。本人就踩过坑,由于10个实例上都macros设置,其中xxx:9002实例上的设置错了,插入一条数据,分布式表每次查询的结果往往不一致,慎重!
5. 回顾总结
总的来说,自建clickhouse集群,可能会遇到下面几个问题,重点检查一下配置
建表不同步——检查macros、click_remote_server、zooker-server配置
插入数据不同步——检查macros、click_remote_server配置
查询数据不一致——检查macros配置

 浙公网安备 33010602011771号