ggpubr
data
> head(expr)
  bcr_patient_barcode dataset GATA3 PTEN  XBP1  ESR1  MUC1
1               BRCA1    BRCA  2.87 1.36  2.98  3.08  1.65
2               BRCA2    BRCA  2.17 0.43  2.55  2.39  3.08
3               BRCA3    BRCA  1.32 1.31  3.02  0.79  2.98
4               BRCA4    BRCA  1.84 0.81  3.13  2.50 -1.92
5               BRCA5    BRCA -6.03 0.25 -1.45 -4.86 -1.17
6               BRCA6    BRCA  1.80 1.31  4.04  2.80  3.53
基本格式
library(ggpubr)
# GATA3
ggboxplot(expr, ## data
          x = "dataset",
          y = "GATA3",
          title = "GATA3", ## title
          ylab = "Expression", ## ylab
          color = "dataset", ## 配色分组
          palette = "jco") ## 调色板,包括“grep”,brewer palattes,custom color palattes,ggsci
y = c("GATA3", "PTEN", "XBP1") # Create a list of plots
# Create a list of plots
p <- ggboxplot(expr, x = "dataset",
y = c("GATA3", "PTEN", "XBP1"),
title = c("GATA3", "PTEN", "XBP1"),
ylab = "Expression",
color = "dataset", palette = "jco")
# View GATA3
p$GATA3
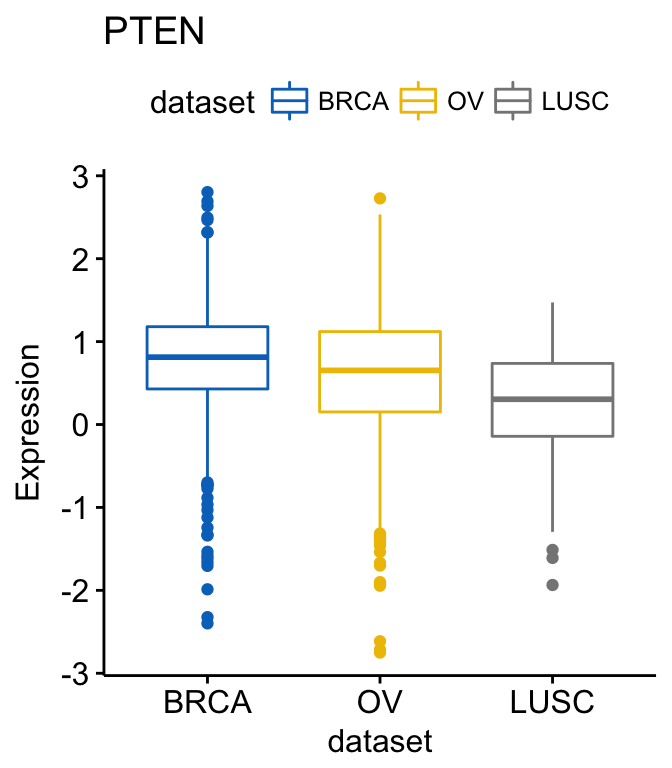
# View PTEN
p$PTEN
# View XBP1
p$XBP1
Add P-values anf Significance Levels
> list(c("BRCA", "OV"), c("OV", "LUSC"))
[[1]]
[1] "BRCA" "OV"

[[2]]
[1] "OV"   "LUSC"

my_comparisons <- list(c("BRCA", "OV"), c("OV", "LUSC"))
p + stat_compare_means(comparisons = my_comparisons)

> combn(names(table(expr$dataset)),2,simplify = F)
[[1]]
[1] "BRCA" "LUSC"

[[2]]
[1] "BRCA" "OV"

[[3]]
[1] "LUSC" "OV"

> samples <- c("GATA3", "PTEN", "XBP1")
> combn(samples,2,simplify = F)
[[1]]
[1] "GATA3" "PTEN"

[[2]]
[1] "GATA3" "XBP1"

[[3]]
[1] "PTEN" "XBP1"


> combn(samples,2,simplify = T)
     [,1]    [,2]    [,3]
[1,] "GATA3" "GATA3" "PTEN"
[2,] "PTEN"  "XBP1"  "XBP1"
For each of the genes, you can compare the different groups as follow:
> compare_means(c(GATA3, PTEN, XBP1) ~ dataset, data = expr)
# A tibble: 9 x 8
  .y.   group1 group2         p     p.adj p.format p.signif method
  <fct> <chr>  <chr>      <dbl>     <dbl> <chr>    <chr>    <chr>
1 GATA3 BRCA   OV     1.17e-177 3.50e-177 < 2e-16  ****     Wilcoxon
2 GATA3 BRCA   LUSC   6.80e- 73 1.40e- 72 < 2e-16  ****     Wilcoxon
3 GATA3 OV     LUSC   2.98e-  8 3.00e-  8 3.0e-08  ****     Wilcoxon
4 PTEN  BRCA   OV     7.01e-  5 7.00e-  5 7.0e-05  ****     Wilcoxon
5 PTEN  BRCA   LUSC   1.08e- 16 3.20e- 16 < 2e-16  ****     Wilcoxon
6 PTEN  OV     LUSC   1.25e-  7 2.50e-  7 1.2e-07  ****     Wilcoxon
7 XBP1  BRCA   OV     2.49e-123 7.50e-123 < 2e-16  ****     Wilcoxon
8 XBP1  BRCA   LUSC   1.92e- 42 3.80e- 42 < 2e-16  ****     Wilcoxon
9 XBP1  OV     LUSC   4.49e- 11 4.50e- 11 4.5e-11  ****     Wilcoxon
select or remove items (here cancer types)
item 指的是数据框的一行,这里对应x axis
select = c("BRCA", "OV")
remove = "BRCA"
指定items order
order = c("LUSC", "OV", "BRCA")
horizontal plots
rotate = TRUE

 浙公网安备 33010602011771号