

Centos7安装Promethus
安装Prometheus(普罗米修斯)监控:
实验环境准备:
服务器                    IP地址
Prometheus服务器          192.168.1.22
被监控服务器              192.168.1.20
grafana服务器             192.168.1.21
要求: 静态IP能够上外网:
主机名:
各自配置好主机名:
# hostnamectl set-hostname --static server.cluster.com
三台都相互绑定IP与主机名
#vim /etc/hosts
192.168.1.22 master
192.168.1.20 node1
192.168.1.21 node2

或者:
echo "192.168.1.22 master
192.168.1.20 node1
192.168.1.21 node2" >> /etc/hosts
时间同步(时间同步一定确认一下
yum install -y ntpdate && ntpdate time.windows.com
关闭防火墙 selinux
#systemctl stop firewalld
#systemctl disabled firewalld
#iptabled -F
1、安装Prometheus
从https://prometheus.io/download/下载相应版本,安装到服务器上 官网提供的是二进制版,解压就能用,不需要编译
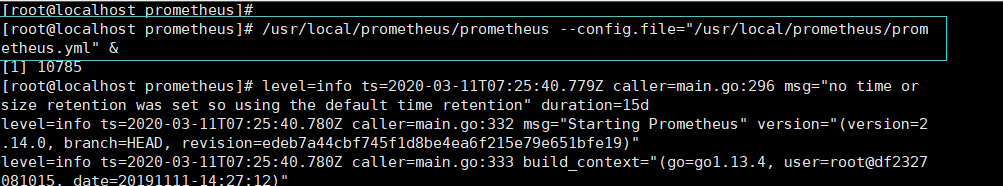
#下载链接:
wget -c https://github.com/prometheus/prometheus/releases/download/v2.16.0/prometheus-2.16.0.linux-amd64.tar.gz
#解压:
tar xf prometheus-2.16.0.linux-amd64.tar.gz
mv prometheus-2.16.0.linux-amd64 /usr/local/prometheus
#直接配置默认配置文件启动:
/usr/local/prometheus/prometheus --config.file="/usr/local/prometheus/prometheus.yml" &
#确认端口(9090)
ss -anltp |grep 9090

2、Prometheus界面:
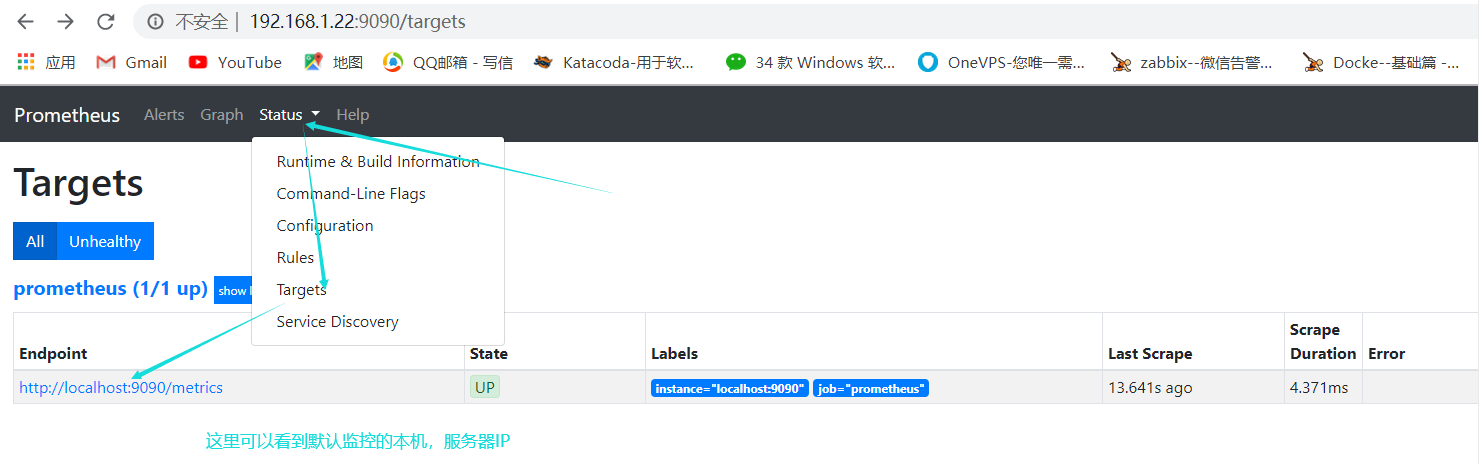
通过浏览器访问http://服务器IP:9090就可以访问到prometheus的主界面了

默认值监控了本机一台,点Status>Targets>可以看到只监控了本机
3、主机数据展示:
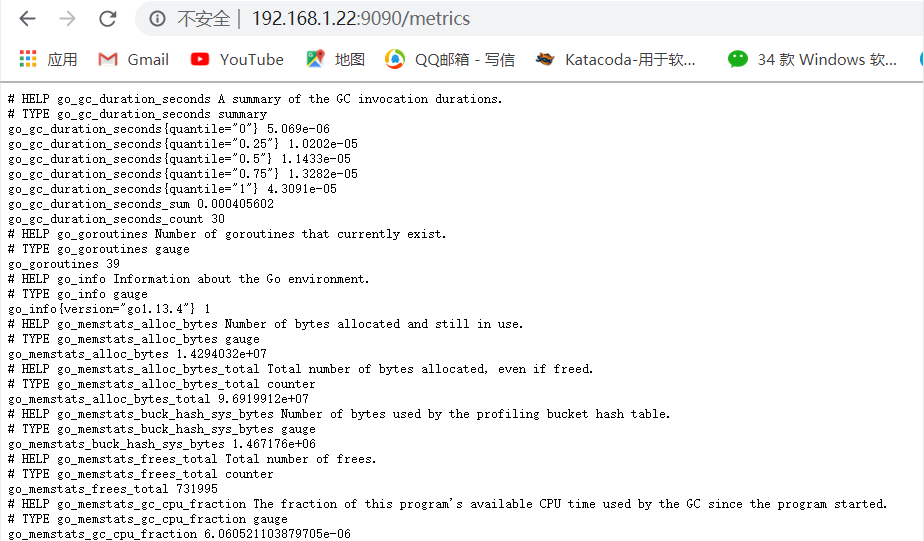
通过http://服务器IP:9090/metrics可以看到监控的数据
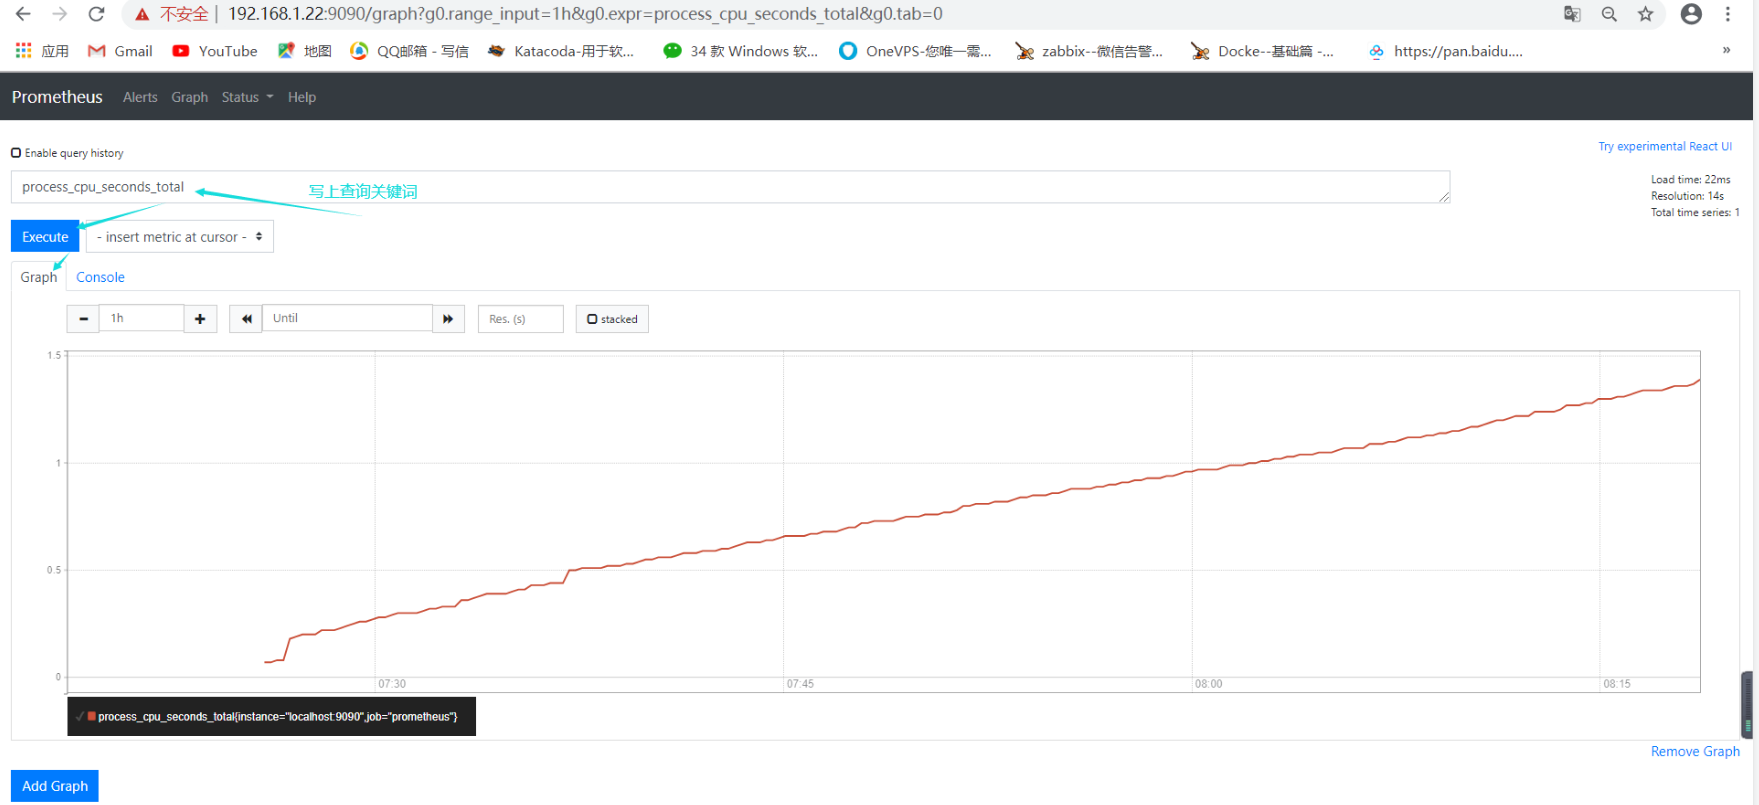
在web主界面可以通过关键词查询监控项
4、监控远程Linux主机:
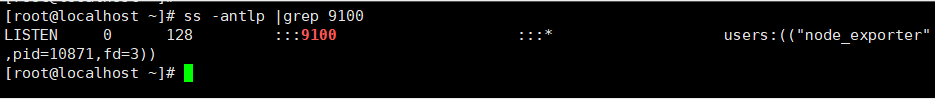
需在远程Linux主机(被监控端agent1)上安装node_exporter组件
#下载链接:
wget https://github.com/prometheus/node_exporter/releases/download/v0.18.1/node_exporter-0.18.1.linux-amd64.tar.gz
#解压:
tar xf node_exporter-0.18.1.linux-amd64.tar.gz -C /usr/local/
mv /usr/local/node_exporter-0.18.1.linux-amd64/ /usr/local/node_exporter
#里面就一个启动命令node_exporter,可以直接使用此命令启动:
nohup /usr/local/node_exporter/node_exporter &


#确认端口(9100)
ss -anltp|grep 9100

温馨提示:
nodup命令:如果把启动node_exproter的终端给关闭,那么进程也会随之关闭。nokup命令也会帮你解决这个问题。
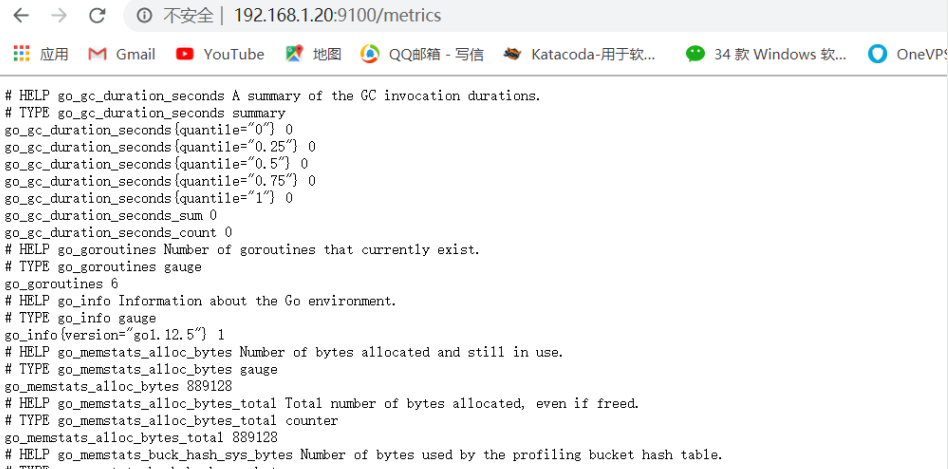
通过浏览器访问http://被监控端IP:9100/metrics就可以查看到node_exporter在被监控端收集的监控信息:
回到prometheus服务器的配置文件里添加被监控集群的配置段 主配置文件最后加上下面三行:vim /usr/local/prometheus/prometheus.yml
 - jod_name: 'node1'                      #取一个jod名称来代表被监控的机器
      static_configs:
      - targets: ['192.168.1.20:9100']       #这里改成被监控机器的IP,后面端口接9100

#改完配置文件后,重启服务(直接pkill):
pkill prometheus

#确认端口没有进程占用:
ss -anltp | grep 9090
#重启启动prometheus:
/usr/local/prometheus/prometheus --config.file="/usr/local/prometheus/prometheus.yml" &
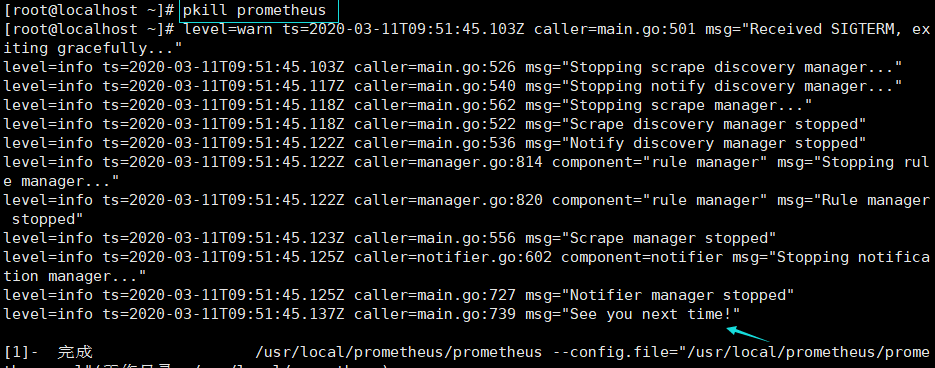
#再次确认端口被占用, 说明重启成功:
ss -anltp | grep 9090

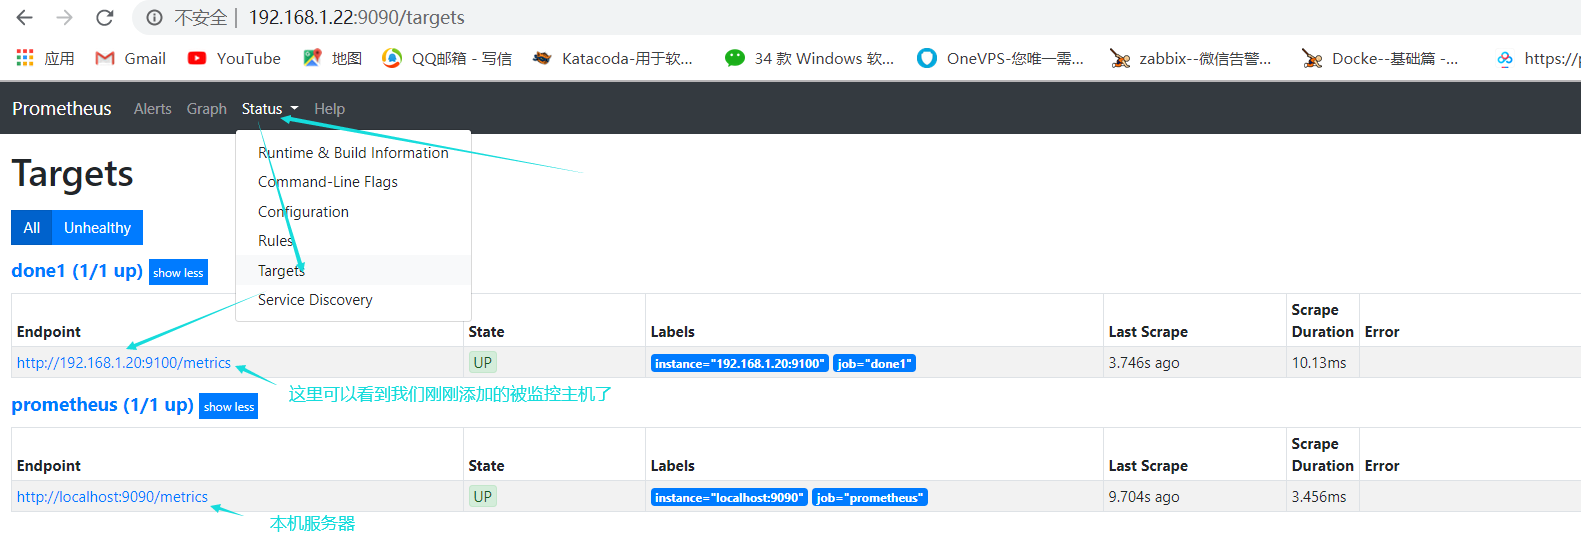
回到web管理界面-->点 Status>Targets>可以看到多了一台监控目标:


 浙公网安备 33010602011771号