
centos 7 ELK 监控NGINX LOG
实验环境:(安装好ELK,安装步骤见上篇:注意关闭防火墙、selinux)
192.168.72.10
安装ES: 9200,logstash:9600
192.168.72.11
安装kibana:5601
登录在10上
创建好的nginx_access文件
[root@localhost ~]# vim nginx
NGINXACCESS %{IPORHOST:client_ip} (%{USER:ident}|- ) (%{USER:auth}|-) \[%{HTTPDATE:timestamp}\] "(?:%{WORD:verb} (%{NOTSPACE:request}|-)(?: HTTP/%{NUMBER:http_version})?|-)" %{NUMBER:status} (?:%{NUMBER:bytes}|-) "(?:%{URI:referrer}|-)" "%{GREEDYDATA:agent}"
上传到下面路径:
[root@localhost patterns]# pwd
/usr/share/logstash/vendor/bundle/jruby/2.3.0/gems/logstash-patterns-core-4.1.2/patterns
安装nginx
[root@localhost ~]# yum -y install epel-release
[root@localhost ~]# yum -y install nginx
[root@localhost ~]# systemctl start nginx
[root@localhost ~]# netstat -anpt | grep nginx
修改配置文件创建索引
[root@localhost ~]# cd /etc/logstash/conf.d/
[root@localhost conf.d]# vim nginx.conf
--------------------------------------
input {
file {
path => "/var/log/nginx/access.log"
type => "nginx-log"
start_position => "beginning"
}
}
filter {
grok {
match => {"message" => "%{NGINXACCESS}"}
}
}
output {
elasticsearch {
hosts => "192.168.33.10:9200"
index => "nginx_log-%{+YYYY.MM.dd}"
}
}
---------------------------------------------
[root@localhost conf.d]# vim /etc/logstash/pipelines.yml
-----------------添加两行---------------------
- pipeline.id: nginx
path.config: "/etc/logstash/conf.d/nginx.conf"
---------------------------------------------
[root@localhost ~]# cd /etc/logstash/conf.d/
[root@localhost conf.d]# vim nginx.conf
--------------------------------------
input {
file {
path => "/var/log/nginx/access.log"
type => "nginx-log"
start_position => "beginning"
}
}
filter {
grok {
match => {"message" => "%{NGINXACCESS}"}
}
}
output {
elasticsearch {
hosts => "192.168.33.10:9200"
index => "nginx_log-%{+YYYY.MM.dd}"
}
}
---------------------------------------------
[root@localhost conf.d]# vim /etc/logstash/pipelines.yml
-----------------添加两行---------------------
- pipeline.id: nginx
path.config: "/etc/logstash/conf.d/nginx.conf"
---------------------------------------------
[root@localhost ~]# chmod -R 777 /var/log/
[root@localhost ~]# systemctl restart logstash
123456789101112131415161718192021222324252627282930
查看
[root@localhost ~]# tailf /var/log/logstash/logstash-plain.log
如果web端没出现nginx索引,
[root@localhost ~]# yum -y install httpd-tools
[root@localhost ~]# ab -n 1000 -c 1000 http://192.168.33.10/index.html
web端查看、设置可视化
1 添加状态码统计饼状图
[root@localhost ~]# systemctl restart logstash
123456789101112131415161718192021222324252627282930
查看
[root@localhost ~]# tailf /var/log/logstash/logstash-plain.log
如果web端没出现nginx索引,
[root@localhost ~]# yum -y install httpd-tools
[root@localhost ~]# ab -n 1000 -c 1000 http://192.168.33.10/index.html
web端查看、设置可视化
1 添加状态码统计饼状图

查看ip:192.168.72.11:5601


查看ip:192.168.72.11:5601


添加一个统计pv的图形


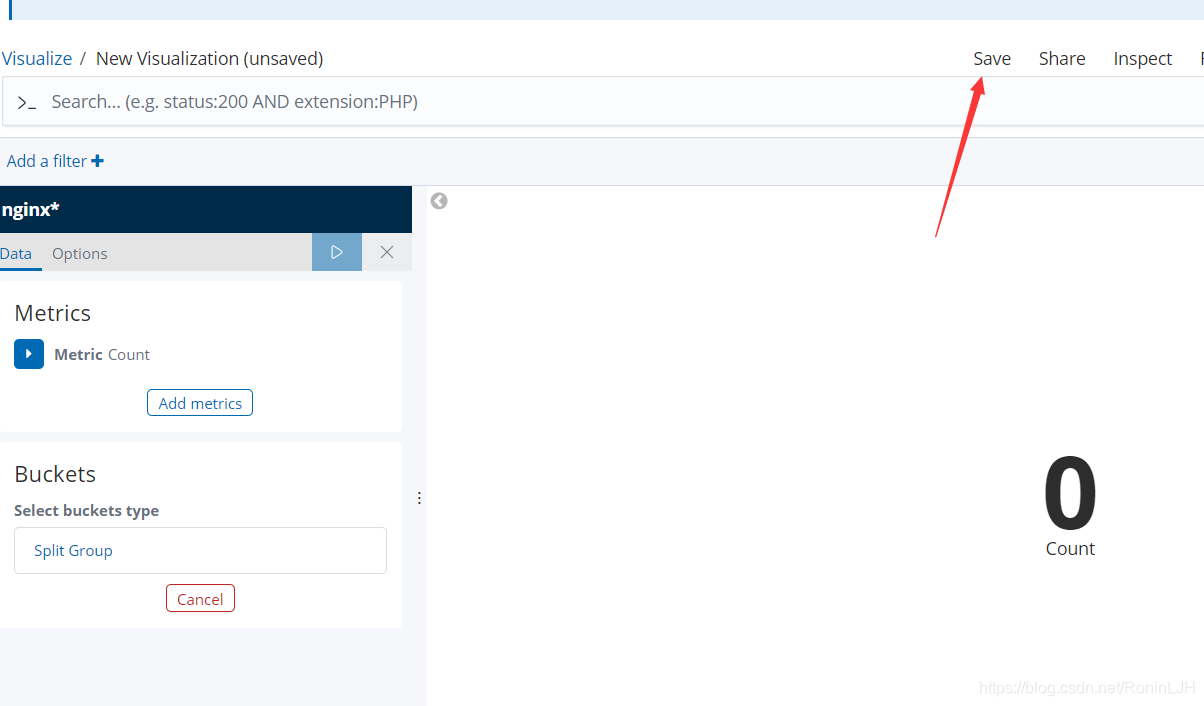

添加ip访问量前10的ip


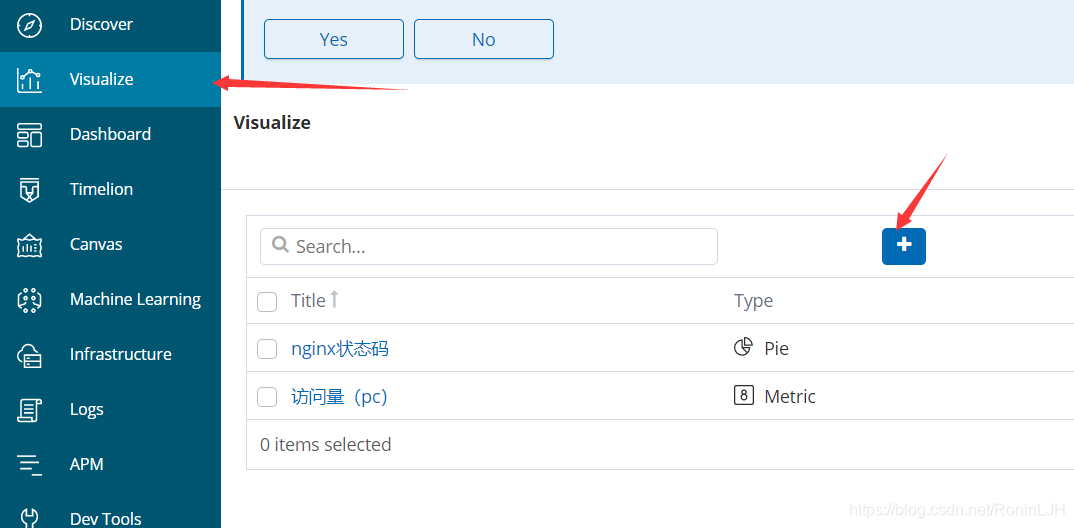

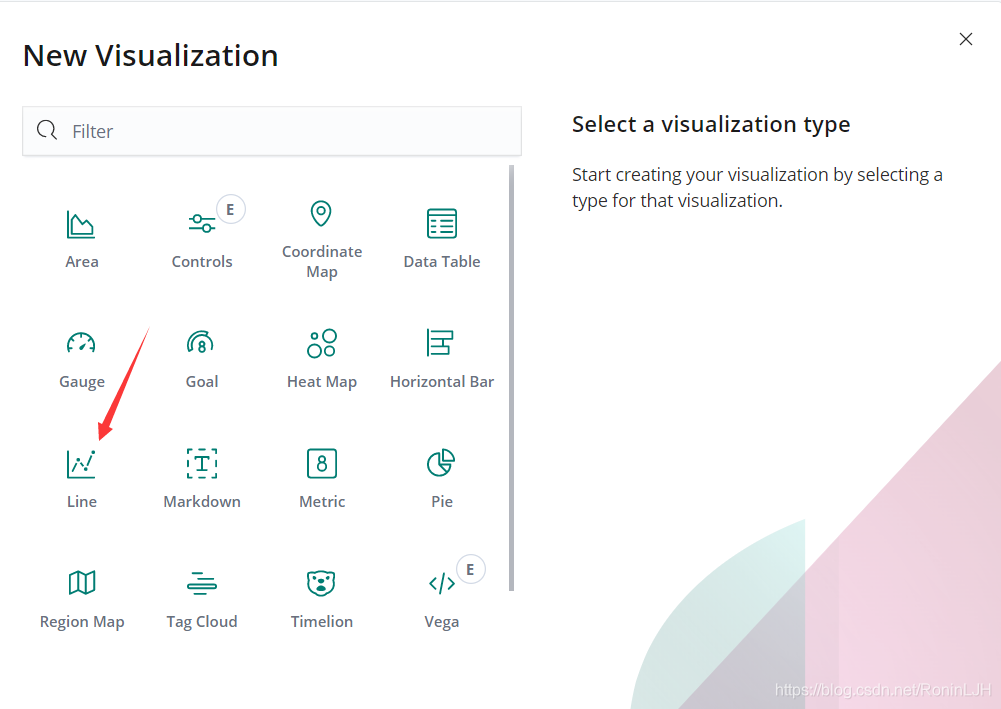
访问量趋势图


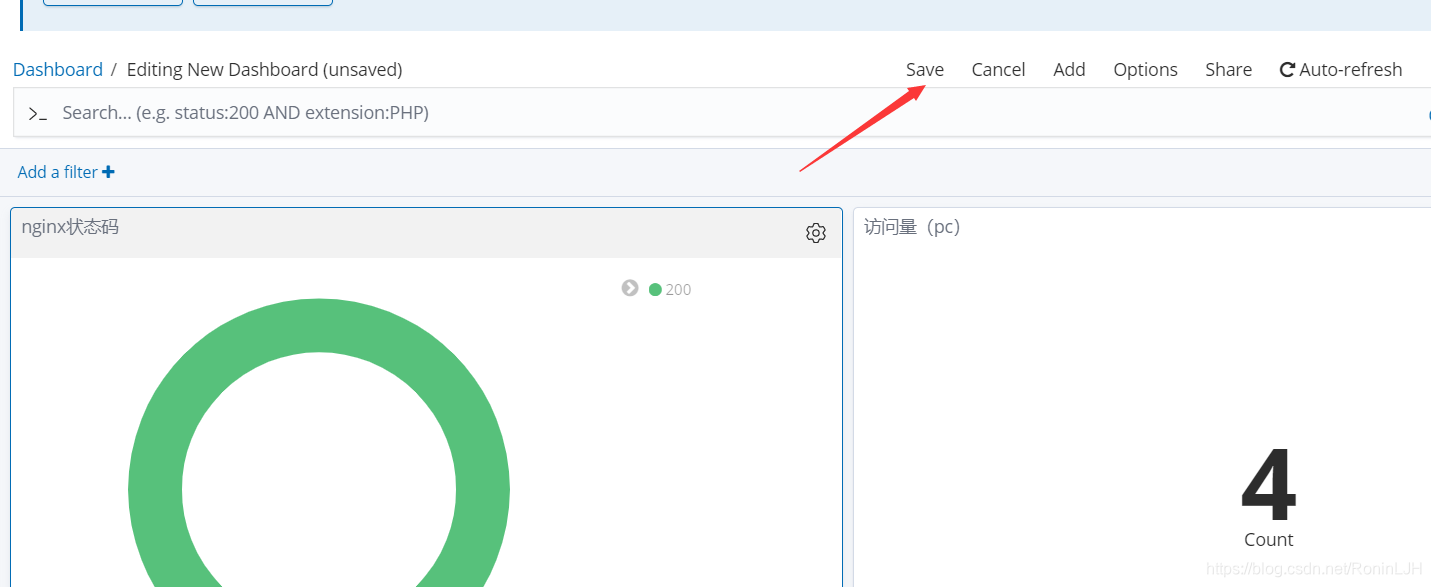
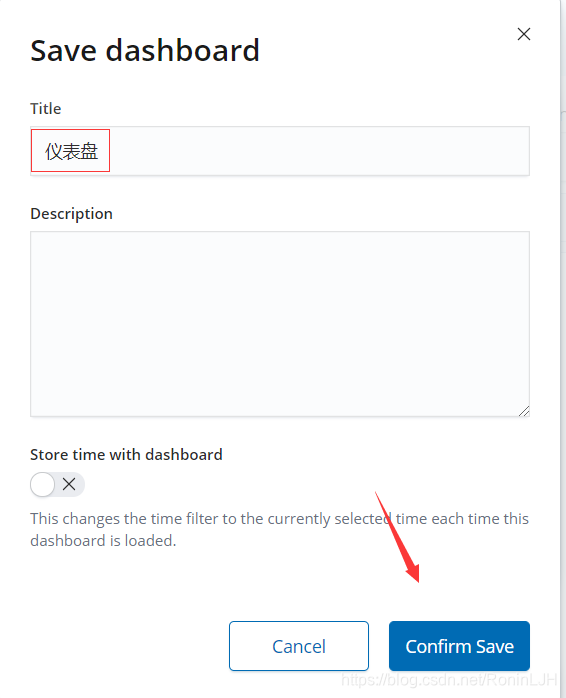
添加一个仪表盘




 浙公网安备 33010602011771号