
使用d3.v5实现条形图
效果图:
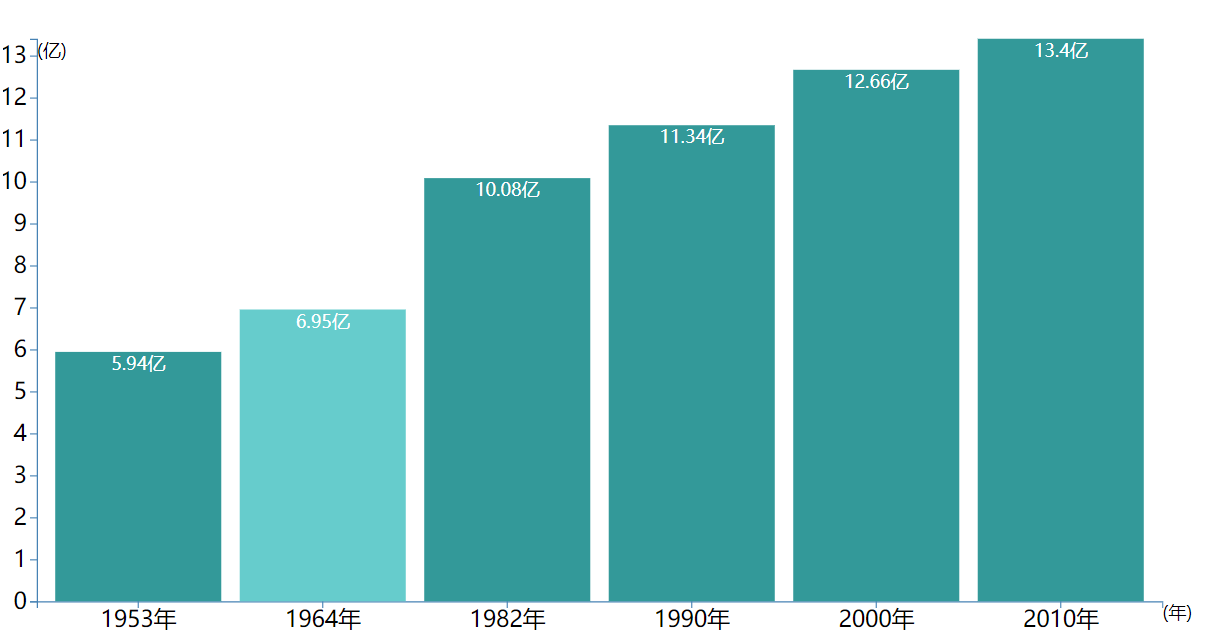
条形图:
目录结构:


<!DOCTYPE html>
<html lang="en">
<head>
    <meta charset="UTF-8">
    <link href="css/style.css" media="screen" rel="stylesheet" type="text/css"/>
    <title>Linechart1</title>
</head>
<body>
    <div id="container"></div>

    <script src="https://d3js.org/d3.v5.min.js"></script>
    <script src="js/index.js"></script>
</body>
</html>
svg rect{
    fill:#339999;
}

svg rect:hover {
    cursor: pointer;
    fill: #66cccc;
}
year,population
1953,5.94
1964,6.95
1982,10.08
1990,11.34
2000,12.66
2010,13.40
/垂直Bar,加刻度

d3.csv("Data/data.csv",function (d) {
    return {
        // year: new Date(+d.year, 0, 1), // convert "Year" column to Date
        year: d.year+"年",
        population: +d.population // convert "population" column to number
    };
}).then(function (data) {
    console.log(data);
    var //data=[1,8,5,6,8,9,3,5,2,20],
        width=1000,
        height=500,
        margin={left:30,top:30,right:30,bottom:30},
        svg_width=width+margin.left+margin.right,
        svg_height=height+margin.top+margin.bottom;

    //离散缩放 population=>[0,width]
    var scale_x=d3.scaleBand()
        .domain(data.map(function (d) {
            return d.year;
        }))
        .range([0,width])
        .padding(0.1);

    //线性缩放
    var scale_y=d3.scaleLinear()
        .domain([0,d3.max(data,function (d) {
            return d.population;
        })])
        .range([height,0])


    var svg=d3.select("#container")
        .append("svg")
        .attr("width",svg_width)
        .attr("height",svg_height)

    var chart=svg.append("g")
        .attr("transform","translate("+margin.left+","+margin.top+")");

    var x_axis_color="steelblue",
        y_axis_color="steelblue";

    var x_axis=chart.append('g')
        .call(d3.axisBottom(scale_x))
        .attr("transform","translate(0,"+height+")");

    x_axis.selectAll("path")
        .attr("stroke",x_axis_color)

    x_axis.selectAll("line")
        .attr("stroke",x_axis_color)

    x_axis.selectAll("text")
        .attr("font-size",'2em')

    var y_axis=chart.append('g')
        .call(d3.axisLeft(scale_y));

    y_axis.selectAll("path")
        .attr("stroke",y_axis_color)

    y_axis.selectAll("line")
        .attr("stroke",y_axis_color)

    y_axis.selectAll("text")
        .attr("font-size",'2em')

    //Y轴注解
    chart.append("text")
        .text("(亿)")
        // .attr("text-anchor","end")
        // .attr("transform","rotate(-90)")
        .attr("dy","1em")
    //X轴注解
    chart.append("text")
        .text("(年)")
        // .attr("text-anchor","end")
        .attr("transform","translate("+width+","+height+")")
        .attr("dy","1em")

    var bar=chart.selectAll(".bar")
        .data(data)
        .enter()
        .append("g")
        .attr("transform",function (d,i) {
            return "translate("+scale_x(d.year)+",0)"
        })


    bar.append("rect")
        .attr("y",function (d) {
            return scale_y(d.population);
        })
        .attr("height",function (d) {
            return height-scale_y(d.population);
        })
        .attr("width",scale_x.bandwidth() )
        .attr("class",".rect")

    bar.append("text")
        .text(function (d) {
            return d.population+"亿";
        })
        .attr("y",function (d) {
            return scale_y(d.population);
        })
        .attr("x",scale_x.bandwidth() /2)
        .attr("dy","1em")
        .style("text-anchor","middle")
        .style("fill","white")

})
参考教程:https://www.imooc.com/learn/103
如果是此文是转载文章,本人会附上转载链接,此篇文章的版权归原创作者所属,如果侵权请与我联系,我会删除此文。
若没有标明转载链接,此篇文章属于本人的原创文章,其版权所属:
作者:feiquan
出处:http://www.cnblogs.com/feiquan/
版权声明:本文版权归作者和博客园共有,欢迎转载,但未经作者同意必须保留此段声明,且在文章页面明显位置给出原文连接,否则保留追究法律责任的权利。
大家写文都不容易,请尊重劳动成果~ 这里谢谢大家啦(*/ω\*)
若没有标明转载链接,此篇文章属于本人的原创文章,其版权所属:
作者:feiquan
出处:http://www.cnblogs.com/feiquan/
版权声明:本文版权归作者和博客园共有,欢迎转载,但未经作者同意必须保留此段声明,且在文章页面明显位置给出原文连接,否则保留追究法律责任的权利。
大家写文都不容易,请尊重劳动成果~ 这里谢谢大家啦(*/ω\*)

 浙公网安备 33010602011771号