pyecharts
这里描述了设置柱状图6大元素、柱状图转置XY轴、堆叠柱状图的方法。
了解清楚了柱状图,其他图形应该就无师自通啦,框架结构都是一样的,参数不同而已,看一下文档就行啦~
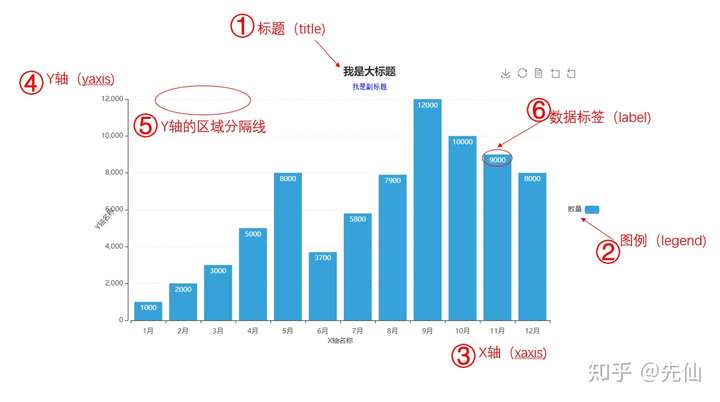
一、设置柱状图6大元素的方式
6大元素为:标题、图例、X轴、Y轴、Y轴区域分隔线、数据标签
首先导入需要的模块
from pyecharts.charts import Bar  ##导入需要使用的图表
from pyecharts import options as opts  ##导入配置项
由于新版参数设置均已经选项配置化,需要配置的选项都放在了配置项(options)里面,因此需要导入options及使用到的图表。
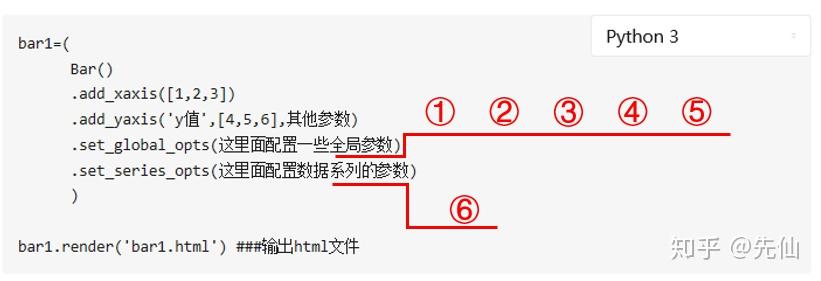
然后,以下是基础代码框架
bar1=(
      Bar() ##定义为柱状图
      .add_xaxis([1,2,3]) ##X轴的值
      .add_yaxis('y值',[4,5,6],其他参数) ##y的值和y的一些数据配置项
      .set_global_opts(这里面配置一些 全局参数)
      .set_series_opts(这里面配一些 系列参数)
      )

bar1.render('bar1.html') ###输出html文件
新版pyecharts可以采用以上的链式调用方式,也可以采用bar1.add_xaxis()分开调用的方式。为了代码清晰并且看上去高大上一点(哈哈~~),建议采用链式调用。
这6大元素参数在代码中,分别进行配置的地方如下:
标题、图例、X轴、Y轴、Y轴区域分隔线为全局参数 ,在set_global_opts后面设置。
数据标签为系列参数,在set_series_opts后面设置。
具体的简单示例为:
1.设置标题
格式为:.set_global_opts(title_opts=opts.TitleOpts(具体参数))
具体参数细则参考TitleOpts的参数详情,以下代码没有配置完所有参数,网址直达:A Python Echarts Plotting Library
bar1=(
       Bar( )
       .add_xaxis(['1月','2月','3月','4月','5月','6月','7月','8月','9月','10月','11月','12月'])
       .add_yaxis('数量'##系列的名称
                  ,[1000,2000,3000,5000,8000,3700,5800,7900,12000,10000,9000,8000] ##系列的数值
                  )
       .set_global_opts(title_opts=opts.TitleOpts(title='我是大标题',
                                                  subtitle='我是副标题'
                                                  ,pos_left='20%'  #标题的位置 距离左边20%距离。
                                                  ,item_gap=10#主副标题之间的距离
                                                  ,title_textstyle_opts=opts.TextStyleOpts(color='red'#
                                                                                           ,font_size=12
                                                                                           ,font_weight='bold'
                                                                                           )  #大标题文字的格式配置,
                                                  ,subtitle_textstyle_opts=opts.TextStyleOpts(color='blue'
                                                                             ,font_style='normal'## 可选:'normal','italic','oblique'
                                                                             ,font_weight='normal'    #粗细 'normal','bold','bolder','lighter'
                                                                             ,font_family= 'monospace'# 还可以是 'serif' , 'monospace', 'Arial', 'Courier New', 'Microsoft YaHei', ...
                                                                             ,font_size=12
                                                                             ,background_color='grey'#文字背景颜色
                                                                             ,border_color='black' #文字块边框颜色
                                                                             )###小标题文字的格式配置

                                                  )
                        )
       )


bar1.render('bar1.html') ###输出html文件
输出的格式为:

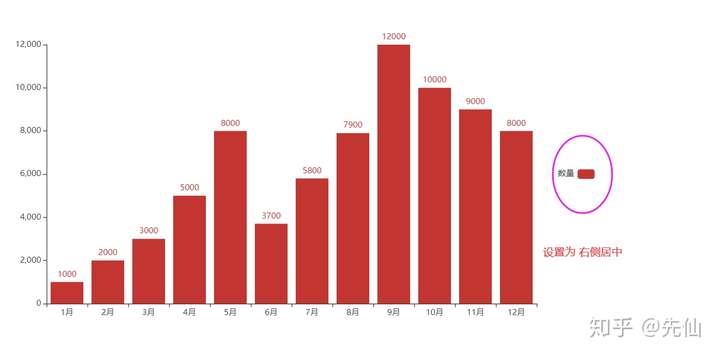
2.设置图例
格式为:.set_global_opts(legend_opts=opts.LegendOpts(具体参数))
具体参数细则参考LegendOpts的参数详情,以下代码没有配置完所有参数,网址直达:A Python Echarts Plotting Library
bar1=(
       Bar( )
       .add_xaxis(['1月','2月','3月','4月','5月','6月','7月','8月','9月','10月','11月','12月'])
       .add_yaxis('数量'##系列的名称
                  ,[1000,2000,3000,5000,8000,3700,5800,7900,12000,10000,9000,8000] ##系列的数值
                  )
       .set_global_opts(legend_opts=opts.LegendOpts(type_=None # 'plain':普通图例。缺省就是普通图例。
                                                               # 'scroll':可滚动翻页的图例。当图例数量较多时可以使用。
                                                    ,pos_left='right' #图例横向的位置,right表示在右侧,也可以为百分比
                                                    ,pos_top='middle'#图例纵向的位置,middle表示中间,也可以为百分比
                                                    ,orient='vertical'#horizontal #图例方式的方式
                                                   )
                        )
       )


bar1.render('bar1.html') ###输出html文件
输出的格式为:
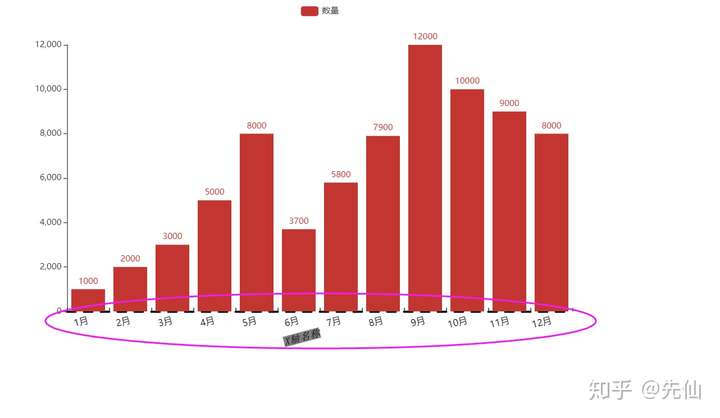
3.X轴设置
格式为:.set_global_opts(xaxis_opts=opts.AxisOpts(具体参数))
具体参数细则参考AxisOpts的参数详情,以下代码没有配置完所有参数,网址直达:
A Python Echarts Plotting Library
bar1=(
       Bar( )
       .add_xaxis(['1月','2月','3月','4月','5月','6月','7月','8月','9月','10月','11月','12月'])
       .add_yaxis('数量'##系列的名称
                  ,[1000,2000,3000,5000,8000,3700,5800,7900,12000,10000,9000,8000] ##系列的数值
                  )
       .set_global_opts(xaxis_opts=opts.AxisOpts(name='X轴名称'
                                     ,name_location='middle' #坐标轴名字所在的位置
                                     ,name_gap=25#坐标轴名字与坐标轴之间的距离
                                     ,name_rotate=15 #坐标轴名字旋转角度
                                     ,offset=5 #坐标轴X的值距离X轴的距离
                                     ,name_textstyle_opts=opts.TextStyleOpts(color='black'
                                                                             ,font_style='italic'## 可选:'normal','italic','oblique'
                                                                             ,font_weight='bolder'    #粗细 'normal','bold','bolder','lighter'
                                                                             ,font_family= 'monospace'# 还可以是 'serif' , 'monospace', 'Arial', 'Courier New', 'Microsoft YaHei', ...
                                                                             ,font_size=14
                                                                             ,background_color='grey'#文字背景颜色
                                                                             ,border_color='black' #文字块边框颜色
                                                                             )##X轴名称的格式配置
                                     ,axistick_opts=opts.AxisTickOpts(is_inside=True #刻度线是否在内侧
                                                                      ) #坐标轴刻度配置项
                                     ,axisline_opts=opts.AxisLineOpts(linestyle_opts=opts.LineStyleOpts(width=3 ##设置宽度
                                                                                                           ,opacity=0 #设置透明度
                                                                                                           ,type_='dashed'  # 'solid', 'dashed', 'dotted'
                                                                                                           ,color='black')
                                                                      )#坐标轴线的配置项
                                     ,axislabel_opts=opts.LabelOpts(font_size=13#字的大小
                                                                    ,rotate=15 #字旋转的角度
                                             )##坐标轴标签的格式配置
                                     )
                        )
       )


bar1.render('bar1.html') ###输出html文件
输出格式为:
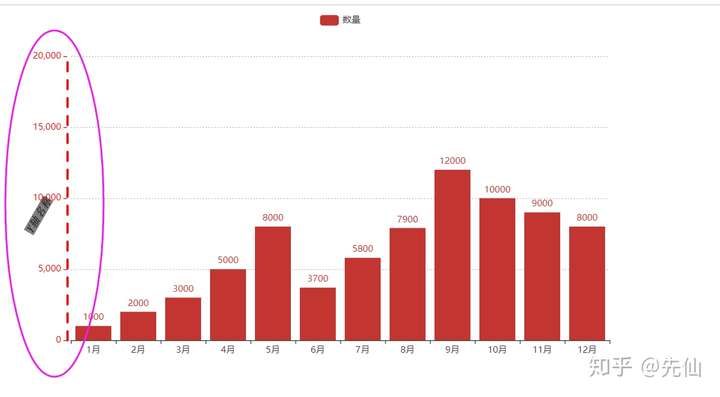
4.Y轴、Y轴分割线的设置
y轴配置和X轴的类似。
格式为:.set_global_opts(yaxis_opts=opts.AxisOpts(具体参数))
bar1=(
       Bar( )
       .add_xaxis(['1月','2月','3月','4月','5月','6月','7月','8月','9月','10月','11月','12月'])
       .add_yaxis('数量'##系列的名称
                  ,[1000,2000,3000,5000,8000,3700,5800,7900,12000,10000,9000,8000] ##系列的数值
                  )
       .set_global_opts(yaxis_opts=opts.AxisOpts(name='Y轴名称'
                                     ,name_location='middle' #坐标轴名字所在的位置
                                     ,name_gap=25#坐标轴名字与坐标轴之间的距离
                                     ,name_rotate=60 #坐标轴名字旋转角度
                                     ,name_textstyle_opts=opts.TextStyleOpts(color='black'
                                                                             ,font_style='italic'## 可选:'normal','italic','oblique'
                                                                             ,font_weight='bolder'    #粗细 'normal','bold','bolder','lighter'
                                                                             ,font_family= 'monospace'# 还可以是 'serif' , 'monospace', 'Arial', 'Courier New', 'Microsoft YaHei', ...
                                                                             ,font_size=14
                                                                             ,background_color='grey'#文字背景颜色
                                                                             ,border_color='black' #文字块边框颜色
                                                                             )
                                     ,offset=5 #y轴相对于默认位置偏移的距离,相同位置有多个y轴时可以用到
                                     ,split_number=5 #坐标轴分割的段数,默认为5,只是预估,不是实际展示的段数
                                     ,min_=0  #最小时候
                                     ,max_=20000 #最大值
                                     ,splitline_opts=opts.SplitLineOpts(is_show=True # 是否展示Y轴分割线
                                                                        ,linestyle_opts=opts.LineStyleOpts(width=1 ##设置宽度
                                                                                                           ,opacity=0.5 #设置透明度
                                                                                                           ,type_='dotted'  # 'solid', 'dashed', 'dotted'
                                                                                                           ,color='grey'   )
                                                                                                  )# y轴分割线显示的相关设置,X轴和y轴都有

                                    , axisline_opts=opts.AxisLineOpts(linestyle_opts=opts.LineStyleOpts(width=3 ##设置宽度
                                                                                                          # ,opacity=0 #设置透明度
                                                                                                           ,type_='dashed'  # 'solid', 'dashed', 'dotted'
                                                                                                           ,color='red'   )
                                                                      )###坐标轴线的配置项
                                    # ,splitarea_opts  ##分割区域配置项
                                     )
       )
)


bar1.render('bar1.html') ###输出html文件
输出格式为:
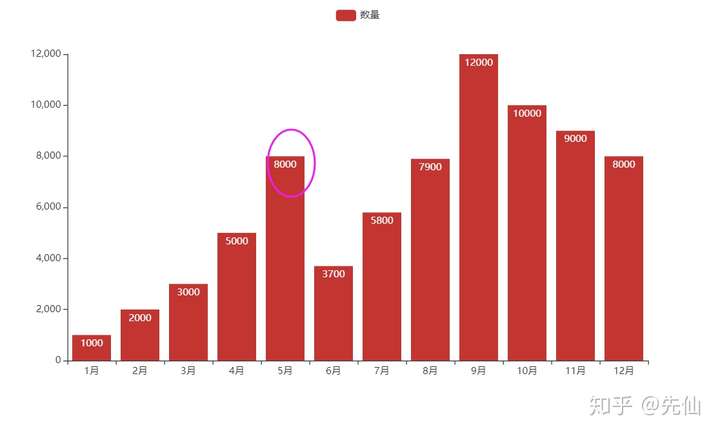
5.数据标签
格式为:.set_series_opts(label_opts=opts.LabelOpts(具体参数))
具体参数细则参考LabelOpts的参数详情,以下代码没有配置完所有参数,网址直达:A Python Echarts Plotting Library
bar1=(
       Bar( )
       .add_xaxis(['1月','2月','3月','4月','5月','6月','7月','8月','9月','10月','11月','12月'])
       .add_yaxis('数量'##系列的名称
                  ,[1000,2000,3000,5000,8000,3700,5800,7900,12000,10000,9000,8000] ##系列的数值
                  )
    .set_series_opts(label_opts=opts.LabelOpts(position='insideTop' #设置数据标签所在的位置 'top','left','right','bottom','inside','insideLeft','insideRight'
                                                            # 'insideTop','insideBottom', 'insideTopLeft','insideBottomLeft'
                                                            # 'insideTopRight','insideBottomRight'
                                              ,color='white'#数据标签的颜色
                                              ,font_size=12
                                              # ,formatter #数据标签显示格式
                                               )##设置数据标签的格式s
                           )
)

bar1.render('bar1.html') ###输出html文件
输出格式为:
opts.LabelOpts()在代码中都有重复出现,这个配置项可以使用来设置标签格式的,包括X轴的标签、Y轴的标签、数据标签。配置逻辑有差异,如下:
x和y轴配置标签的逻辑为:设置全局配置项→设置x轴/y轴的配置项→设置轴标签的配置项→使用opts.LabelOpts()进行配置。
数据标签配置标签的逻辑为:设置系列配置项→设置标签配置项→使用opts.LabelOpts()进行配置
总结:将以上的代码汇总在一起,得到以下的图形:
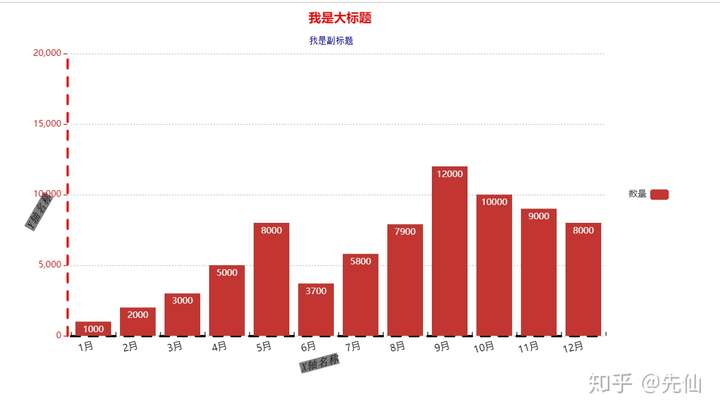
代码奉上:
bar1=(
Bar( )
.add_xaxis(['1月','2月','3月','4月','5月','6月','7月','8月','9月','10月','11月','12月'])
.add_yaxis('数量'##系列的名称
,[1000,2000,3000,5000,8000,3700,5800,7900,12000,10000,9000,8000] ##系列的数值
)
.set_global_opts(title_opts=opts.TitleOpts(title='我是大标题',
subtitle='我是副标题'
,pos_left='45%' #标题的位置 距离左边20%距离。
,item_gap=15#主副标题之间的距离
,title_textstyle_opts=opts.TextStyleOpts(color='red'
,font_size=17
,font_weight='bold'
) #大标题的格式配置,
,subtitle_textstyle_opts=opts.TextStyleOpts(color='blue'
,font_style='normal'## 可选:'normal','italic','oblique'
,font_weight='normal' #粗细 'normal','bold','bolder','lighter'
,font_family= 'monospace'# 还可以是 'serif' , 'monospace', 'Arial', 'Courier New', 'Microsoft YaHei', ...
,font_size=12
,background_color='grey'#文字背景颜色
,border_color='black' #文字块边框颜色
)
)
,legend_opts=opts.LegendOpts(type_=None # 'plain':普通图例。缺省就是普通图例。
# 'scroll':可滚动翻页的图例。当图例数量较多时可以使用。
,pos_left='right' #图例横向的位置
,pos_top='middle'#图例纵向的位置
,orient='vertical'#horizontal #图例方式的方式
)
, xaxis_opts=opts.AxisOpts(name='X轴名称'
,name_location='middle' #坐标轴名字所在的位置
,name_gap=25#坐标轴名字与坐标轴之间的距离
,name_rotate=15 #坐标轴名字旋转角度
,offset=5 #坐标轴X的值距离X轴的距离
,name_textstyle_opts=opts.TextStyleOpts(color='black'
,font_style='italic'## 可选:'normal','italic','oblique'
,font_weight='bolder' #粗细 'normal','bold','bolder','lighter'
,font_family= 'monospace'# 还可以是 'serif' , 'monospace', 'Arial', 'Courier New', 'Microsoft YaHei', ...
,font_size=14
,background_color='grey'#文字背景颜色
,border_color='black' #文字块边框颜色
)
,axistick_opts=opts.AxisTickOpts(is_inside=True #刻度线是否在内侧
) #坐标轴刻度配置项
,axisline_opts=opts.AxisLineOpts(linestyle_opts=opts.LineStyleOpts(width=3 ##设置宽度
#,opacity=0 #设置透明度
,type_='dashed' # 'solid', 'dashed', 'dotted'
,color='black' )
)###坐标轴线的配置项
,axislabel_opts=opts.LabelOpts(font_size=13
,rotate=15
)##坐标轴标签的配置项
)
,yaxis_opts=opts.AxisOpts(name='Y轴名称'
,name_location='middle' #坐标轴名字所在的位置
,name_gap=25#坐标轴名字与坐标轴之间的距离
,name_rotate=60 #坐标轴名字旋转角度
,name_textstyle_opts=opts.TextStyleOpts(color='black'
,font_style='italic'## 可选:'normal','italic','oblique'
,font_weight='bolder' #粗细 'normal','bold','bolder','lighter'
,font_family= 'monospace'# 还可以是 'serif' , 'monospace', 'Arial', 'Courier New', 'Microsoft YaHei', ...
,font_size=14
,background_color='grey'#文字背景颜色
,border_color='black' #文字块边框颜色
)
,offset=5 #y轴相对于默认位置偏移的距离,相同位置有多个y轴时可以用到
,split_number=5 #坐标轴分割的段数,默认为5,只是预估,不是实际展示的段数
,min_=0 #最小时候
,max_=20000 #最大值
,splitline_opts=opts.SplitLineOpts(is_show=True # 是否展示Y轴分割线
,linestyle_opts=opts.LineStyleOpts(width=1 ##设置宽度
,opacity=0.5 #设置透明度
,type_='dotted' # 'solid', 'dashed', 'dotted'
,color='grey' )
)# y轴分割线显示的相关设置,X轴和y轴都有
, axisline_opts=opts.AxisLineOpts(linestyle_opts=opts.LineStyleOpts(width=3 ##设置宽度
# ,opacity=0 #设置透明度
,type_='dashed' # 'solid', 'dashed', 'dotted'
,color='red' )
)###坐标轴线的配置项
# ,splitarea_opts ##分割区域配置项
)
)
.set_series_opts(label_opts=opts.LabelOpts(position='insideTop' #设置数据标签所在的位置 'top','left','right','bottom','inside','insideLeft','insideRight'
# 'insideTop','insideBottom', 'insideTopLeft','insideBottomLeft'
# 'insideTopRight','insideBottomRight'
,color='white'#数据标签的颜色
,font_size=12
# ,formatter #数据标签显示格式
)##设置数据标签的格式s
)
)
bar1.render('bar1.html') ###输出html文件
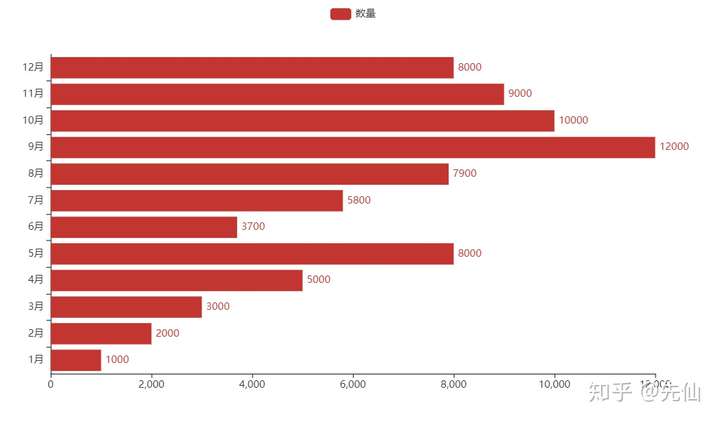
二、转置XY轴
调用方式很简单,为: .reversal_axis()
bar1=(
       Bar( )
       .add_xaxis(['1月','2月','3月','4月','5月','6月','7月','8月','9月','10月','11月','12月'])
       .add_yaxis('数量'##系列的名称
                  ,[1000,2000,3000,5000,8000,3700,5800,7900,12000,10000,9000,8000] ##系列的数值
                  )
       .set_series_opts(label_opts=opts.LabelOpts(position='right' #设置数据标签所在的位置'top','left','right','bottom','inside','insideLeft','insideRight'
                                                            # 'insideTop','insideBottom', 'insideTopLeft','insideBottomLeft'
                                                            # 'insideTopRight','insideBottomRight'
                                                 ,font_size=12
                                              # ,formatter #数据标签显示格式
                                               )##设置数据标签的格式s
                           )
       .reversal_axis()

)

bar1.render('bar1.html') ###输出html文件
输出格式为:
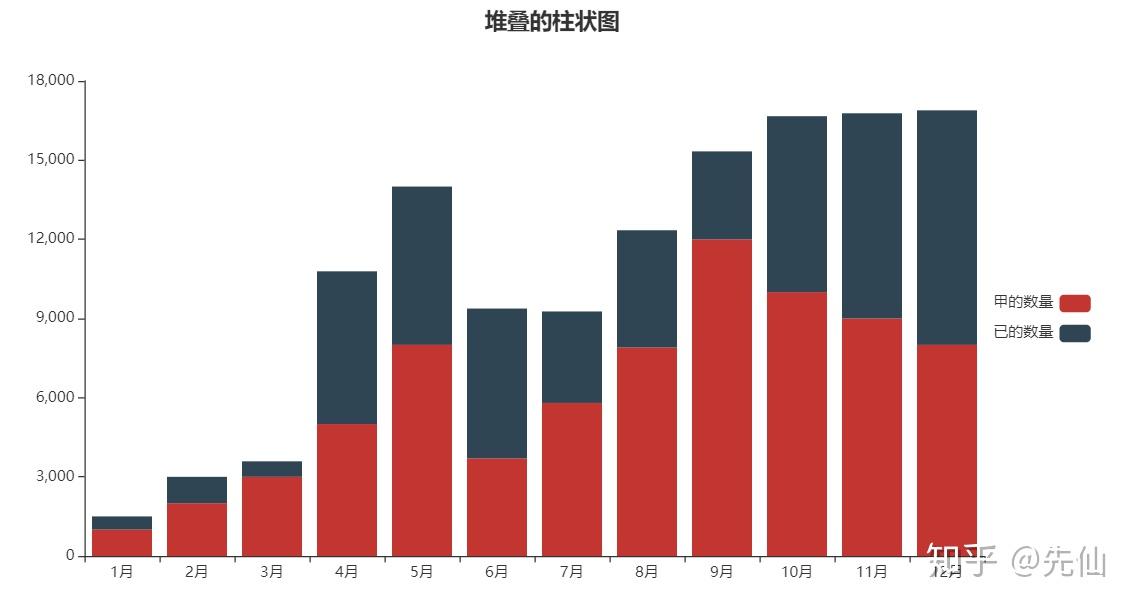
三、堆叠柱状图
格式为:.add_yaxis(具体参数),具体参数中,stack参数设置一个字符串。多个.add_yaxis()时,stack的值为一样的y值就会叠加在一起。
代码示例如下:两个.add_yaxis()的stack值都为“stack1”,所以就堆叠在一起了。
bar1=(
       Bar( )
       .add_xaxis(['1月','2月','3月','4月','5月','6月','7月','8月','9月','10月','11月','12月'])
       .add_yaxis('甲的数量'##系列的名称
                  ,[1000,2000,3000,5000,8000,3700,5800,7900,12000,10000,9000,8000] ##系列的数值
                  ,stack='stack1'
                  )
       .add_yaxis('已的数量'##系列的名称
                  ,[500,1000,588,5788,6000,5677,3467,4444,3333,6666,7777,8888] ##系列的数值
                  ,stack='stack1'
                  )
       .set_global_opts(title_opts=opts.TitleOpts(title='堆叠的柱状图'
                                                  ,pos_left='45%'
                                                  )
                        ,legend_opts=opts.LegendOpts(type_=None # 'plain':普通图例。缺省就是普通图例。
                                                               # 'scroll':可滚动翻页的图例。当图例数量较多时可以使用。
                                                    ,pos_left='right' #图例横向的位置
                                                    ,pos_top='middle'#图例纵向的位置
                                                    ,orient='vertical'#horizontal #图例方式的方式
                                             )
                       )
        .set_series_opts(label_opts=opts.LabelOpts(is_show=False  ##不显示数据标签
                                         ))
)

bar1.render('bar1.html') ###输出html文件
输出格式为:

 浙公网安备 33010602011771号