插件使用-HighChart
一、介绍
让数据可视化更简单,兼容 IE6+、完美支持移动端、图表类型丰富、方便快捷的 HTML5 交互性图表库。
官网(英):https://www.highcharts.com/download
官网(中):https://www.hcharts.cn/
二、使用
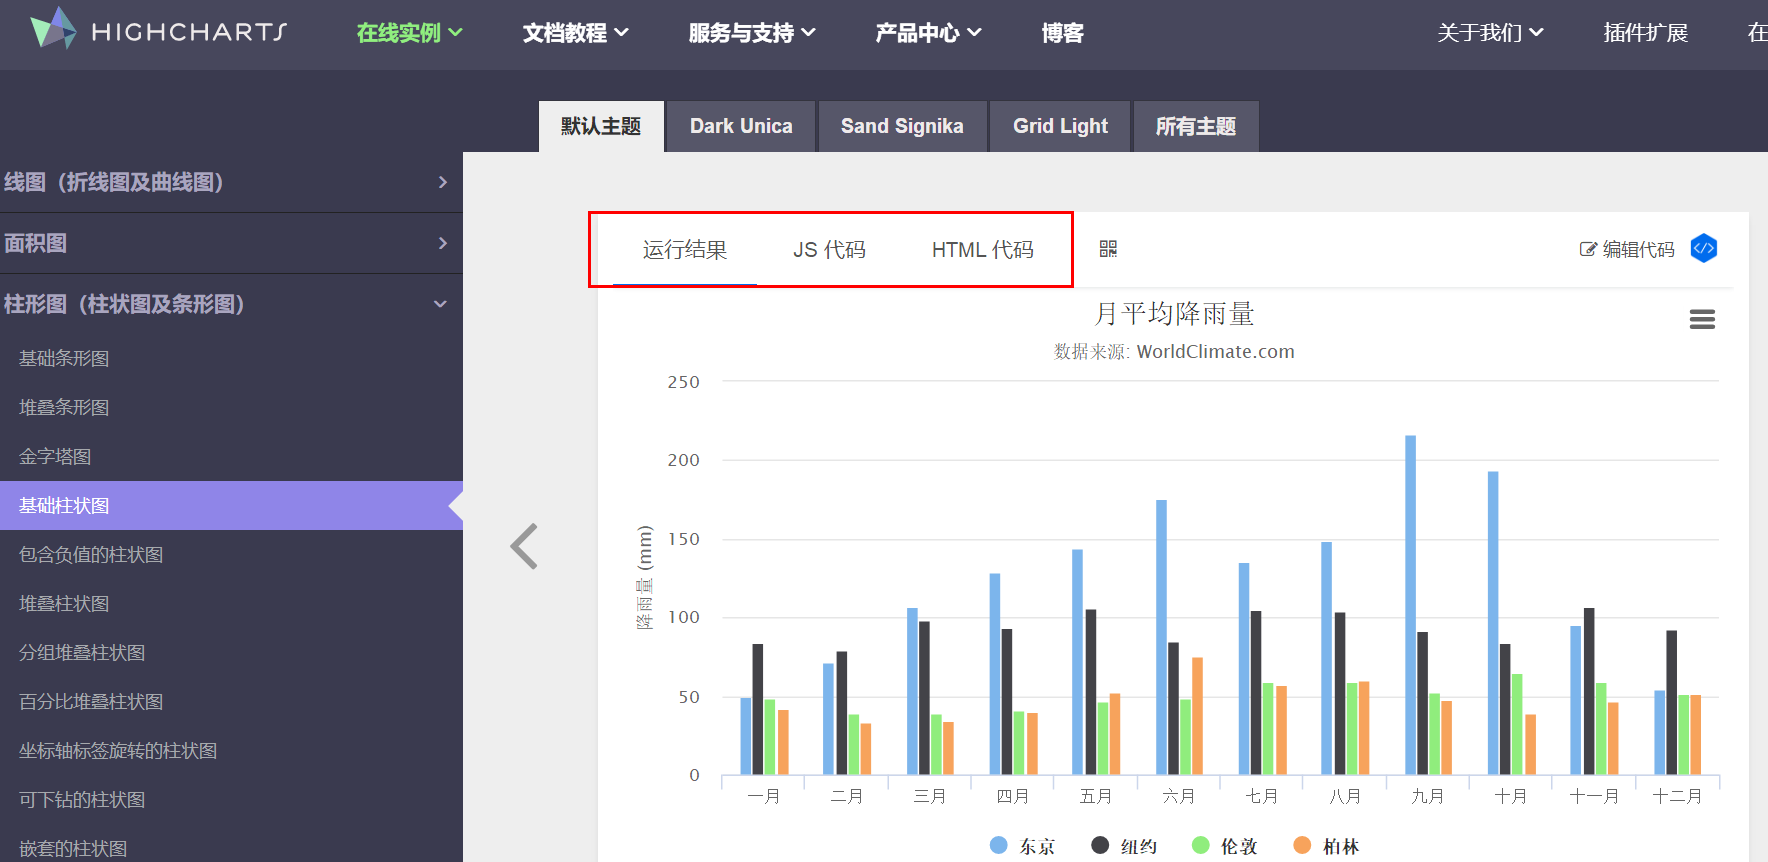
0、官网demo
官网-在线实例-Highcharts演示-选择例子-运行结果/js代码/html代码
1、例1
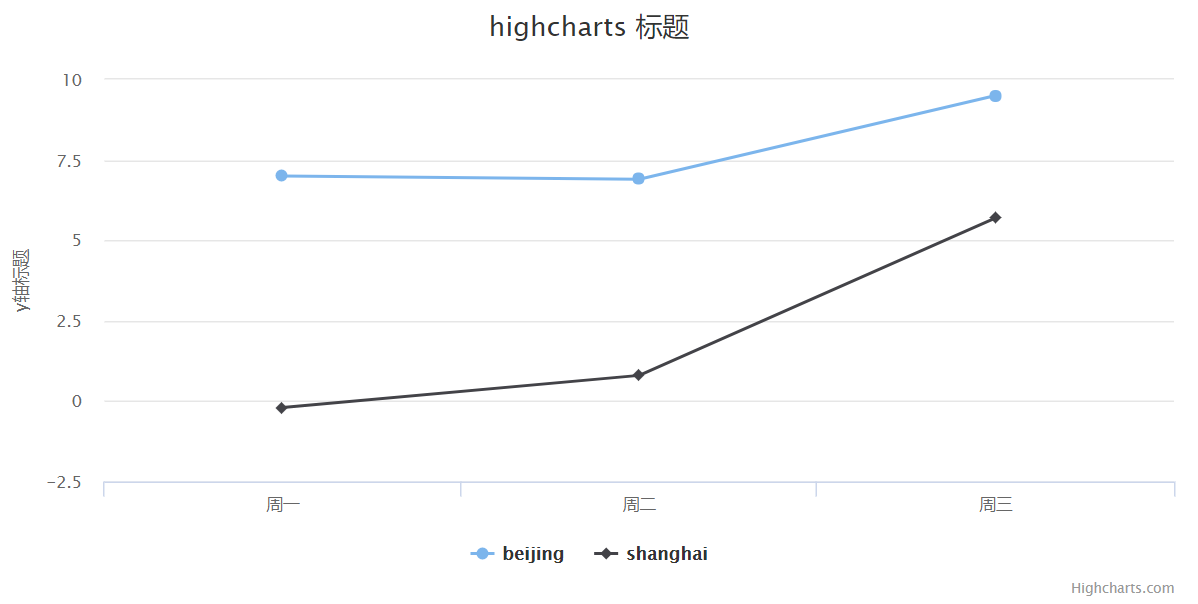


<!DOCTYPE html>
<html lang="en">
<head>
    <meta charset="UTF-8">
    <title>Title</title>
</head>
<body>
    <div id="container" style="width: 800px;height: 400px;margin:0 auto;">

    <script src="/static/Highcharts-6.0.7/code/highcharts.js"></script>
   <script >
        Highcharts.setOptions({
            global: {
                useUTC: false
            }
        });
        var chart = new Highcharts.Chart('container',{
            title:{
                text:"highcharts 标题",
            },
            xAxis:{  // x轴元素
                categories:["周一","周二","周三"]
            },
            yAxis:{  // y轴标题
                title:{
                    text:"y轴标题"
                }
            },
            series:[{
                name:"beijing",  //  图1标题
                data:[7.0,6.9,9.5]  // 数据
            },{
                name:"shanghai",  // 图2标题
                data:[-0.2,0.8,5.7]  // 数据
            }]
        });

    </script>
</body>
</html>
2、例2
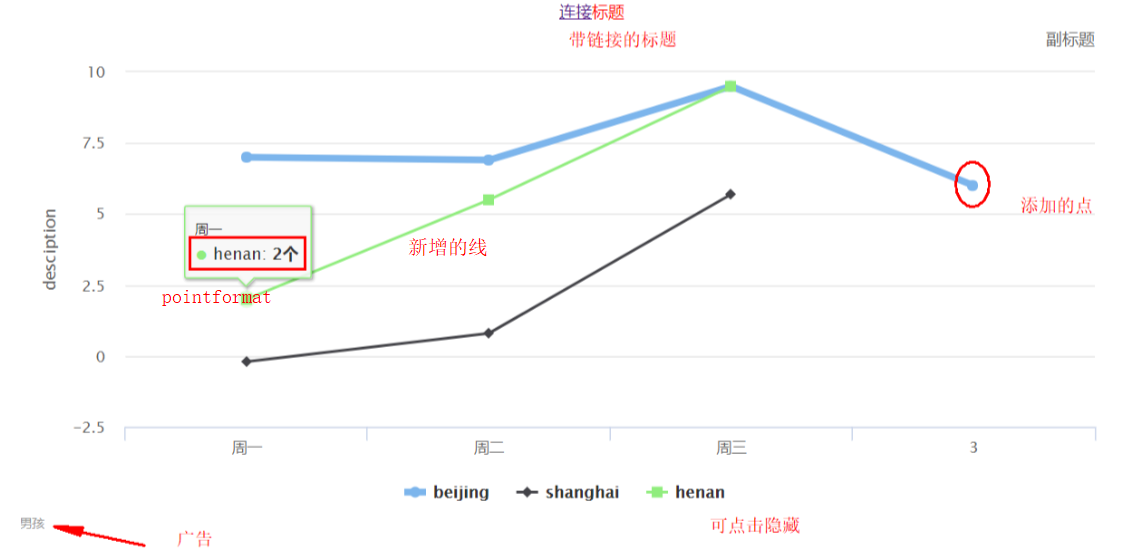
  1 <!DOCTYPE html>
  2 <html lang="en">
  3 <head>
  4     <meta charset="UTF-8">
  5     <title>Title</title>
  6
  7 </head>
  8 <body>
  9
 10     <div id="container" style="width: 800px;height: 400px;margin:0 auto;">
 11
 12     </div>
 13     <script src="/static/jquery-3.3.1.js"></script>
 14     <script src="/static/Highcharts-6.0.7/code/highcharts.js"></script>
 15     <script >
 16         Highcharts.setOptions({
 17             global: {
 18                 useUTC: false
 19             }
 20         });
 21         var chart = new Highcharts.Chart('container',{
 22             title: {
 23                 text: "<a href='http://www.baidu.com'>连接</a>标题",
 24                 useHTML: true,
 25                 x:20,          //移动的位置,+-:左右
 26                 style: {                         //设置字体样式
 27                     color: '#ff0000',
 28                     fontSize: '12px',
 29                     fontWeight: 'blod',
 30                     fontFamily: "Courier new"
 31                 }
 32             },
 33             subtitle:{
 34                 text:"副标题",
 35                 align:"right",   //位置
 36             },
 37             chart: {
 38                 events: {
 39                     load: function (e) {
 40                         // 图标加载时,执行的函数or去后台取数据
 41                     }
 42                 }
 43             },
 44             credits: {          //右下角广告
 45                 enable: true,
 46                 position: {
 47                     align: 'left',
 48                     verticalAlign: 'bottom'
 49                 },
 50                 text: '老男孩',
 51                 href: 'http://www.oldboyedu.com'
 52             },
 53 //            tooltip: {                    //Tooltip用于设置当鼠标滑向数据点时显示的提示框信息
 54 //                    backgroundColor: '#FCFFC5', //背景颜色
 55 //                    borderColor: 'red',  //边框颜色
 56 //                    borderRadius: 10,    //边框圆角
 57 //                    borderWidth:3,
 58 //                    shadow: true,         //是否显示阴影
 59 //                    animation: true,      //是否启用动画效果
 60 //                    style: {
 61 //                        color: 'ff0000',
 62 //                        fontSize: '12px',
 63 //                        fontWeight: 'blod',
 64 //                       fontFamily: "Courier new"
 65 //                    }
 66 //            },
 67             tooltip: {              //源码自定义
 68                 pointFormatter: function (e) {
 69                     var tpl = '<span style="color:' + this.series.color + '">●</span> ' + this.series.name + ': <b>' + this.y + '个</b><br/>';
 70                     return tpl;
 71                 },
 72                 useHTML: true
 73             },
 74             plotOptions: {      //点击触发的事件
 75                 series: {
 76                     cursor: 'pointer',
 77                     events: {
 78                         click: function (event) {
 79                             // 点击某个指定点时,执行的事件
 80                             console.log(this.name, event.point.x, event.point.y);
 81                         }
 82                     }
 83                 }
 84             },
 85
 86             xAxis:{
 87                 categories:["周一","周二","周三"]
 88             },
 89             yAxis:{
 90                 title:{
 91                     text:"desciption"
 92                 }
 93             },
 94             series:[{
 95                 name:"beijing",
 96                 data:[7.0,6.9,9.5],
 97                 lineWidth:5    //加粗
 98             },{
 99                 name:"shanghai",
100                 data:[-0.2,0.8,5.7]
101             }]
102         });
103
104     chart.addSeries({name:'henan',data: [2.0,5.5,9.5]});    //新增加一条线,不常用
105     // 参数:数值;是否重绘; isShift; 是否动画
106     chart.series[0].addPoint(6);                            //其中一条线延长
107
108
109
110     </script>
111
112 </body>
113 </html>
3、例3,动态增加值
在console添加chart.series[0].addPoint([1501689835377.358, 15.9])
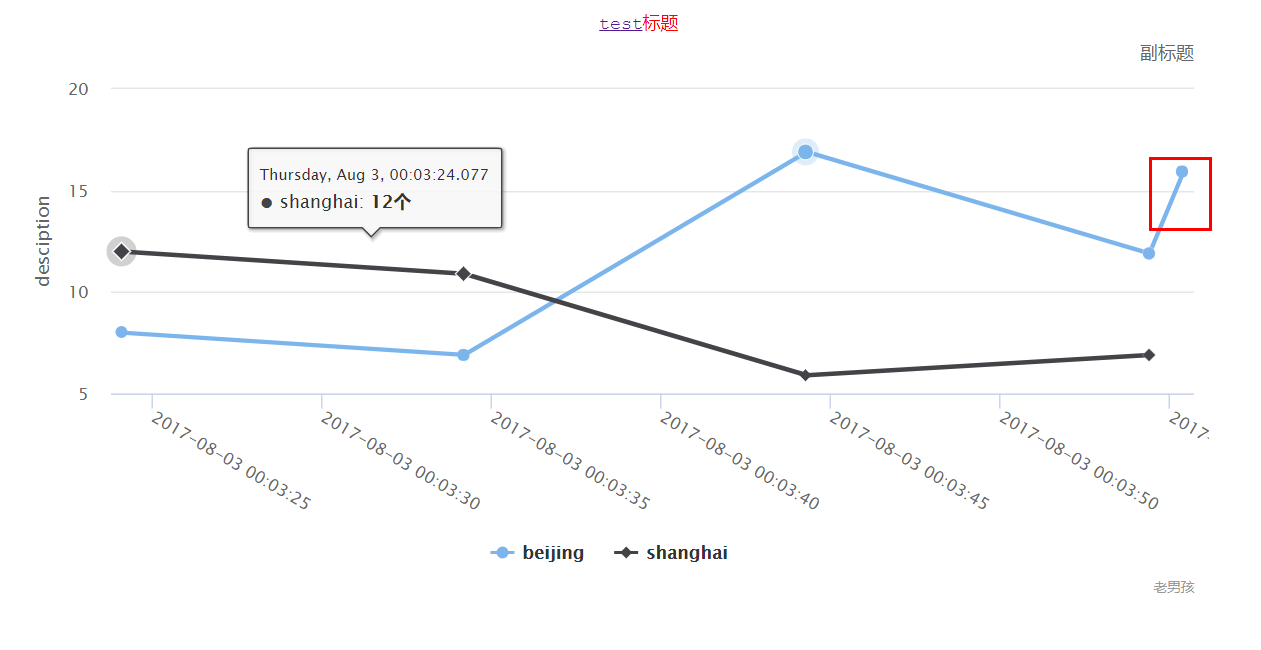
  1 <!DOCTYPE html>
  2 <html lang="en">
  3 <head>
  4     <meta charset="UTF-8">
  5     <title>Title</title>
  6
  7 </head>
  8 <body>
  9
 10     <div id="container" style="width: 800px;height: 400px;margin:0 auto;">
 11
 12     </div>
 13     <script src="/static/jquery-3.3.1.js"></script>
 14     <script src="/static/Highcharts-6.0.7/code/highcharts.js"></script>
 15     <script >
 16         Highcharts.setOptions({
 17             global: {
 18                 useUTC: false
 19             }
 20         });
 21         var chart = new Highcharts.Chart('container',{
 22             title: {
 23                 text: "<a href='http://www.baidu.com'>test</a>标题",
 24                 useHTML: true,
 25                 x:20,          //移动的位置
 26                 style: {                         //设置字体样式
 27                     color: '#ff0000',
 28                     fontSize: '12px',
 29                     fontWeight: 'blod',
 30                     fontFamily: "Courier new"
 31                 }
 32             },
 33             subtitle:{
 34                 text:"副标题",
 35                 align:"right",   //位置
 36             },
 37             chart: {
 38                 events: {
 39                     load: function (e) {
 40                         // 图标加载时,执行的函数or去后台取数据
 41                     }
 42                 }
 43             },
 44             credits: {          //右下角广告
 45                 enable: true,
 46                 position: {
 47                     align: 'right',
 48                     verticalAlign: 'bottom'
 49                 },
 50                 text: '老男孩',
 51                 href: 'http://www.oldboyedu.com'
 52             },
 53 //            tooltip: {                    //Tooltip用于设置当鼠标滑向数据点时显示的提示框信息
 54 //                    backgroundColor: '#FCFFC5', //背景颜色
 55 //                    borderColor: 'red',  //边框颜色
 56 //                    borderRadius: 10,    //边框圆角
 57 //                    borderWidth:3,
 58 //                    shadow: true,         //是否显示阴影
 59 //                    animation: true,      //是否启用动画效果
 60 //                    style: {
 61 //                        color: 'ff0000',
 62 //                        fontSize: '12px',
 63 //                        fontWeight: 'blod',
 64 //                       fontFamily: "Courier new"
 65 //                    }
 66 //            },
 67             tooltip: {              //源码自定义
 68                 pointFormatter: function (e) {
 69                     var tpl = '<span style="color:' + this.series.color + '">●</span> ' + this.series.name + ': <b>' + this.y + '个</b><br/>';
 70                     return tpl;
 71                 },
 72                 useHTML: true
 73             },
 74             plotOptions: {      //点击触发的事件
 75                 series: {
 76                     cursor: 'pointer',
 77                     events: {
 78                         click: function (event) {
 79                             // 点击某个指定点时,执行的事件
 80                             console.log(this.name, event.point.x, event.point.y);
 81                         }
 82                     }
 83                 }
 84             },
 85
 86             xAxis:{
 87                 type: 'datetime',
 88                     labels: {
 89                         formatter: function () {
 90                             return Highcharts.dateFormat('%Y-%m-%d %H:%M:%S', this.value);
 91                         },
 92                         rotation: 30
 93                     }
 94             },
 95             yAxis:{
 96                 title:{
 97                     text:"desciption"
 98                 }
 99             },
100             series:[{
101                 name:"beijing",
102                 data:[7.0,6.9,9.5],
103                 data: [
104                 [1501689804077.358, 8.0],
105                 [1501689814177.358, 6.9],
106                 [1501689824277.358, 16.9],
107                 [1501689834377.358, 11.9]
108                 ]
109             },{
110                 name:"shanghai",
111                 data: [
112                 [1501689804077.358, 12.0],
113                 [1501689814177.358, 10.9],
114                 [1501689824277.358, 5.9],
115                 [1501689834377.358, 6.9]
116                 ]
117             }]
118         });
119
120     // chart.addSeries({name:'henan',data: [2.0,5.5,9.5]});    //新增加一条线,不常用
121     // 参数:数值;是否重绘; isShift; 是否动画
122     // chart.series[0].addPoint(6);                            //其中一条线延长
123
124
125
126     </script>
127
128 </body>
129 </html>
以上内容是验证cobila后post上来的。

 浙公网安备 33010602011771号