
itchat分析微信好友的个性签名
itchat分析微信好友的个性签名
itchat是一个开源的微信个人号python接口(公众号、企业号接口为itchatmp)。使用它可以非常优雅地操纵个人微信号。文档链接
七夕到了,博主也要自娱自乐呀,“不知其人视其友“,为了对自己有更全面的了解,博主决定分析一下微信好友的个性签名。
安装
pip install itchat
实验原理
- 使用itchat接口采集好友数据
- 对好友性别进行统计分析,使用echart可视化展示
- 对好友的个性签名文本汇总,然后使用结巴分词法分词,最后用词云显示
采集好友数据
def getFriendsData():
    itchat.login() #这里需要扫码登录
    friends = itchat.get_friends()
    return friends #返回一个JSON对象
性别分析
性别统计
#统计性别比例
def sexStatistic(friends):
    male = 0
    female = 0
    other = 0
    for friend in friends:
        sex = friend['Sex']
        if sex==1:
            male += 1
        elif sex==2:
            female += 1
        else:
            other += 1 #出现other的原因是有些用户会不填写性别
    total = len(friends)
    male,female,other = map(lambda x:x*1.0/total,[male,female,other])
    displaySex(male,female,other,friends[0]['NickName']) #friends[0]['NickName']是登录者的名字(就是博主)
显示性别比
为了使数据更加直观,这里使用百度的echart库,echart本是JavaScript的数据可视化库,这里使用它的python接口
pip install echarts-python
def displaySex(male,female,other,user):
    from echarts import Echart, Legend, Pie
    chart = Echart(u'%s的微信好友性别比例'%user, 'from WeChat')
    chart.use(Pie('WeChat',[
        {'value': male, 'name': u'男性 %.2f%%' % float(male*100)},
        {'value': female, 'name': u'女性 %.2f%%' % float(female*100)},
        {'value': other, 'name': u'其他 %.2f%%' % float(other*100)}],
        radius=["50%", "70%"]))
    chart.use(Legend(["male", "female", "other"]))
    chart.plot()
运行结果会在浏览器中显示()
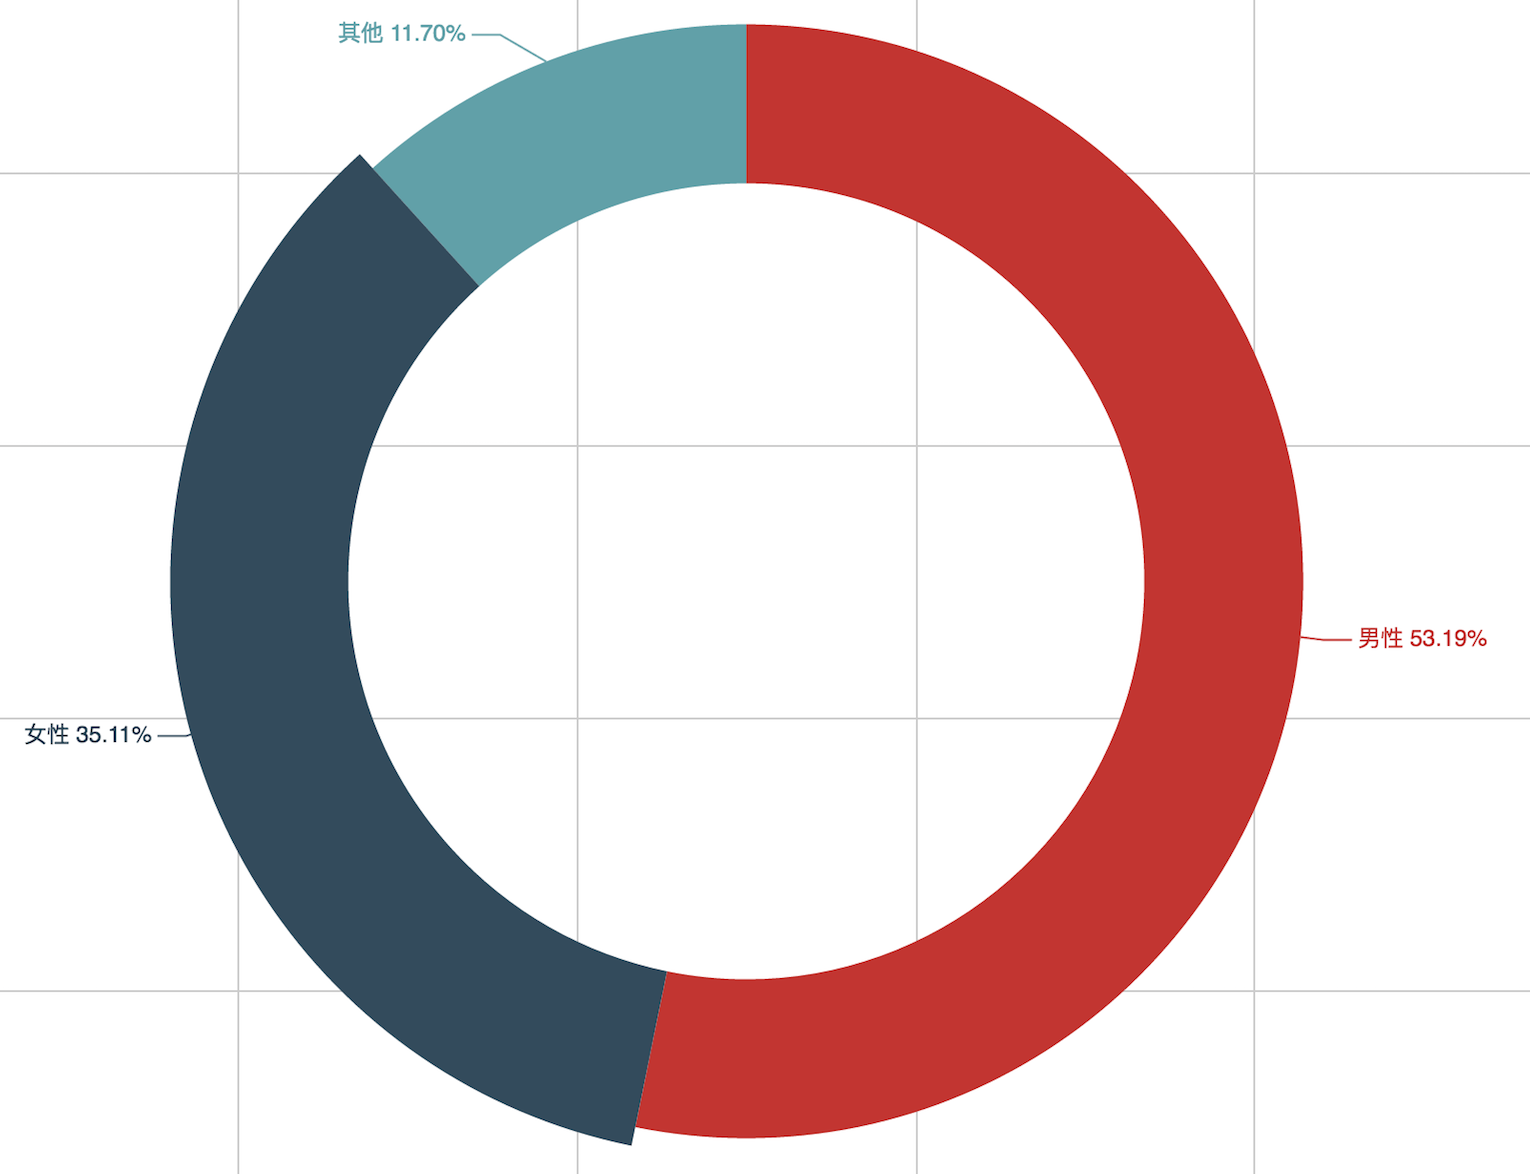
嗯,男女比还算协调。
个性签名分析
文本获取
def signatureStatistic(friends):
    import sys #设置编码
    reload(sys)
    sys.setdefaultencoding('utf-8')
    text = u''
    for friend in friends:
        signature = friend['Signature'].strip()
        if len(signature)>0 and not signature.startswith('<span'):
            text += friend['Signature']+' '
    displayWordCloud(text) #使用词云显示
词云分析
这里用到了结巴分词法。值得注意的是要过滤掉诸如”我“、”的“、“因为”、”就是“等无实际意义的stopword,网上可以找到中文的常见stopword列表
def displayWordCloud(text):
    import jieba #结巴中文分词
    import wordcloud #词云库
    from scipy.misc import imread #从scipy借用读取图片的模块
    import matplotlib.pyplot as plt #matplotlib纯粹用来辅助作图
    from collections import Counter

    #结巴分词
    jiebaText = list(jieba.cut(text,cut_all=True))
    #过滤stopword
    stopWords = open('./stopWord.txt').read().strip().split()
    jiebaText = [x for x in jiebaText if len(x)>0 and x not in stopWords]

    # 使用 counter 做词频统计,并转成字典
    wordDic = dict(Counter(jiebaText))
    bgimg = imread("./mask.jpg") # 返回numpy.ndarray类型的rgb数组
    myWordCloud = wordcloud.WordCloud(
        font_path="./font.otf", #特别注意,中文一定要有支持中文的字体,默认是没有的,要从外部引入
        background_color = "#242424", #背景色设置
        mask=bgimg, #词云的"模子",是一个数组
        width=1200,
        height=1200,
    )
    #生成词云图
    myWordCloud.generate_from_frequencies(wordDic)
    plt.imshow(myWordCloud)
    plt.axis("off")
    plt.show()
词云分析结果

最后,祝我的好友们七夕快乐~


 浙公网安备 33010602011771号