习题7.4
import numpy as np
import matplotlib.pyplot as plt
from scipy.interpolate import griddata
def f(x, y):
x2 = x**2
return (x2 - 2*x) * np.exp(-x2 - y**2 - x*y)
x_min, x_max = -3, 3
y_min, y_max = -4, 4
num_points = 1000
x_random = np.random.uniform(x_min, x_max, num_points)
y_random = np.random.uniform(y_min, y_max, num_points)
z_random = f(x_random, y_random)
grid_x, grid_y = np.mgrid[x_min:x_max:100j, y_min:y_max:100j]
grid_z = griddata((x_random, y_random), z_random, (grid_x, grid_y), method='cubic')
plt.figure(figsize=(10, 8))
plt.contourf(grid_x, grid_y, grid_z, levels=50, cmap='viridis') # 使用等高线图填充
plt.colorbar(label='f(x, y)')
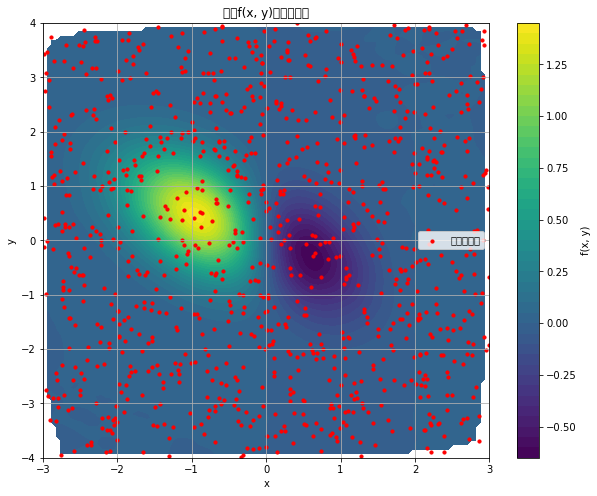
plt.scatter(x_random, y_random, c='red', s=10, label='随机散乱点') # 绘制随机散乱点
plt.title('函数f(x, y)的插值结果')
plt.xlabel('x')
plt.ylabel('y')
plt.legend()
plt.grid(True)
plt.show()
print("学号后四位:3008")结果如下图所示

 浙公网安备 33010602011771号