习题7.3
import numpy as np
import matplotlib.pyplot as plt
from scipy.interpolate import interp1d, CubicSpline
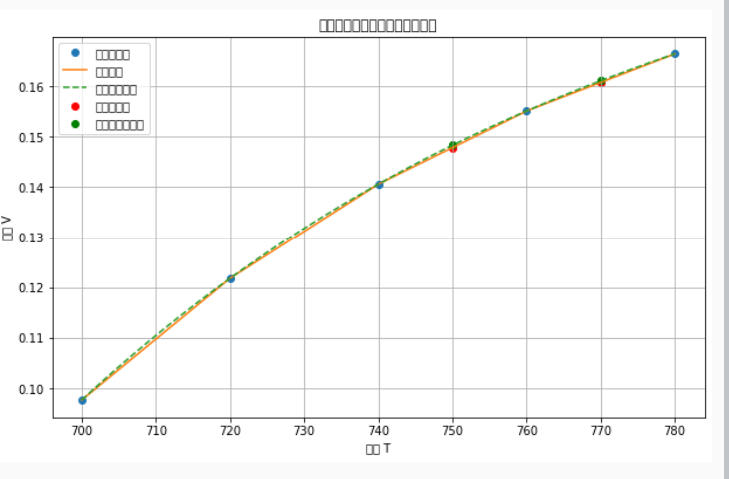
T = np.array([700, 720, 740, 760, 780])
V = np.array([0.0977, 0.1218, 0.1406, 0.1551, 0.1664])
T_interp = np.array([750, 770])
f_linear = interp1d(T, V, kind='linear')
V_linear_interp = f_linear(T_interp)
cs = CubicSpline(T, V)
V_cubic_interp = cs(T_interp)
print(f"线性插值结果: T={T_interp} 对应的 V={V_linear_interp}")
print(f"三次样条插值结果: T={T_interp} 对应的 V={V_cubic_interp}")
print("学号:3008")
x = np.linspace(700, 780, 400)
plt.figure(figsize=(10, 6))
plt.plot(T, V, 'o', label='原始数据点')
plt.plot(x, f_linear(x), '-', label='线性插值')
plt.plot(x, cs(x), '--', label='三次样条插值')
plt.scatter(T_interp, V_linear_interp, color='red', label='线性插值点')
plt.scatter(T_interp, V_cubic_interp, color='green', label='三次样条插值点')
plt.xlabel('温度 T')
plt.ylabel('体积 V')
plt.title('过热蒸汽体积随温度变化的插值')
plt.legend()
plt.grid(True)
plt.show()结果如下图所示

 浙公网安备 33010602011771号