
matplotlib plot 折线图使用体验
matplotlib plot 折线图使用体验
plot 只是默认情况下指代折线图,本身 plot 其实是 所有图标都可以表示。
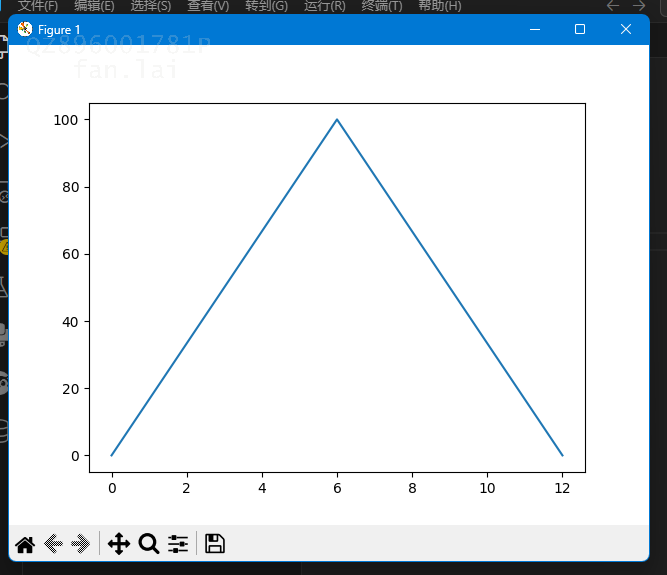
效果图
代码
import matplotlib.pyplot as plt
import numpy as np  # 存在感没有很高

# x 和 y 需要一一对应
xpoints = [0, 6, 12]
ypoints = [0, 100, 0]

plt.plot(xpoints, ypoints)
plt.show()

 浙公网安备 33010602011771号